2589
3D Cartesian T1rho Magnetic Resonance Fingerprinting Sequence Design for Evaluation of Cartilage and Skeletal Muscle in the Knee1Imaging Institute, Cleveland Clinic, Cleveland, OH, United States, 2Biomedical Engineering, Cleveland Clinic, Cleveland, OH, United States, 3Department of Biomedical Engineering, Case Western Reserve University, Cleveland, OH, United States, 4Department of Radiology, Case Western Reserve University, Cleveland, OH, United States
Synopsis
Magnetic resonance fingerprinting offers a promising framework by which to rapidly quantify T1rho relaxation alongside other tissue properties such as T1 and T2. However, T1rho-MRF has only recently been reported and sequence optimization remains under-explored, particularly for 3D sequences. Using a digital phantom constructed from real knee tissue property maps, we investigate sequence parameters for a 3D Cartesian T1rho-MRF sequence including preparation pulse scheduling and timing, flip angles, number of readouts, and acceleration factor. T1, T2, and T1rho quantification errors in cartilage and skeletal muscle were evaluated.
Introduction
T1rho relaxation has been reported as a biomarker of musculoskeletal disease, particularly in the degeneration of knee cartilage in osteoarthritis1. However, quantification can be prohibitively time consuming for widespread adoption. Magnetic resonance fingerprinting (MRF) has recently been reported for the rapid, simultaneous quantification of T1rho alongside other complementary tissue properties. However, despite encouraging reports, T1rho-MRF sequence optimization remains under-explored. Unlike the more typically applied MRF sequences that focus on T1 and T2 quantification, T1rho-MRF requires the use of spin-lock preparation pulses to sensitize the signal to T1rho relaxation. Thus, the design of T1rho-MRF sequences has an additional layer of complexity, requiring the selection of T1rho magnetization preparation schedules alongside considerations of T1 and T2 sensitivity. This complexity prompts the current study.T1rho-MRF work has focused on 2D non-Cartesian methods2,3, which may behave differently from 3D Cartesian methods. Non-Cartesian MRF often requires calibration or may suffer from gradient delays, concomitant gradients, or other k-space trajectory related errors that can degrade image quality. Non-Cartesian MRF also requires gridding operations that add additional computational burden beyond the typical fast Fourier Transform (FFT) for Cartesian MRF. While Cartesian MRF may have advantages in terms of computation or robustness to gradient-related errors, the appearance of undersampling artifacts may be worse with Cartesian methods. Interactions between the underlying MRF signal evolution and the superimposed undersampling artifact are difficult to anticipate without experimentation, particularly with the tissue property variations encountered in vivo.
In this work, we investigate the impact of preparation pulse schedules, flip angle pattern, acceleration factor, and number of readouts on T1, T2, and T1rho quantification in cartilage and skeletal muscle.
Methods
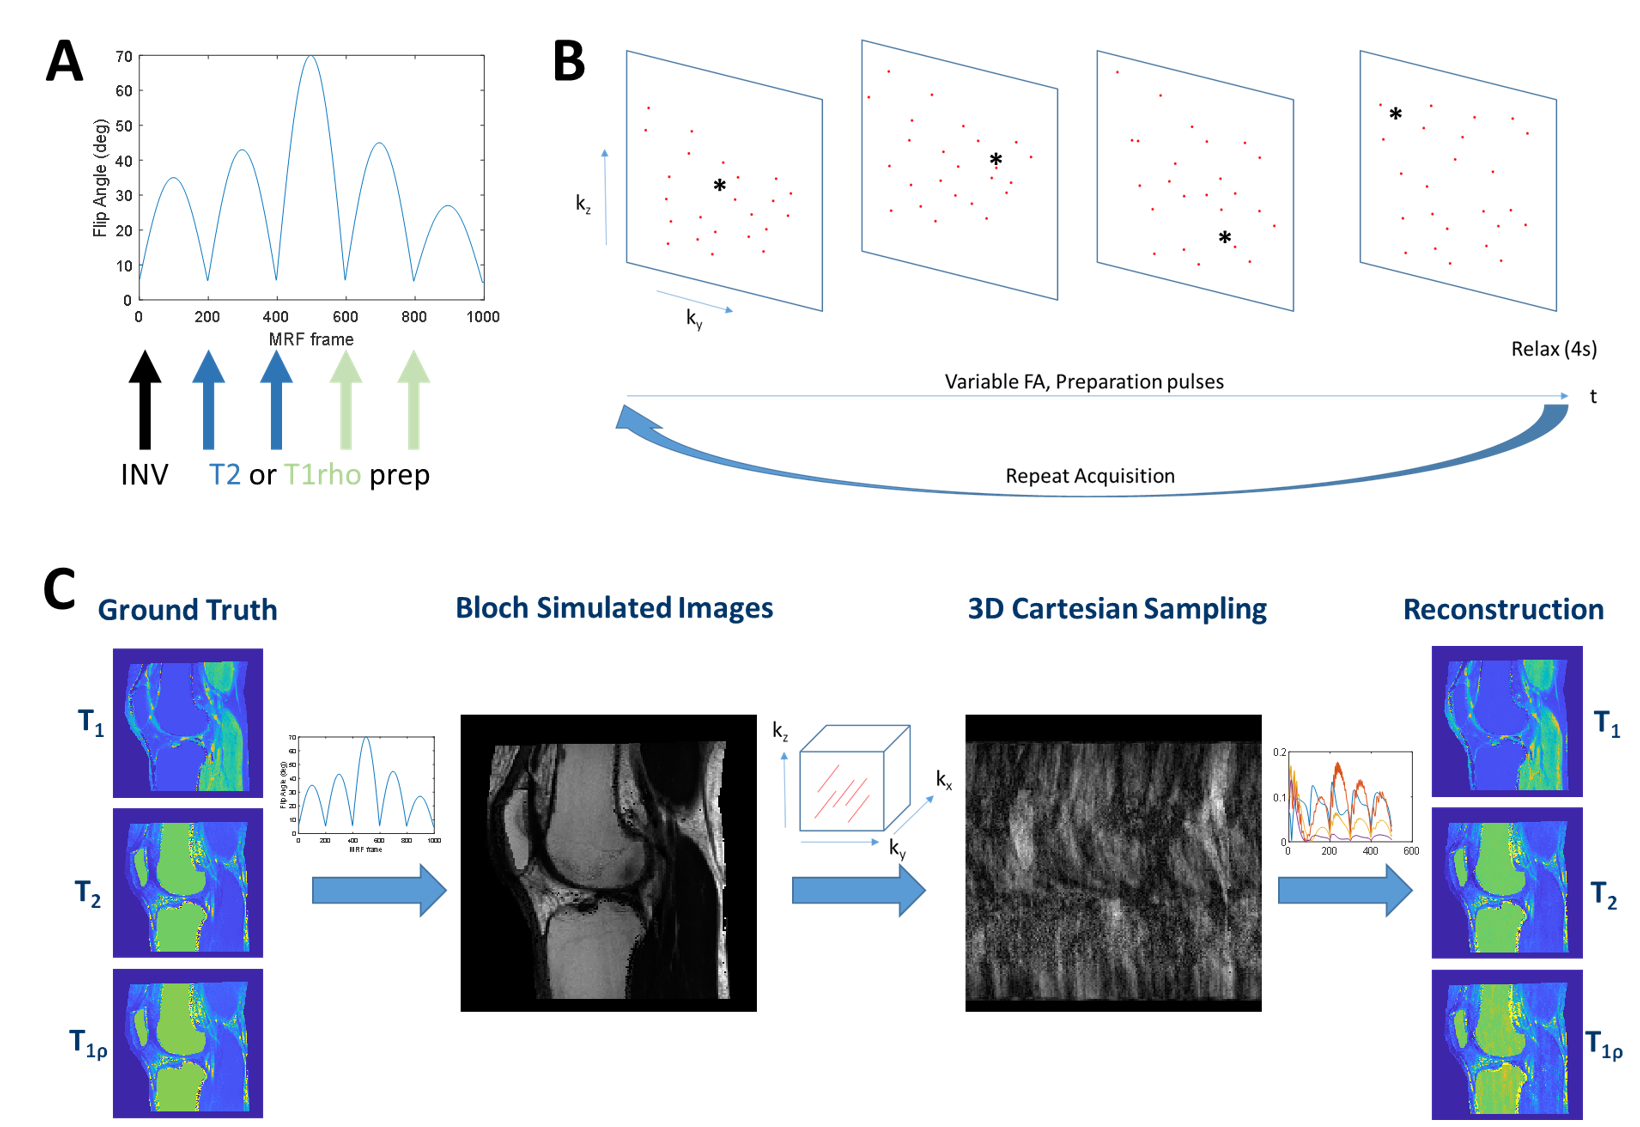
A realistic digital phantom was used for investigation of T1rho-MRF sequences based on T1, T2, and T1rho maps from subjects. T1 maps were obtained from a multislice 2D inversion recovery acquisition, while T2 and T1rho maps were obtained from MAPSS4 acquired on a 3T Prisma (Siemens) scanner from subjects after obtaining written informed consent under an IRB-approved protocol. Tissue property maps were obtained with FOV=160 mm, resolution=0.5x0.5x3 mm3, and between 24-32 slices. Tissue property maps were post-processed to create a knee mask and to replace poorly estimated bone marrow T2 and T1rho with literature values5. Volumetric regions of interest of articular cartilage from the femoral condyle and of skeletal muscle from the gastrocnemius were manually drawn.T1rho-MRF simulation used the digital phantom tissue property maps to generate simulated data. Maps were rescaled to the simulated T1rho-MRF resolution. In the T1rho-MRF sequence, the acceleration factor per MRF frame, flip angle pattern, repetition time pattern (constant TR=10 ms), echo time pattern (constant TE=5 ms), number of MRF frames, k-space sample points, and preparation pulses (inversion, T2-prep, spin-lock) were defined for a FISP-MRF sequence6 with 4π spoiling. A Bloch simulator was used to generate MRF signal evolutions for the prescribed sequence parameters. The tissue property maps were rounded to the nearest entry in the dictionary and the signal evolutions were used to simulate contrast changes over time. K-space sampling using a circular Cartesian trajectory (CIRCUS7) was used. Undersampled images for each MRF frame were computed by FFT. T1, T2, and T1rho maps were computed by voxelwise inner product pattern matching or wavelet-regularized low rank reconstruction8,9. Figure 1 shows T1rho-MRF sequence components and the simulation workflow. Nominal parameters unless otherwise stated were: R=12, flip angle as shown in Figure 1, 1000 MRF frames, resolution 0.8x0.8x9.6 mm3, 10 slices, and preparation schedules as shown in Figure 1 of the order: inversion (TI=21 ms), two T2-prep pulses (TE=40, 80 ms), two spin-lock pulses (TSL=40, 80 ms).
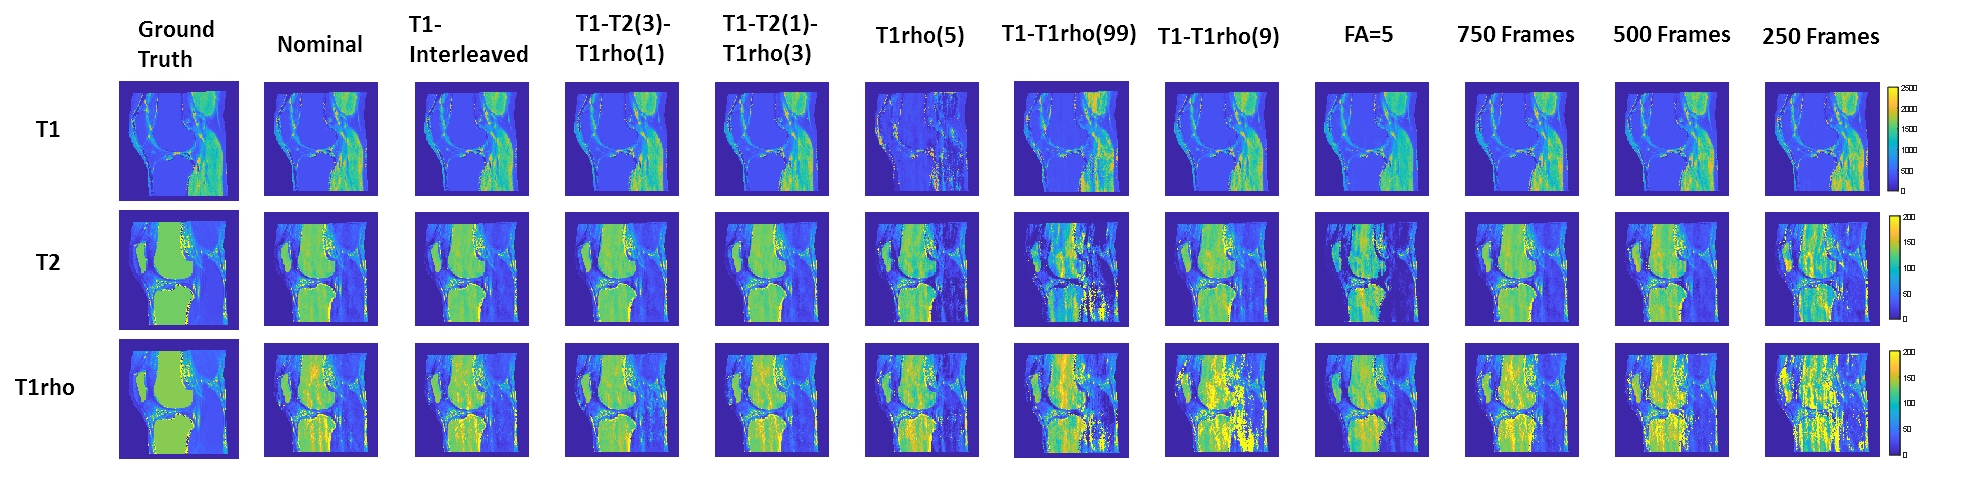
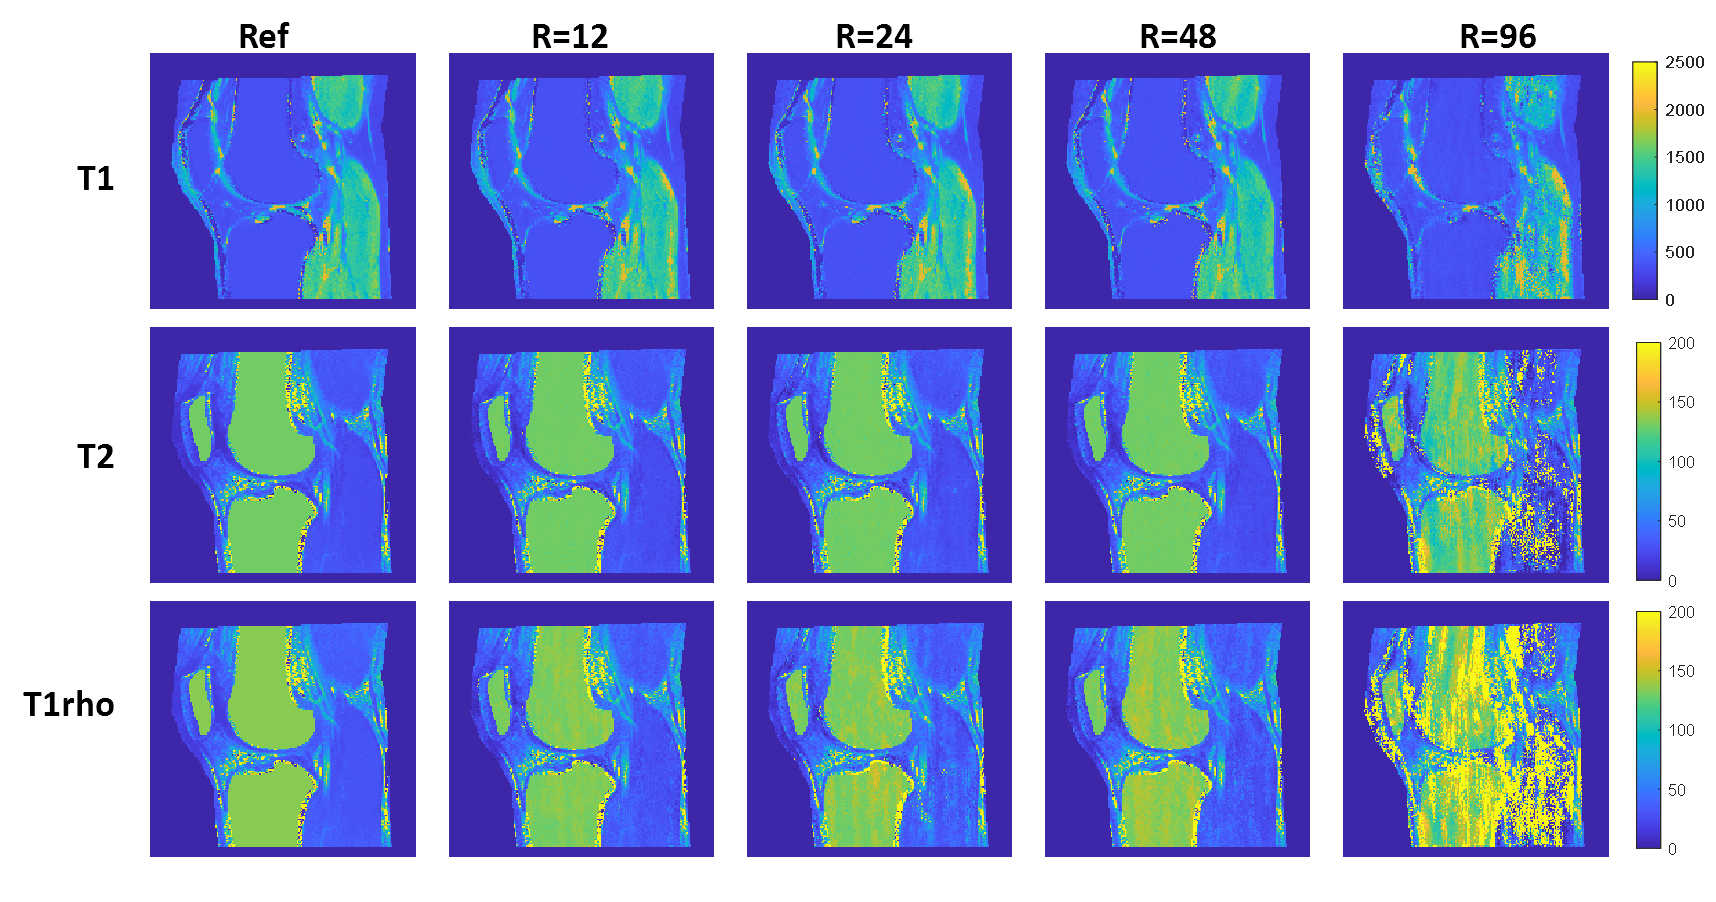
The following T1rho-MRF sequence parameters were investigated: (1) ordering of inversion, T2-prep, and spin-lock prep pulses, (2) number of spin-lock preparation pulses, (3) replacement of T2-prep pulses with spin-lock prep pulses, and (4) effect of acceleration factor. Root mean squared error (RMSE) in muscle and cartilage ROIs were evaluated.
Results
Figure 2 shows tissue property maps from preparation pulse experiments, (1)-(3). Tissue property maps were reconstructed with inner product matching.Figure 3 shows tissue property maps from the acceleration factor experiment (4).
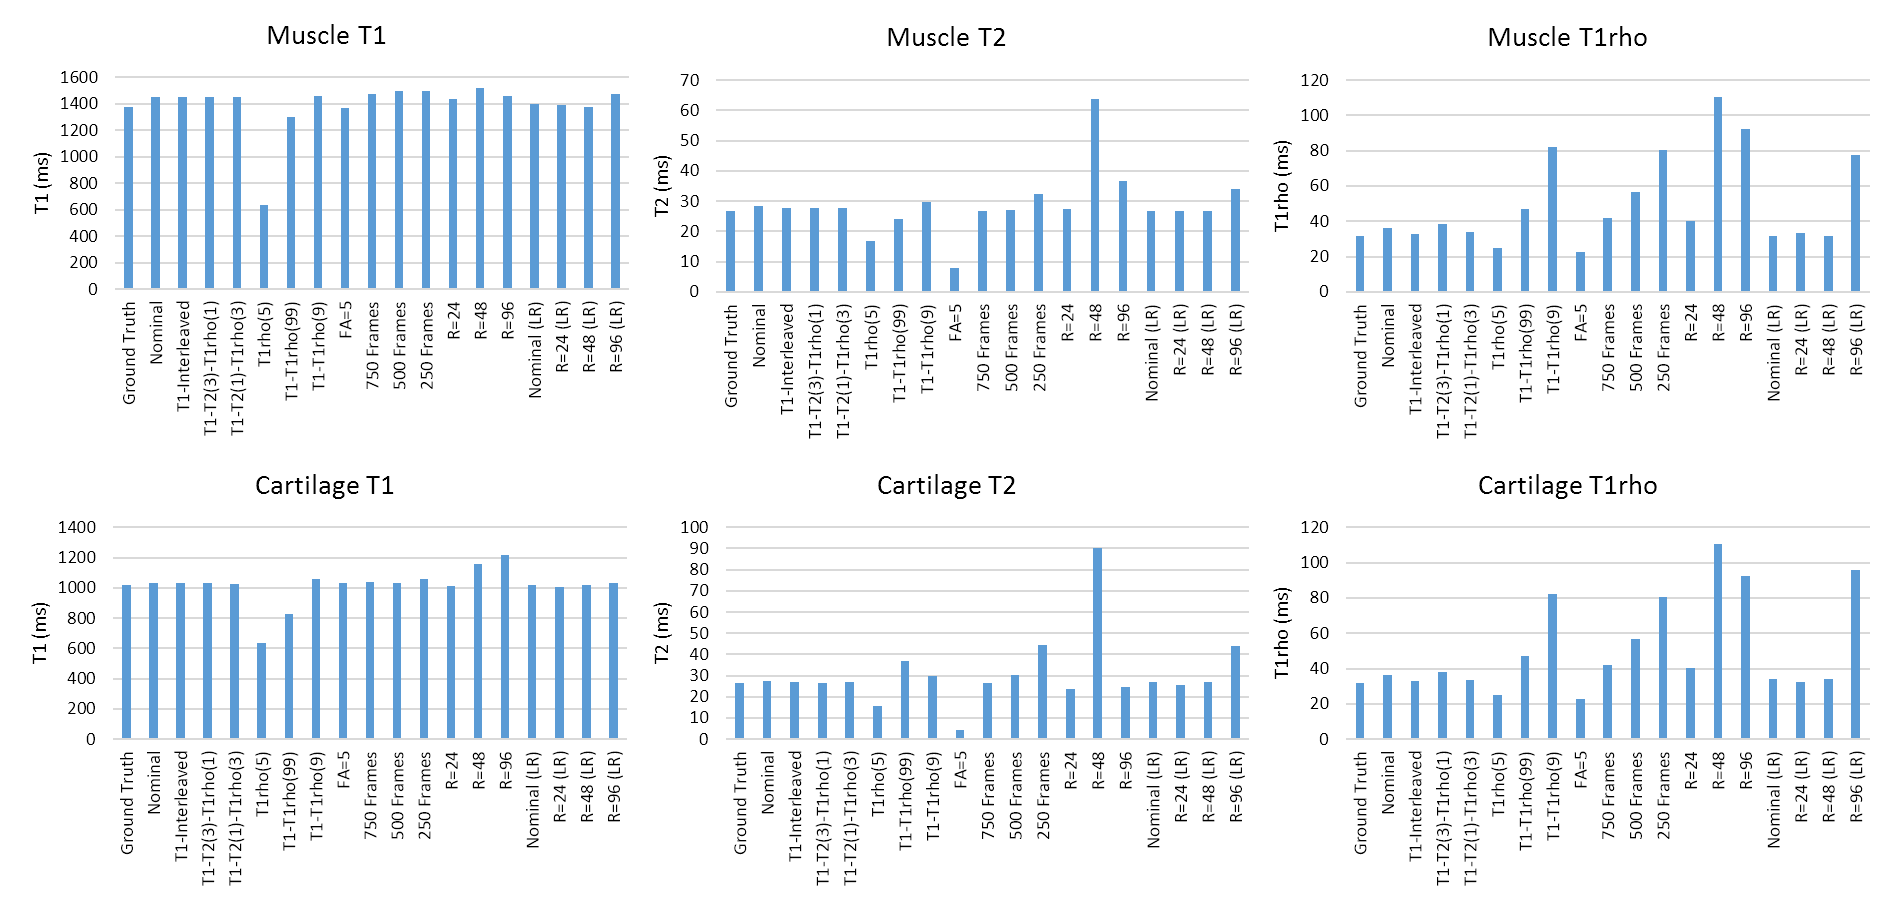
Figure 4 shows mean T1, T2, and T1rho values from each T1rho-MRF sequence in muscle and cartilage ROIs.
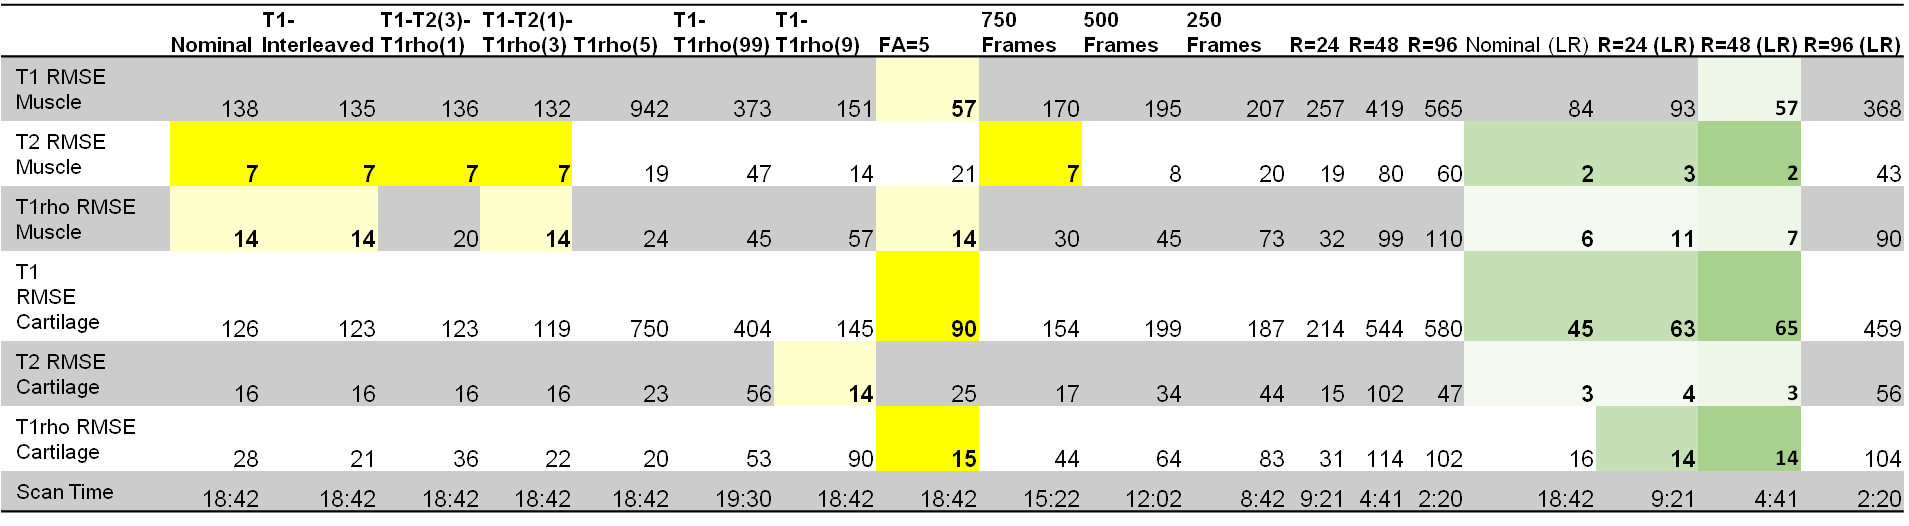
Table 1 shows RMSE of skeletal muscle and cartilage for the sequences investigated as well as estimated scan time.
Discussion
In simulations with realistic anatomy, 3D Cartesian T1rho-MRF simultaneously quantified T1, T2, and T1rho of articular cartilage and skeletal muscle at 0.8x0.8x9.6 mm3 resolution in <5 minutes via low rank reconstruction. Sequence parameters were investigated, with best results obtained when inversion and a combination of T2-preparation and spin-lock preparation were used, although the relative scheduling of these preparations had limited impact. We observed that more spin-lock preparations did not necessarily improve T1rho quantification. Undersampling artifacts in 3D Cartesian T1rho-MRF were severe, requiring modest acceleration (R=12) for acceptable image quality from inner product matching, notably below acceleration factors reported in other non-Cartesian MRF applications6. Wavelet regularized low rank reconstruction mitigated undersampling artifacts, enabling acceleration of up to R=48 with T1, T2, and T1rho quantification to between 0.1-6.9% error relative to ground truth. Although these findings are encouraging for 3D T1rho-MRF, real-world evaluations are needed and currently underway.Acknowledgements
This work was funded in part by the following sources T32AR007505. The content is solely the responsibility of the authors and does not necessarily represent the official views of the NIH.References
1. Li, X. et al. Cartilage T1ρ and T2 relaxation times: longitudinal reproducibility and variations using different coils, MR systems and sites. Osteoarthritis and cartilage 23, 2214–2223 (2015).
2. Wyatt, C. R., Barbara, T. M. & Guimaraes, A. R. T1ρ magnetic resonance fingerprinting. NMR in Biomedicine 33, e4284 (2020).
3. Sharafi, A. et al. Simultaneous T1, T2, and T1ρ relaxation mapping of the lower leg muscle with MR fingerprinting. Magnetic Resonance in Medicine (2021).
4. Li, X., Han, E. T., Busse, R. F. & Majumdar, S. In vivo T1ρ mapping in cartilage using 3D magnetization‐prepared angle‐modulated partitioned k‐space spoiled gradient echo snapshots (3D MAPSS). Magnetic Resonance in Medicine: An Official Journal of the International Society for Magnetic Resonance in Medicine 59, 298–307 (2008).
5. Gold, G. E. et al. Musculoskeletal MRI at 3.0 T: Relaxation Times and Image Contrast. American Journal of Roentgenology 183, 343–351 (2004).
6. Jiang, Y., Ma, D., Seiberlich, N., Gulani, V. & Griswold, M. A. MR fingerprinting using fast imaging with steady state precession (FISP) with spiral readout. Magnetic resonance in medicine 74, 1621–1631 (2015).
7. Liu, J. & Saloner, D. Accelerated MRI with CIRcular Cartesian UnderSampling (CIRCUS): a variable density Cartesian sampling strategy for compressed sensing and parallel imaging. Quant Imaging Med Surg 4, 57–67 (2014).
8. Assländer, J. et al. Low rank alternating direction method of multipliers reconstruction for MR fingerprinting. Magnetic Resonance in Medicine 79, 83–96 (2018).
9. Assländer, J., Glaser, S. J. & Hennig, J. Pseudo Steady-State Free Precession for MR-Fingerprinting. Magnetic Resonance in Medicine 77, 1151–1161 (2017).
Figures