2588
Evaluation of microsatellite instability in endometrial cancer using APTw combined with IVIM MR imaging1Department of Radiology, the First Affiliated Hospital of Dalian Medical University, Dalian, China, 2Philips Healthy(China), Beijing, China
Synopsis
Testing of Microsatellite Instability (MSI) is used to evaluate the prognosis of endometrial cancer (EC) to make the optimal treatment, and plays an important role to screen for Lynch syndrome. MSI had been detected by the traditional technology, such as PCR, IHC and Next Generation Sequencing(NGS), however, MSI also could be assessed using magnetic resonance imaging with the advantages of non-invasion and low-cost. This study aimed to investigate the clinical value in assessing the status of EC MSI with amide proton transfer weighted (APTw) imaging and intravoxel incoherent motion (IVIM) diffusion MR imaging.
Introduction and Purpose
To investigate the clinical feasibility in the assessment of MSI in EC using APTw combined with IVIM.Materials and Methods
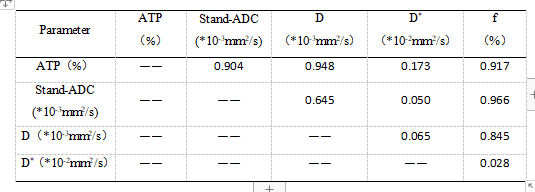
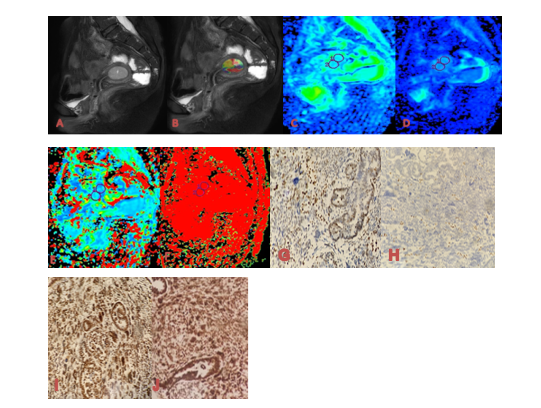
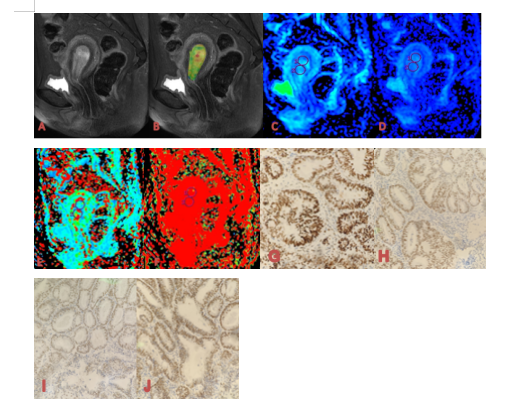
34 patients with EC confirmed by pathology were retrospectively analyzed in our hospital from August 2019 to September 2021. The cohort was divided into two groups, MSI group with n=12 and microsatellite stable (MSS) group with n=22, according to the immunohistochemical results (Table1). All patients underwent magnetic resonance examination including T1WI, T2WI, DWI, IVIM and APTw in a 3.0 T MR scanner prior to surgery, and the MRI sequences detailed in table 2. The APT signal intensity (SI) and the values of IVIM-DWI parameters (standard apparent diffusion coefficient, Stand-ADC; pure diffusion coefficient, D; pseudo diffusion coefficient, D* and perfusion fraction, f) were measured independently by two observers in a double blind method. The intra-group correlation coefficient (ICC) is used to test the consistency of the two observers. According to whether the data conforms to the normal distribution, the independent sample t test or the Mann-Whitney rank sum test was used to compare the group difference of each parameters. ROC curve was used to evaluate the diagnostic efficacy in evaluating the MSI status and the differences among AUCs were compared with Decadelong test .Results
The agreement between the measured values of the two observers is very good (ICC>0.75) . The APT SI and D* in MSI group were significantly higher than those in MSS group (2.73±0.51% and (0.49±0.14) ×10-2mm2/s vs. 2.30±0.40% and (0.29±0.03) ×10-2mm2/s, P < 0.05). The Stand-ADC, D and f in MSI group were significantly lower than those in MSS group ((0.51±0.08)×10-3mm2/s, (0.34±0.05)×10-3mm2/s and 0.45±0.09% vs.(0.59±0.11)10-3mm2/s,(0.39±0.06)×10-3mm2/s and 0.56±0.14%,P < 0.05) (As shown in the Table 3).The AUC values of APT SI, Stand-ADC, D, D* and f value in the MSI status of EC are 0.744, 0.727, 0.754, 0.924 and 0.731, respectively. Delong test results showed that AUC differences between Stand-ADC value and D* value and between f value and D* value were statistically significant (P<0.05), while the AUC differences between other parameter values were not statistically significantDiscussion and Conclusion
In this study, by combining APTw and IVIM sequences, MSI expression during EC tumor development was further studied at molecular and protein levels. In this study, the APT value of EC of the MSI group was higher than that of the MSS group, and the difference between the two was statistically significant.The reason for the analysis may be that MSI-related tumors usually have more lymphatic and vascular infiltrating growth and lymphocytes infiltrate the tumor tissue [1,2], which is speculated to cause an increase in the number of cells per unit volume and an increase in the level of metabolism. Increase the local protein or peptide of the tumor and increase the APT value of EC in the MSI group.
The parameter D* of the double exponential model is also called the perfusion coefficient. It represents the diffusion effect caused by blood perfusion and reflects the microcirculation perfusion in the capillaries [3]. In this study, the D* value of EC in the MSI group was higher than that of the MSS group and the f value was lower than that of the MSS group. Studies have reported [4,5] that MSI tumors have higher circulating endothelial progenitor cells and vascular endothelial growth factor (vascular endothelial growth factor). endothelial growth factor, VEGF) level, which suggests that MSI may promote tumor angiogenesis through a certain pathway to make it have a higher micro-vessel density.
The f-value of MSI is lower than that of the MSS group, which may be because the f-value is not only related to micro-vessel density and blood flow velocity, but also related to the difference in blood vessel wall pressure and b-value [6,7]. The influence of more factors such as flow information [8]. At the same time, previous literature reports show [9] that the choice of b value is different, and the size of f value is also different, so the f value changes greatly and the repeatability is poor.
In summary, APTw combined with IVIM multiple quantitative parameters have highlighted certain clinical application value in the assessment of EC MSI.
Acknowledgements
No
References
[1] van den Bos M, van den Hoven M, Jongejan E, et al. More differences between HNPCC-related and sporadic carcinomas from the endometrium as compared to the colon. Am J Surg Pathol, 2004, 28(6): 706-711.
[2] Howitt BE, Shukla SA, Sholl LM, et al. Association of polymerase e-mutated and microsatellite-instable endometrial cancers with neoantigen load, number of tumor-infiltrating lymphocytes, and expression of PD-1 and PD-L1. JAMA Oncol, 2015, 1(9): 1319-1323.
[3]Sauer M,Klene C,Kaul M,et al.Preoperative evaluation of pelvine lymph node metastasis in high risk prostate cancer with intravoxel incoherent motion (IVIM) MRI[J].Eur J Radiol,2018,107:1-6.doi: 10.1016/j.ejrad.2018.07.029.
[4]Otto W,Macrae F,SierdZiński J,et al.Microsatellite instability and manifestations of angiogenesis in stage IV of sporadic colorectal carcinoma[J].Medicine (Baltimore),2019,98(1):e13956.
[5] De Smedt L,Lemahieu J,Palmans S,et al. Microsatellite instable vs stable colon carcinomas:Analysis of tumour heterogeneity,inflammation and angiogenesis[J].Br J Cancer,2015,113(3): 500-509.[6] Matsuo K, Shimada M, Saito T, et al. Risk stratification models for para-aortic lymph node metastasis and recurrence in stage IB-IIB cervical cancer[J]. J Gynecol Oncol. 2018, 29(1): e11.
[7] Zheng W, Chen K, Peng C, et al. Contrast-enhanced ultrasonography vs MRI for evaluation of local invasion by cervical cancer[J]. Br J Radiol, 2018, 91(1091): 20170858.
[8] Cohen AD,Schieke MC,Hohenwalter MD,et al.The effect of low b-values on the intravoxel incoherentmotion derived pseudodiffusion parameter in liver[J].Magn Reson Med,2015,73(1):306-311.[9] Pang Y,Turkbey B,Bernardo M,et al. Intravoxel incoherent motion MR imaging for prostate cancer:an evaluation of perfusion fraction and diffusion coefficient derived from different b-value combinations. Magn Reson Med, 2013,69(2): 553-62.
Figures