2587
Quantitative T1 and T2 measurements of metastatic bone lesions in prostate cancer patients: MR fingerprinting versus standard quantitative MRI1Radiology/MRI Unit, Royal Marsden NHS Foundation Trust, Sutton/London, United Kingdom, 2Division of Radiotherapy and Imaging, Institute of Cancer Research, Sutton/London, United Kingdom, 3Radiology, University of Michigan, Ann Arbor, MI, United States
Synopsis
Magnetic resonance fingerprinting (MRF) generates fast, co-registered quantitative maps from a single acquisition. This prospective study evaluates MRF-derived measures of treatment-induced T1 and T2 changes in prostate cancer patients with metastatic bone disease, by comparison with existing quantitative T1 and T2 measurements. This study demonstrated a good correlation of MRF-derived T1 and T2 changes with existing quantitative methods, supporting the use of MRF for faster measurements in bone lesions.
Introduction
Magnetic resonance fingerprinting (MRF) generates co-registered quantitative maps from a single acquisition1. These acquisitions are faster than typical quantitative MR measurements and may re-open the way to using T1 and T2 measurements for assessment of tumours and normal tissues.Aim
This prospective study evaluates MRF-derived measures of treatment-induced T1 and T2 changes in prostate cancer patients with metastatic bone disease, by comparison with existing quantitative T1 and T2 measurements.Patient cohort
A cohort of 13 patients with metastatic prostate cancer (mean age: 68 years, range: 57-76) with focal active pelvic bone lesions were recruited according to an ethics and research board approved protocol and were scanned before and after the start of a new line of treatment. The follow-up scan was usually performed after an average of 3.3 months (range: 2-6 months).Methods
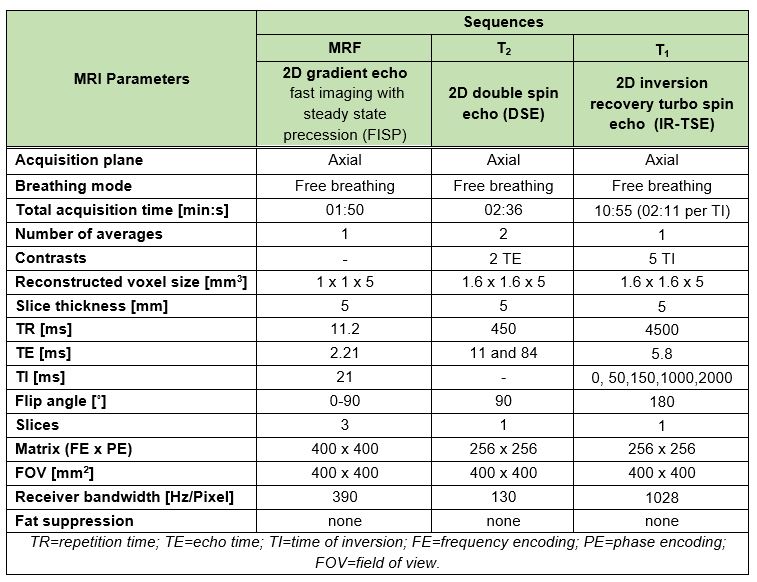
All imaging was performed on a 1.5T MAGNETOM Aera scanner (Siemens Healthcare, Erlangen, Germany) using a prototype MRF Fast Imaging with Steady State Precession (FISP) sequence2 with Gadgetron reconstruction3 which yields maps of T1 and T2 relaxation times, and proton density M0. Established sequences were utilised as comparative techniques for T1 (inversion recovery turbo spin echo, IR-TSE) and T2 (double spin echo, DSE) measurements. These sequences were validated against the ISMRM/NIST MRI system phantom (CaliberMRI, Inc, Boulder, CO), and were accurate to within 9% (T1) and 12% (T2) over the T1 and T2 ranges observed in the patients in this study. The MR parameters of MRF and standard quantitative T1 and T2 sequences were matched as best as possible, see Table 1. To limit the total acquisition time to 15 minutes, the T1 (5 inversion times) and T2 measurements (2 echo times) were acquired from a single axial slice covering the biggest active lesion in the pelvis. The MRF sequence covered 3 slices, with its central slice having matched location and field-of-view to the other measurements slice.The MRF, IR-TSE and DSE added 15 minutes to the end of routine clinical scans that included diffusion-weighted imaging (DWI) and T1-weighted Dixon sequences. DWI and Dixon sequences were used to identify the active target lesion (high signal on b=900 s/mm2 images, low signal on apparent diffusion coefficient map, and low signal on post-processed fat-fraction Dixon images). No contrast agent was administrated during the scanning session.
Regions of interest (ROIs) drawn on the MRF M0 image (using the DWI and Dixon images as a visual guide) were copied to MRF T1 and T2 images, as well as to the other T1 and T2 maps, which were calculated using an in-house software (MATLAB R2019a, The MathWorks, Inc.). Lesion ROIs were drawn for each patient, at each visit, using Horos software (Horosproject.org) and saved to DICOM-RT using a pyOsiriX plugin4. ROI-derived statistics (median and standard deviation values) for each map and Spearman correlation tests were obtained using MATLAB. Spearman correlation coefficients were considered according to the following scale: weak (0.0-0.39), moderate (0.4-0.59), strong (0.6-0.79) and very strong (0.8-1).
Results
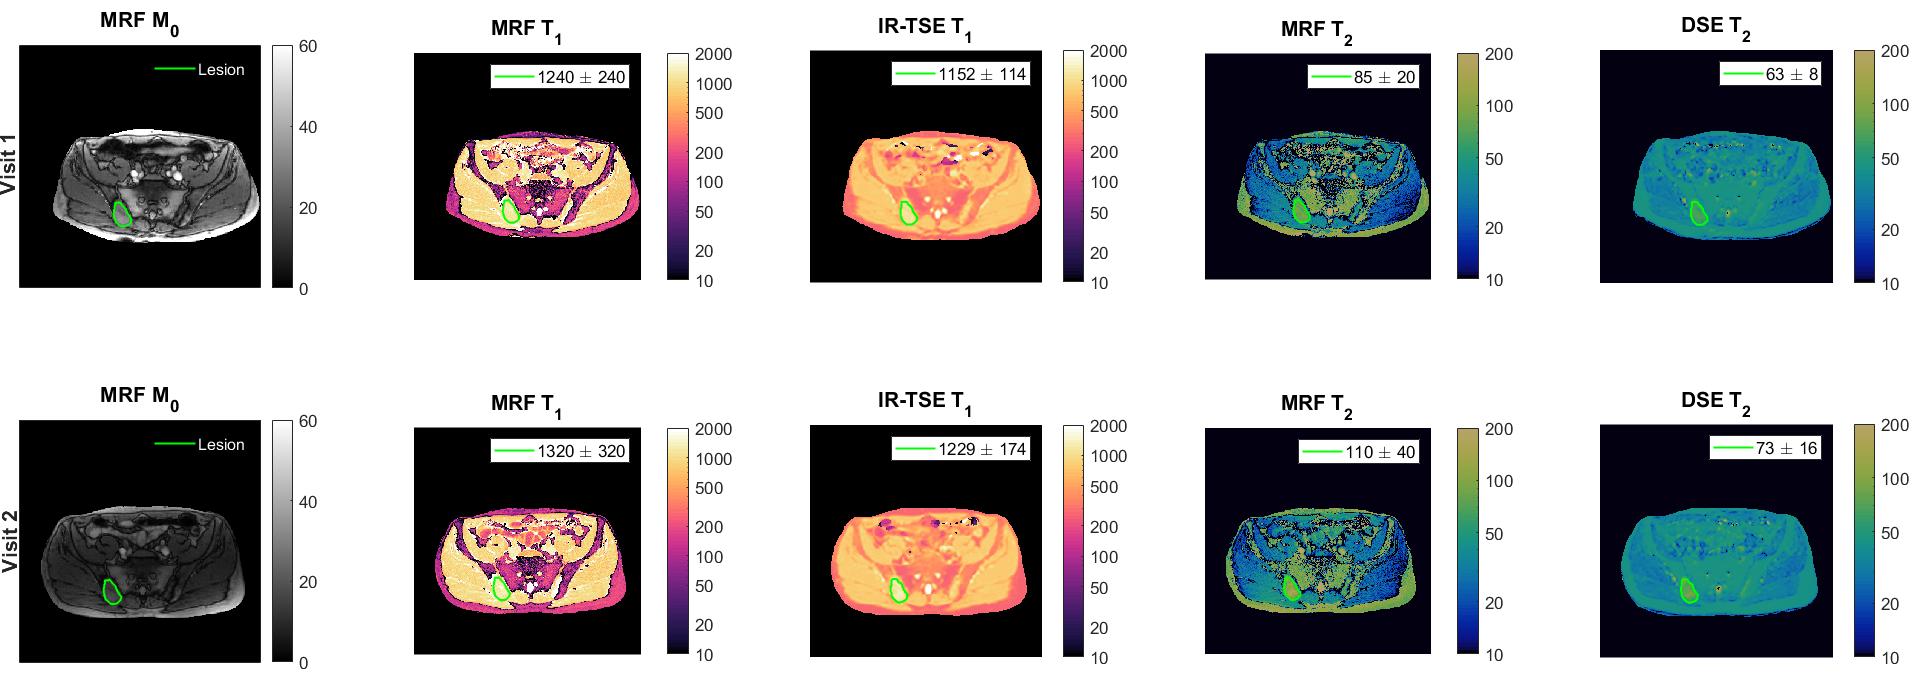
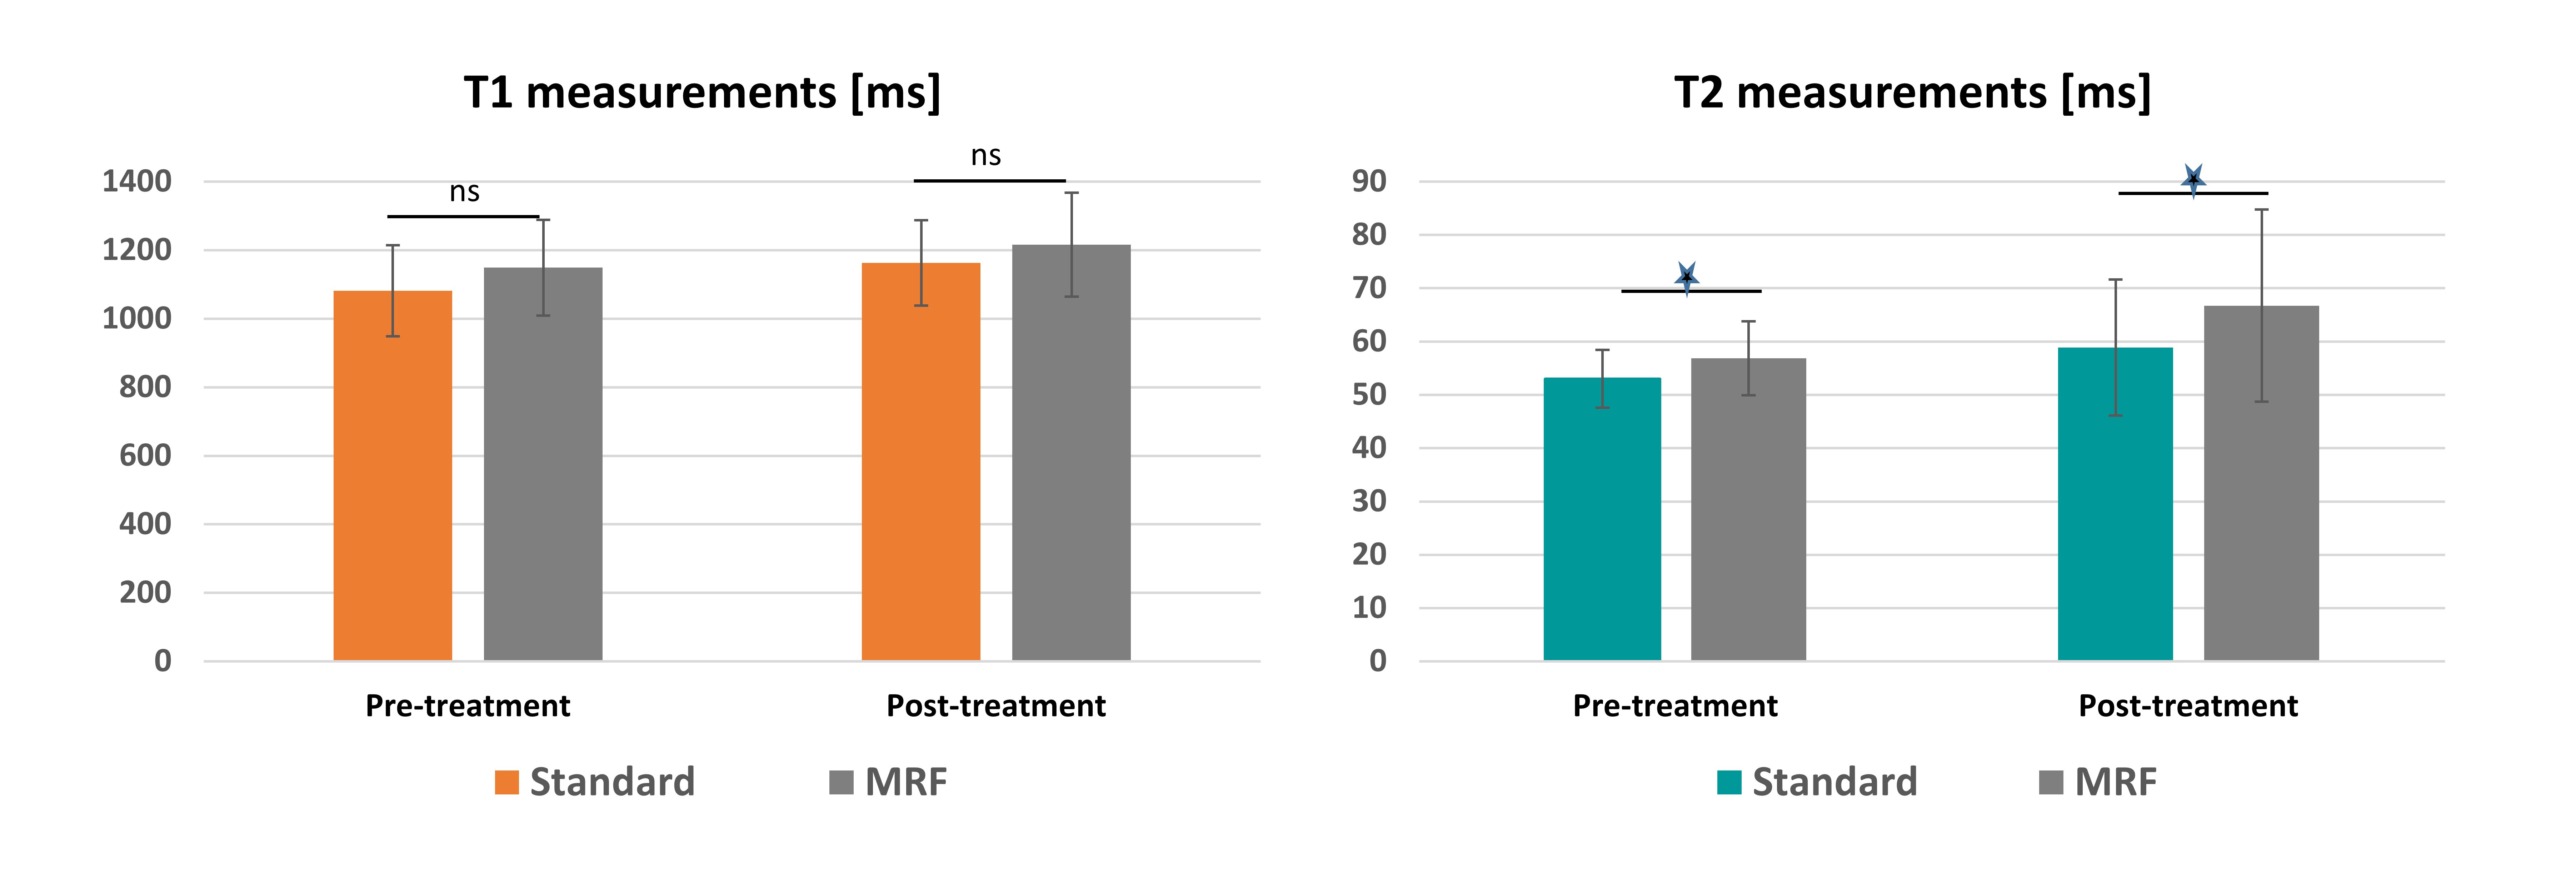
Figure 1 shows example MRF- and IR-TSE T1 and DSE T2 maps acquired on the same patient before (first row) and after treatment (second row) with overlaid contours delineating the selected active lesion.Cohort summary results (mean and standard deviation values) are plotted in Figure 2, showing no significant statistical differences between IR-TSE and MRF T1 measurements at both time-points, while T2 measurements showed significant differences at both time-points.
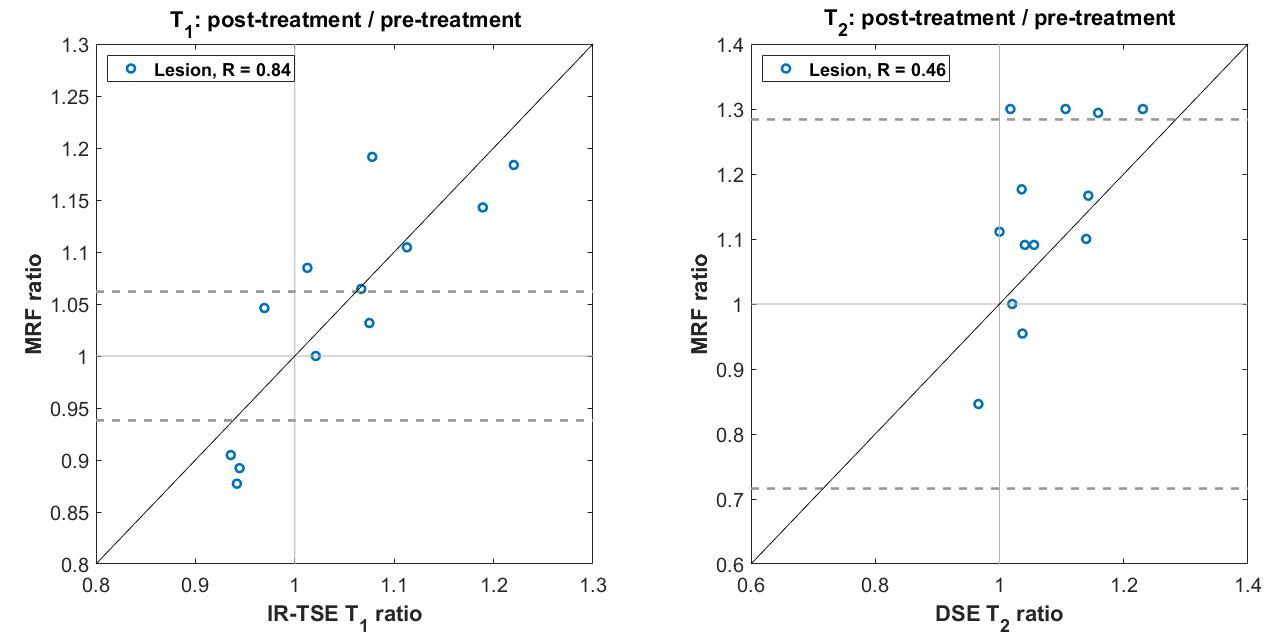
Figure 3 compares the treatment-related changes induced in pelvic bone metastases observed using the MRF and existing quatitative methods, where a very strong correlation was found for T1 relative changes (Spearman R=0.84) and a moderate correlation for T2 relative changes (R=0.46). In addition, 9/13 patients had relative MRF T1 changes outside the limits of agreement (LoA) values previously obtained using this imaging sequence5, while 4/13 patients with significant changes were detected with MRF T2.
Discussion
This cohort included patients with a high burden disease who had exhausted several lines of treatment, and so a variety of T1 and T2 treatment responses (magnitude and trend) were expected in this group. Nevertheless, the same trend of increased T1 and T2 values post-therapy was observed with both standard and MRF methods across the cohort (Figure 2). Whilst the range of relative changes in T1 and T2 measures were similar (0.87 – 1.2 for T1; 0.84 – 1.3 for T2), the tighter limits of agreement on the T1 measures (relative repeatability coefficient: 6.2% for T1, 28.4% for T2) meant that more patients had significant changes detected with T1 than with T2. This is consistent with previous evaluations of the repeatability of T1 and T2 measures obtained with MRF in other tissue types6.Conclusion
This study demonstrated a good correlation of MRF-derived T1 and T2 measurements with existing quantitative methods, supporting the use of MRF for faster measurements in bone lesions.Acknowledgements
We acknowledge the support of NHS funding to the NIHR Biomedical Research Centre and NIHR Royal Marsden Clinical Research Facility. This report is independent research funded partially by the National Institute for Health Research. The views expressed in this publication are those of the author(s) and not necessarily those of the NHS, the National Institute for Health Research or the Department of Health.References
1. Ma D, et al., Magnetic resonance fingerprinting. Nature. 2013 14; 495(7440):187–192.
2. Jiang Y, et al. MR Fingerprinting Using Fast Imaging with Steady State Precession (FISP) with Spiral Readout, Magn. Reson. Med. 2015; 74(6):1621-1631.
3. Lo W-C, et al. MR Fingerprinting using a Gadgetron-based reconstruction, Proc. ISMRM 2018, #3525.
4. Blackledge MD, et al., Rapid development of image analysis research tools: Bridging the gap between researcher and clinician with pyOsiriX. Comput Biol Med. 2016; 69:203-12.
5. Orton M, et al, Short-term repeatability of magnetic resonance fingerprinting for T1 and T2 measurements of metastatic bone lesions in prostate cancer patients, Proc. ISMRM 2020, #2675
6. Jiang Y, et al. Repeatability of magnetic resonance fingerprinting T1 and T2 estimates assessed using the ISMRM/NIST MRI system phantom. Magn Reson Med. 2017; 78(4):1452-1457
Figures