2585
Quantifying confidence in the OE-MRI biomarker pOxy-R using bootstrap analysis1Division of Cancer Sciences, University of Manchester, Manchester, United Kingdom, 2Centre for Medical Image Computing, University College London, London, United Kingdom, 3Bioxydyn Limited, Manchester, United Kingdom
Synopsis
OE-MRI is an emerging technique for identifying, mapping and quantifying tumour hypoxia. Current analysis is based on combining data with a perfusion map and categorising each voxel absolutely as hypoxic, normoxic or necrotic. In this study we use bootstrap analysis to map the uncertainty on the biomarker pOxy-R. We investigate how this performs in synthetic tumour data before applying the method to data from 9 patients with rectal cancer undergoing chemoradiotherapy. Bootstrapping enabled estimates of confidence intervals for change, thus identifying those patients who exhibited hypoxia modification on therapy.
Introduction
Tumour hypoxia predicts poor treatment outcome. Oxygen-enhanced MRI (OE-MRI) can identify, map and quantify the presence of tumour hypoxia and its subsequent modification with therapy1-2. This is achieved by combining OE-MRI with assessment of tumour perfusion, allowing spatial classification of voxels classed as normoxic, necrotic or hypoxic (figure 1a)3, with voxels that are perfused but refractory to oxygen challenge (termed pOxy-R) validated as measuring hypoxia1-3. These methods apply voxelwise t-tests to determine whether there is signal enhancement which can bias the measurements towards overestimating the presence of hypoxia with the level of bias dependent on noise level. We present a bootstrapping method to quantify an unbiased measurement of the tumour pOxy-R fraction and spatial mapping of the within voxel confidence of the hypoxia/normoxia/necrosis classification. From this we derive a per-patient confidence interval for the pOxy-R measurement enabling the significance of change in hypoxia to be determined.Methods
Simulations and bootstrapping methodsWe generated synthetic dynamic OE curves with Gaussian-distributed noise with a standard deviation of 10, 25 and 40 on a baseline of 300 arbitrary units of signal to form a synthetic tumour of size 16x8 voxels. The synthetic tumour experienced signal changes in a stepwise manner of +/- 20 units from baseline. Half of the voxels showed signal reduction.
1000 resampled curves were generated using samples of the residuals from the mean of the baseline and (potentially) enhancing portions of the curve to assess for increase in signal within each voxel. If the mean post-baseline signal of a sample was greater than the mean baseline signal then the sample was classified as perfused and oxygen-enhancing (pOxy-E), otherwise it was classified as pOxy-R.
Colour spatial maps were produced on a linear scale from blue to yellow according to the proportion of the samples of each voxel assigned as pOxy-E or pOxy-R, respectively (figure 1b). Taking each sample of the whole tumour in turn, we determined 1000 estimated pOxy-R fractions. We calculated the median pOxy-R fraction and used the central 95th percentiles to determine the 95% confidence interval.
Clinical data
OE-MRI data were acquired on a Philips Achieva 1.5T scanner from 9 patients with rectal cancer both before treatment and at day 7 of chemoradiotherapy. Written informed consent was provided following ethical approval. Dynamic OE-MRI signals were acquired on air with gas switch to 100% O2 on the 14th time point. Dynamic contrast-enhanced MRI (DCE-MRI) measurements were used to assign voxels as perfused or non-perfused. Sequence details are summarised in table 1. Tumours were outlined by a consultant radiologist (JOC), and the 1000 pOxy-R fractions for each bootstrap over the tumour were calculated by taking the fraction of voxels showing mean change in the DCE curve>0 and mean change in the OE curve<=0. Noise was resampled over the bootstrap samples using the residuals from the mean of the baseline and the (potentially) enhancing portion of the curve (as above). The 1000 samples of pOxy-R formed a distribution and the central 95th percentiles determined the 95% confidence interval. The colour scale shown in Figure 1b was used to map the distribution of classifications received by each voxel.
Results
SimulationsFigure 2a shows example synthetic curves depicting oxygen-enhancement and oxygen reduction at the three different noise levels. Synthetic maps from the bootstrap analysis are shown (figure 2b) along with plots of pOxy-R fraction at the three noise levels (including 95th percentiles on the median pOxy-R fraction; figure 2c). This bootstrap analysis provides an unbiased estimate of the volume of tissue enhancing under increased oxygen over a range of noise levels. Additional noise increases the uncertainty of the voxel pOxy-R fraction, but the accuracy is not significantly changed.
Clinical data
Figure 3(a) shows hypoxia maps for three rectal cancer patients with a range of baseline hypoxic fractions and differential responses to therapy (no change, reduced hypoxia and increased hypoxia). The maps are solidly coloured where the analysis shows high confidence for a given voxel in the classification of non-perfused tissue, hypoxia or normoxia. The histograms (figure 3b) show where significant change in pOxy-R has been observed. Overall, there was no significant change in hypoxia at the cohort level. Figure 4 shows a waterfall plot of change in pOxy-R fraction for all 9 patient tumours, with 6 patients having 95th percentiles that did not overlap zero, suggestive of significant therapy induced change. Two patients showed significant increase in pOxy-R whereas 4 patients showed significant reduction.
Discussion and Conclusion
OE-MRI with perfusion mapping enables hypoxia to be identified and tracked following chemoradiotherapy in rectal cancer. Here we advance current analysis methodology by producing estimates of confidence in whole tumour pOxy-R changes and spatially mapping the classification confidence in each voxel. Doing so improves measurement accuracy and through generation of a confidence interval enables a statistical assessment of per patient change without need for double baseline repeatability data. These methods are likely to be useful in measuring the efficacy of hypoxia-modifying agents and in targeting treatments to hypoxic subregions of tissue.Acknowledgements
No acknowledgement found.References
[1] O'Connor et al, Oxygen-enhanced MRI accurately identifies, quantifies, and maps tumor hypoxia in preclinical cancer models. Cancer Research, 2016 Feb 15;76(4):787-95.
[2] Salem et al, Oxygen-enhanced MRI Is Feasible, Repeatable, and Detects Radiotherapy-induced Change in Hypoxia in Xenograft Models and in Patients with Non-small Cell Lung Cancer. Clinical Cancer Research, 2019 Jul 1;25(13):3818-3829.
[3] Little et al, Mapping Hypoxia in Renal Carcinoma with Oxygen-enhanced MRI: Comparison with Intrinsic Susceptibility MRI and Pathology. Radiology, 2018 Sep;288(3):739-747.
Figures
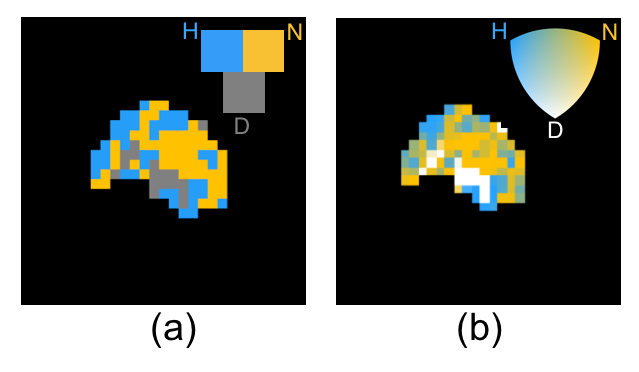
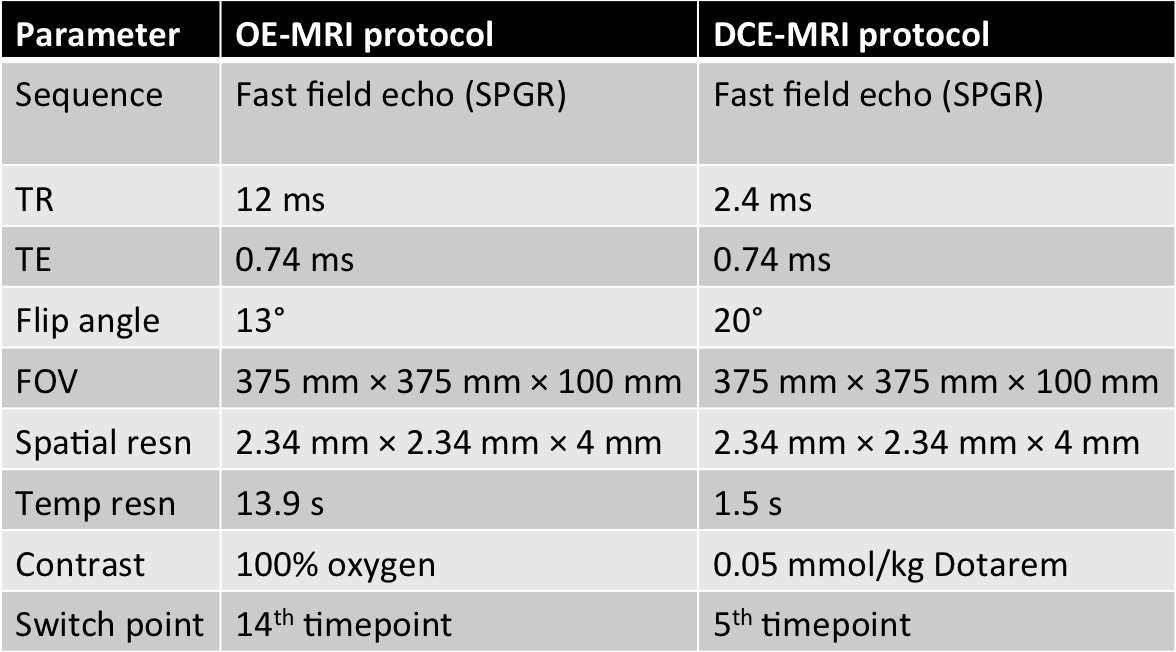
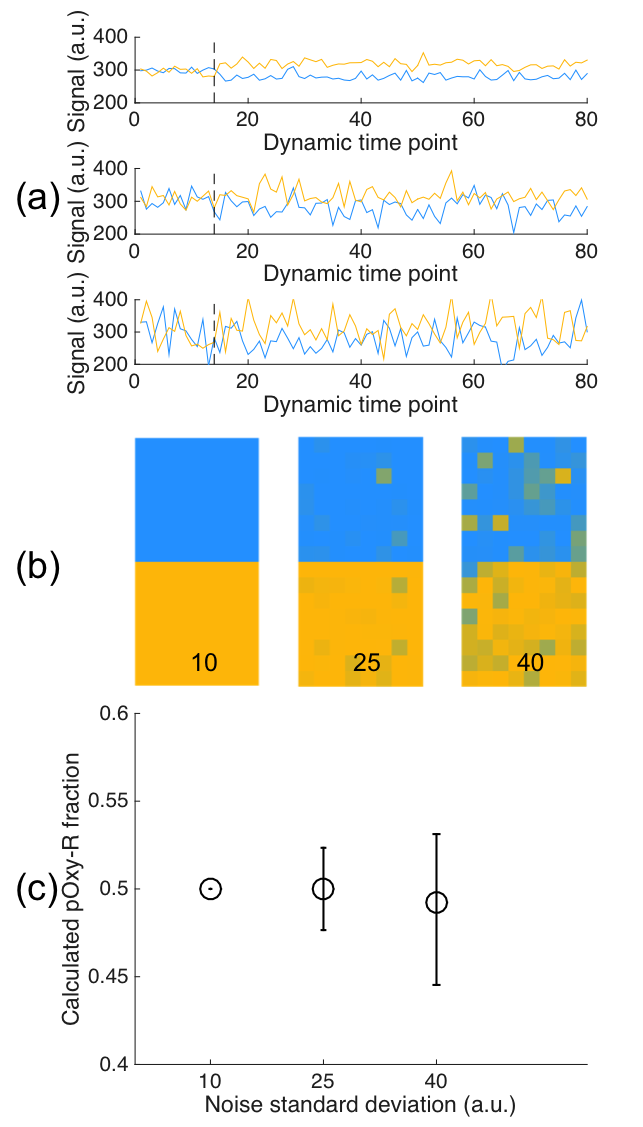
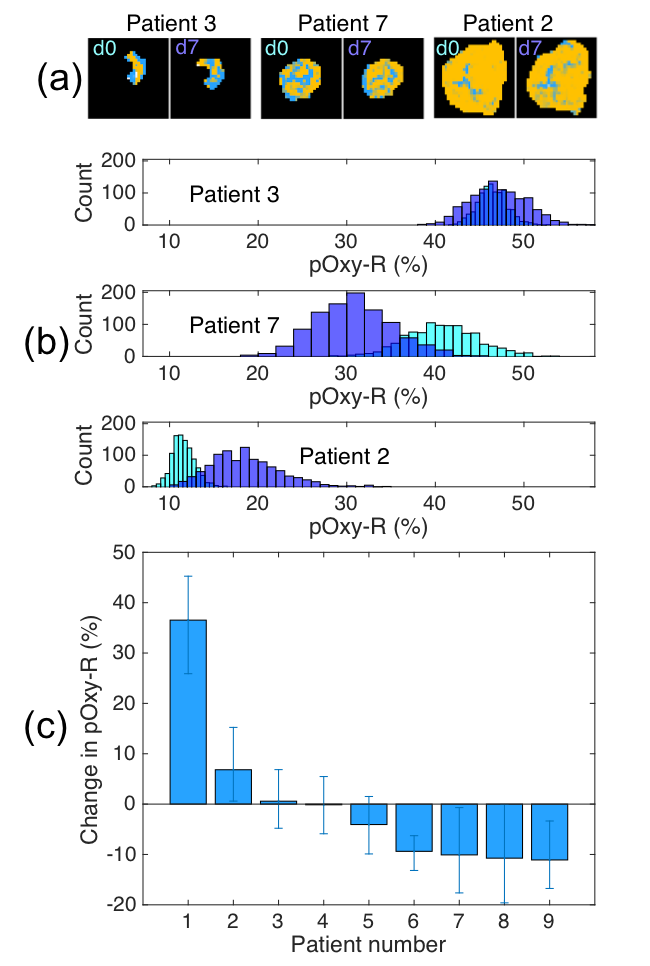
Figure 3: (a) single slice maps of hypoxia status for three example rectal cancer patients at day 0 and day 7, exhibiting (for the three patients left to right) reduction in whole tumour pOxy-R fraction, steady whole tumour pOxy-R fraction, and increase in whole tumour pOxy-R fraction. (b) Histograms of the calculated pOxy-R fraction are shown between (light blue) the first visit and (purple) 7 days post treatment. (c) Change in pOxy-R fraction over the cohort of 9 patients, ordered by greatest increase in pOxy-R to greatest decrease. 6 of the 9 patients showed significant change in pOxy-R.