2584
Quantifying and mapping hypoxia modification in patients with uterine cervical cancer using oxygen-enhanced MRI1Division of Cancer Sciences, University of Manchester, Manchester, United Kingdom, 2Clinical Radiology, The Christie NHS Foundation Trust, Manchester, United Kingdom, 3Christie Medical Physics and Engineering, The Christie NHS Foundation Trust, Manchester, United Kingdom, 4School of Medicine, University of Leeds, Leeds, United Kingdom, 5Proton Beam Therapy Dept, The Christie NHS Foundation Trust, Manchester, United Kingdom, 6Clinical Oncology, The Christie NHS Foundation Trust, Manchester, United Kingdom, 7Mount Vernon Cancer Centre, Northwood, United Kingdom, 8Division of Radiotherapy and Imaging, Institute of Cancer Research, London, United Kingdom
Synopsis
Hypoxia is a ubiquitous negative prognostic factor in solid tumours. Oxygen-enhanced MRI can spatially map regions refractory to an oxygen challenge and, when combined with a perfusion measurement, has the potential to quantify hypoxia in vivo. We developed the technique in healthy volunteers before successfully translating into a longitudinal patient study of patients with cervical carcinoma. We present initial data to support OE-MRI quantifying and mapping hypoxia modification following therapy in this clinical dataset.
Introduction
Oxygen deficiency, termed hypoxia, is a hallmark of solid tumors that encourages tumor angiogenesis, genetic instability and metastasis 1. It is an adverse prognostic factor in cervical cancer 2. MRI is sensitive to changes in the spin-lattice relaxation rate (ΔR1) following delivery of 100% oxygen 3 delivery in tissues 4. Previous pre-clinical evaluation validated a combined OE-MRI and dynamic contrast enhanced (DCE)-MRI biomarker (the volume of tissue that is perfused and also refractory to oxygen gas challenge; termed pOxy-R) as a measurement of tumour hypoxia 5. Subsequent translation in patients with non-small cell lung cancer showed that pOxy-R identified and mapped hypoxia in human tumours, and detected hypoxia modification following chemoradiotherapy 6. We sought to extend this technology to patients with uterine cervix carcinoma and report a) quality assurance (QA) steps that were optimized in healthy volunteers, and b) initial data evaluating pOxy-R as a biomarker of hypoxia in patients with cervical cancer.Methods
Overview: Research ethics approval was obtained (REC: 20/NW/0377). Patients provided written informed consent. Data was obtained for 5 healthy volunteers and 3 patients with stage IIB-IVA squamous cell carcinoma of the cervix. Treatment involved weekly cisplatin chemotherapy prescribed at 40 mg/m2. Combined chemoradiation and brachytherapy were prescribed to reach a final dose of 85 to 90 Gy EQD2.Acquisition: Imaging was acquired in the sagittal plane on a 1.5T Philips Ingenia MR-RT (Amsterdam, Netherlands). All imaging was in the sagittal plane. The reconstructed matrix was 128 x 128 pixels and the resolution was 3 x 3 x 6 mm3. Gases were delivered using a tight-sealed, non-rebreathing Intersurgical EcoLite™ adult facemask (Intersurgical Ltd, UK). Switching between the gases was controlled via the Low Flow Air-Oxygen Blender (Inspiration Healthcare, UK). (1) OE-MRI: 3D Inversion Recovery Turbo Field Echo (IR-TFE) sequence to map T1 (TR = 2.2 ms; TE = 0.66ms; TI = 100, 500, 1100, 2000, 4300 ms; ⍺ = 4°). Switched to dynamic sequence with medical air breathing (21% O2) followed by oxygen breathing (100% O2) at the 26th time point (TI = 1100ms; temporal resolution = 12s). (2) DCE-MRI (patients only): 3D mDIXON fast field echo (FFE) sequence to map T1 (TR = 3.2 ms; TE1 = 1.7 ms; TE2 = 2.2 ms; ⍺ = 2°, 8°, 12°). Switched to dynamic sequence with a bolus of 0.1 mmol/kg gadoterate meglumine (Dotarem®, Guerbet, France) injected at 3 ml/s at the 8th time point (⍺ = 8°; temporal resolution = 3.8s).
Analysis: For OE-MRI voxel-wise ΔR1 was calculated 7, where: ΔR1 = R1 while breathing oxygen (mean of last 10 time points on 100% oxygen) minus R1 on breathing air at the start (mean of last 10 time points on medical air). Repeatability was assessed in healthy volunteers by measuring the within-subject coefficient of variation (wCV). In patients, the same OE-MRI analysis was performed. In addition, the biomarker pOxy-R was calculated, by firstly identifying perfused voxels on DCE-MRI and then classifying voxels as hypoxic (pOxy-R) when DCE-MRI integrated are under the gadolinium enhancement curve at 60 seconds was >0 (one sided paired sample t-test, p<0.05) and ΔR1 was refractory to change. Analyses were performed in MATLAB R2020a (Mathworks).
Results
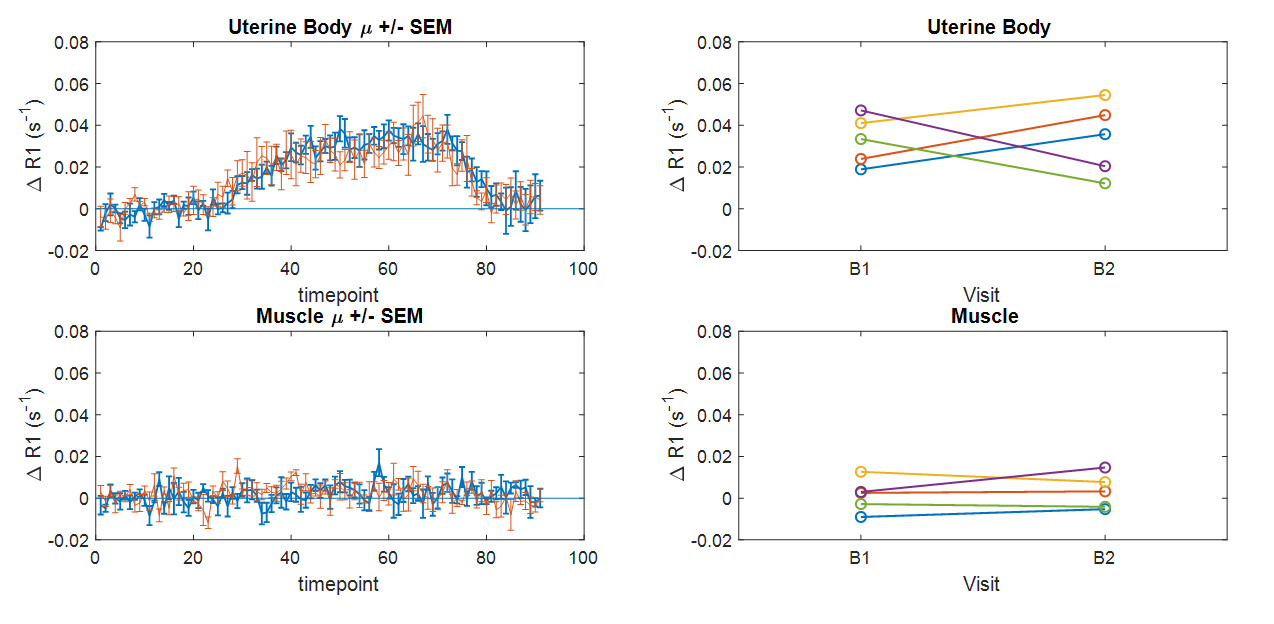
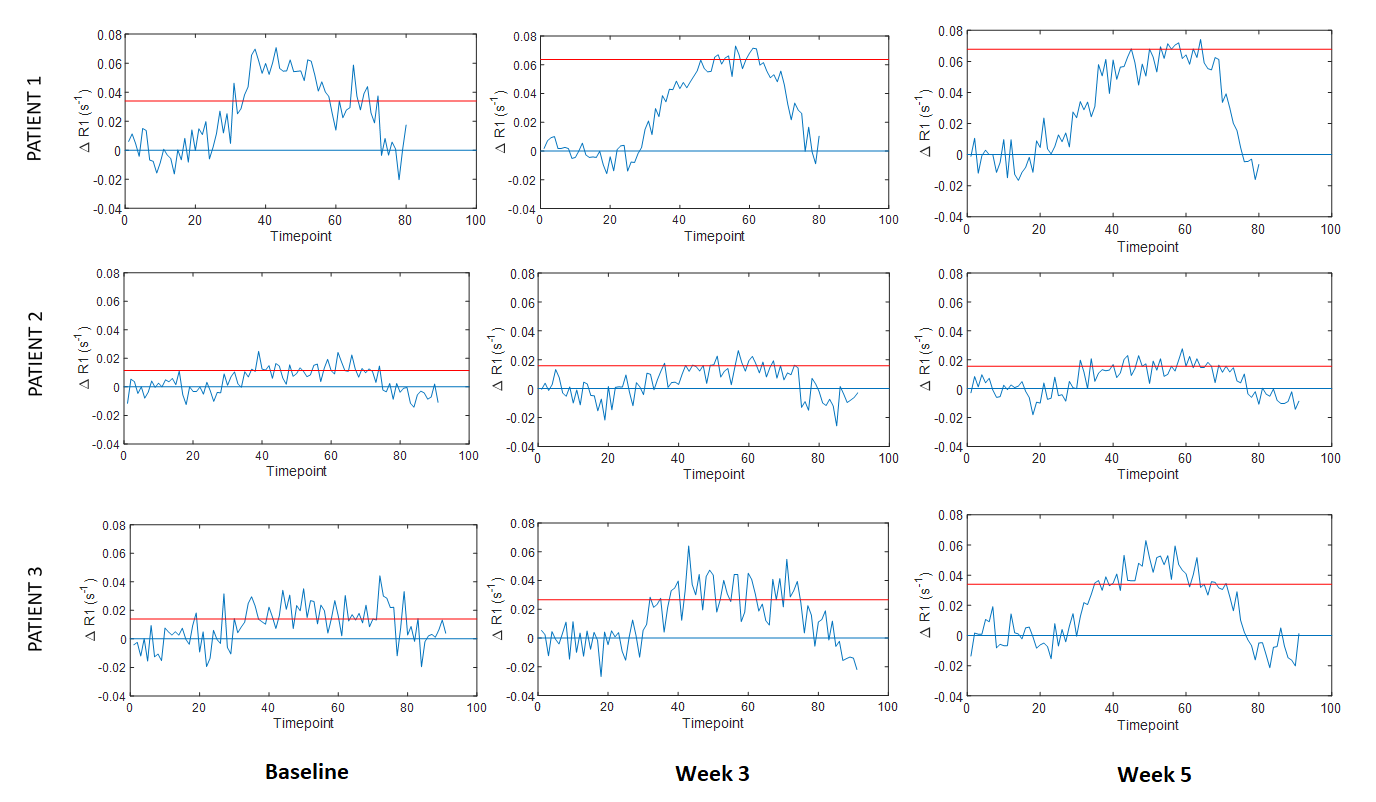
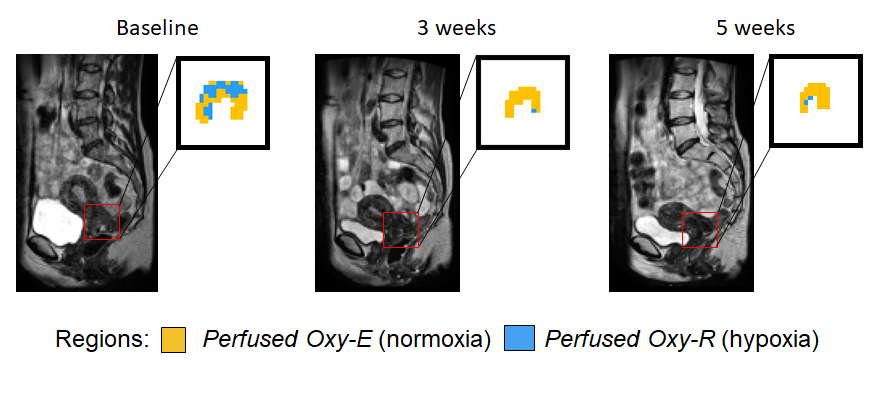
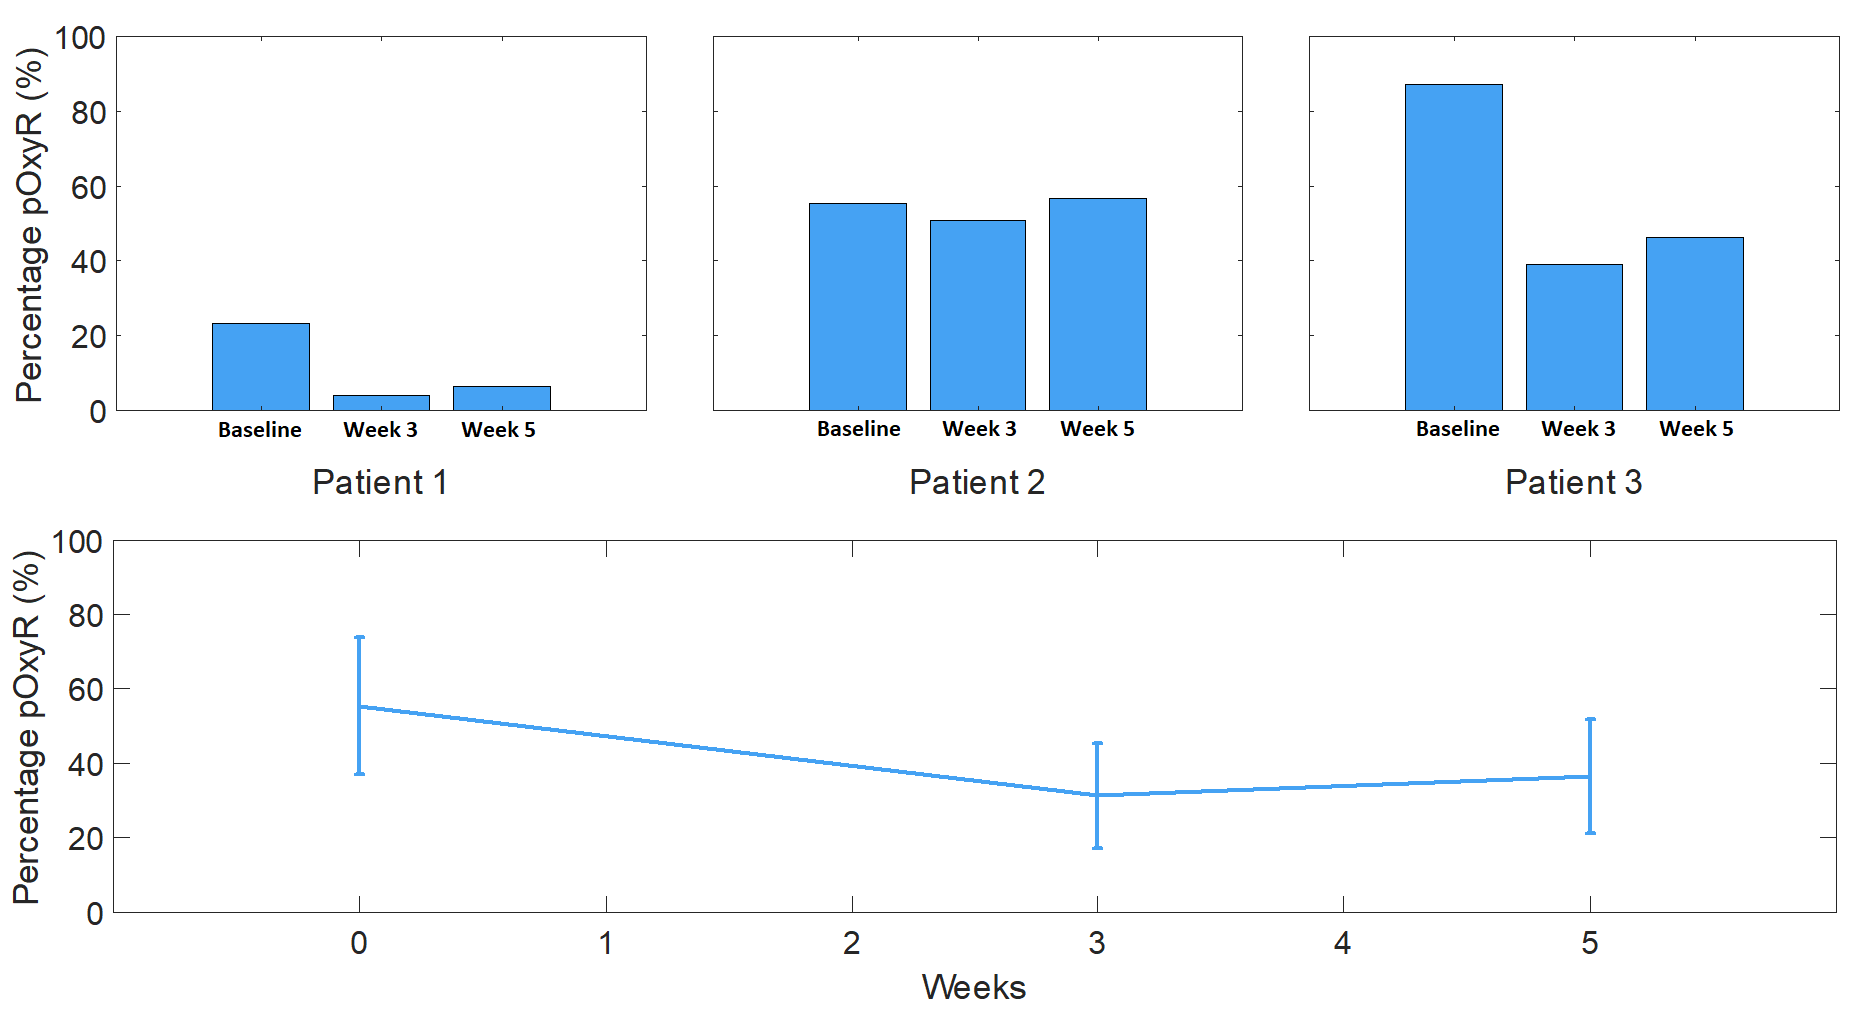
The entire MRI protocol was well tolerated in all healthy volunteers and patients, with no adverse events. ΔR1 plots in healthy volunteer tissues (uterine body and right psoas muscle) are shown in Figure 1, along with double baseline repeatability. Mean ΔR1 Uterine Body = 0.032 ± 0.014 s-1 (p<0.00005). In distinction, mean ΔR1 Muscle = 0.0022 ± 0.0072 s-1 (p=0.35). This determined that the uterine body would be used as an indicator of successful oxygen delivery in a QA step.Patient data showed mean ΔR1 Uterine Body values in patients were 0.021 ± 0.012 s-1 (baseline), 0.035 ± 0.025 s-1 (week 3) and 0.039 ± 0.026 s-1 (week 5) (Figure 2) indicating technical success in all scans. Figure 3 shows illustrative anatomical T2w images paired with combined OE-MRI and DCE-MRI maps in one patient at baseline and weeks 3 and 5, revealing spatial heterogeneity in hypoxia. The tumour pOxy-R reduced in patients 1 and 3 at week 3 and remained reduced at week 5, whereas patient 2 had minimal changes during treatment. Both individual and cohort changes are summarized (Figure 4).
Discussion and conclusion
OE-MRI is a promising technique for hypoxia evaluation, but has low SNR and so QA is useful to exclude technical failures. Healthy volunteer imaging supported using the uterine body as an independent QA reference region and this was then applied to patient data. Muscle represents a poor choice given the low mean ΔR1 and high within-subject coefficient of variation. OE-MRI and DCE-MRI were well tolerated in three patients with cervical carcinoma who had serial mapping of hypoxia while undergoing chemoradiotherapy. Initial results suggest that two patients had therapy-induced reduction in hypoxia within 3 weeks that persisted to week 5. Further recruitment is ongoing, but initial data are encouraging to support OE-MRI as a useful non-invasive technique to quantify and map hypoxia modification in patients with cervical cancer.Acknowledgements
No acknowledgement found.References
1. Muz B, de la Puente P, Azab F, Azab AK. The role of hypoxia in cancer progression, angiogenesis, metastasis, and resistance to therapy. Hypoxia. 2015;3:83. doi:10.2147/hp.s93413
2. Höckel M, Knoop C, Schlenger K, et al. Intratumoral pO2 predicts survival in advanced cancer of the uterine cervix. Radiother Oncol. 1993;26(1):45-50. doi:10.1016/0167-8140(93)90025-4
3. Young IR, Clarke GJ, Baffles DR, Pennock JM, Doyle FH, Bydder GM. Enhancement of relaxation rate with paramagnetic contrast agents in NMR imaging. J Comput Tomogr. 1981;5(6):543-547. doi:10.1016/0149-936X(81)90089-8
4. O’Connor JPB, Jackson A, Buonaccorsi GA, et al. Organ-specific effects of oxygen and carbogen gas inhalation on tissue longitudinal relaxation times. Magn Reson Med. 2007;58(3):490-496. doi:10.1002/MRM.21357
5. O’Connor JPB, Boult JKR, Jamin Y, et al. Oxygen-Enhanced MRI Accurately Identifies, Quantifies, and Maps Tumor Hypoxia in Preclinical Cancer Models. Cancer Res. 2016;76(4):787-795. doi:10.1158/0008-5472.CAN-15-2062
6. Salem A, Little RA, Latif A, et al. Oxygen-enhanced MRI is feasible, repeatable, and detects radiotherapy-induced change in hypoxia in xenograft models and in patients with Non-small cell lung cancer. Clin Cancer Res. 2019;25(13):3818-3829. doi:10.1158/1078-0432.CCR-18-3932
7. Berks M, Parker G, Little R, Cheung S. Madym: A C++ toolkit for quantitative DCE-MRI analysis. J Open Source Softw. 2021;6(66):3523. doi:10.21105/joss.03523
Figures