2577
Real-Time Magnetic Resonance Imaging-Based Computational Modelling To Simulate Urine Flow In Urethra1University of Wisconsin-Madison, Madison, WI, United States
Synopsis
Studying common urinary conditions such as BPH/LUTS require measuring urine flow in the urethra by invasive techniques. We present a method that uses real-time MR images of the bladder and urethra to quantify urine flow dynamics. Images of the urethra define the anatomical geometry, while images of the bladder inform the flow rate inside the urethra. Coupling MRI with CFD allows the urinary flow simulation inside the urethra providing information about urine velocity, pressure, and wall shear stress non-invasively.
Introduction
Benign prostatic hyperplasia (BPH) is the nonmalignant growth of the prostate, commonly observed in aging men. Lower urinary tract symptoms (LUTS) are the most common manifestation of BPH. Over 50% of men aged over 60 years suffer from BPH, and 15%-30% of these men have LUTS1. Standard imaging techniques to assess urethral abnormalities are retrograde urethrography (RUG) and voiding cystourethrography (VCUG)2. However, both RUG and VCUG have become uncommon and the limited exposure of radiologists to these examinations can make it challenging to interpret results3. Image-based computational fluid dynamics (CFD) has been used to study biomechanics in cardiovascular diseases4. Our group has investigated MRI-based CFD, with a focus on cardiac flows as well5. In this study, we expand the tools we developed and apply them to pathological urinary flows. The purpose of this study was to develop and implement a non-invasive MRI-based computational methodology for the simulation of urinary flow inside urethra.Methods
In-vivo MRI study was performed on four male subjects aged 55 ± 19 years with no history of BPH/LUTS following an IRB-approved HIPAA-compliant protocol. Subjects were scanned on a clinical 3T scanner (Premier, GE Healthcare, Waukesha, Wisconsin, USA) using 3D Differential Subsampling with Cartesian Ordering (DISCO) Flex sequence. 15 minutes prior to the start of the imaging session, 1/3 of a single weight-based dose (0.1 mmol/kg) of gadolinium-based contrast was slowly hand injected intravenously outside and the subjects were asked to walk around to ensure enhancement of the urine. Right before the scan, the subject was equipped with a condom catheter to allow the void event while scanning, and volumetric dynamic images of the bladder and urethra were collected throughout the void. The MR images were manually segmented using the semiautomatic segmentation software packages Mimics and 3-matic (Materialise NV, Leuven, Belgium). For the computational simulations, anatomical models of the urethra at the moment of maximum flow were generated from the segmented images for all subjects. To determine the inlet boundary conditions, bladder volumes were segmented and the urinary flow rate in the urethra was calculated as the rate of change in volume of the bladder over time. The outlet boundary condition was atmospheric pressure. The urethra geometry was inputted into the CFD software package CONVERGE 3.1 (Convergent Science, Inc., Madison, Wisconsin, USA)6. Tecplot 360 EX (Tecplot, Inc., Bellevue, Washington, USA) was used to visualize the in-silico results. Subject demographic information, in-vivo scans, urethra geometries, and flow rates from bladder volumes are shown in Figure 1.Results
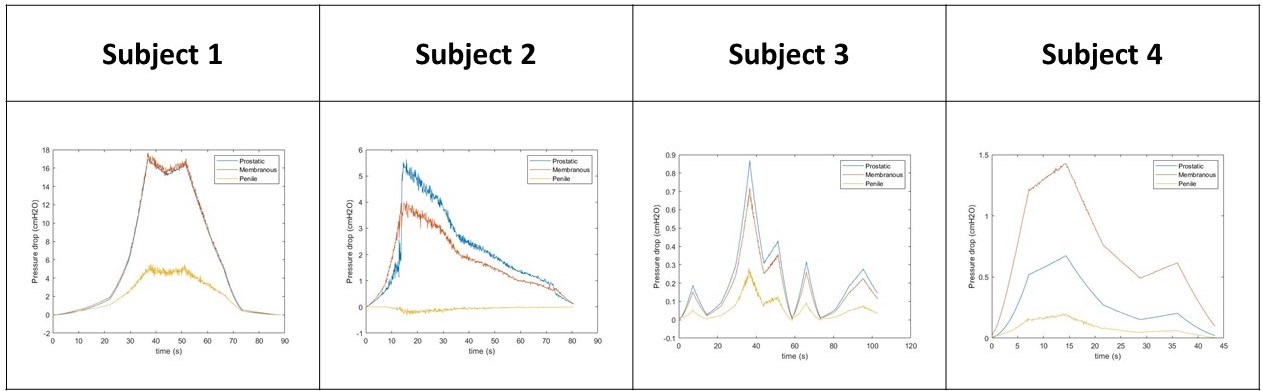
Contrast-enhanced MRI studies provided real-time anatomies of urethra and bladder during voiding. The flow rates and geometries extracted from the in-vivo studies were used to successfully simulate the urine flow inside each subject’s urethra during voiding. The CFD simulation results are visualized in Figure 2. Figure 1 shows that Subjects 1 and 2 voided the largest volumes. This is reflected in our CFD results, with Subjects 1 and 2 having the highest velocities and pressures. In all four subjects, their prostatic/membranous section were narrower than the penile section of the urethra. In-silico data predicts wall shear stress to be higher in the prostatic/membranous region. Pressure drops across the prostatic, membranous, and penile urethra were calculated and are plotted in Figure 3. In Subjects 1 and 4, the pressure drop across membranous urethra is larger than pressure drop across prostatic urethra. It is the opposite in Subjects 2 and 3. For all four subjects, the pressure drop in the penile urethra is the smallest, corresponding to the thickest section of the urethra.Discussion
Real-time MRI data alone do not provide any insight into the flow dynamics of urine. Our method combines MRI of the urinary system with CFD to present a computational methodology that quantitatively and qualitatively characterizes urine flow in the urethra. Furthermore, the MRI-based CFD simulation calculates the pressure required at the bladder neck (start of the urethra) to flow urine at a prescribed rate. Information on the pressure at the bladder neck is useful because it can be imposed as the outlet boundary condition when simulating the bladder voiding process. Unlike the current procedures used to measure urine flow in the urethra, namely RUG and VCUG, our MRI-based approach is non-invasive and provides not only anatomical but functional information not available with any other diagnostic method.Conclusion
This study shows that MRI-based CFD can be expanded to study pathological flows in the urinary system. Our simulations assumed the urethra to be rigid, which is anatomically inaccurate. Future studies should include the motion of the urethra wall in their model extracted from the real time MRI images. Further studies should compare results from our method with results from benchmark clinically used techniques.Acknowledgements
The authors acknowledge support from the NIH (R01 DK126850-01).
GE Healthcare, which provides research support to the University of Wisconsin.
References
1. Thorpe A, Neal D. Benign prostatic hyperplasia. In: Lancet. Vol 361. Elsevier; 2003:1359-1367. doi:10.1016/S0140-6736(03)13073-5
2. Flanagan JC, Batz R, Nordeck SM, Lemack GE, Brewington C. Urethrography for assessment of the adult male urethra. Radiographics. 2018;38(3):831-832. doi:10.1148/rg.2018170131
3. Bach P, Rourke K. Independently interpreted retrograde urethrography does not accurately diagnose and stage anterior urethral stricture: The importance of urologist-performed urethrography. Urology. 2014;83(5):1190-1194. doi:10.1016/j.urology.2013.12.063
4. Marsden AL, Feinstein JA. Computational modeling and engineering in pediatric and congenital heart disease. Current Opinion in Pediatrics. 2015;27(5):587-596. doi:10.1097/MOP.0000000000000269
5. Pewowaruk R, Roldán-Alzate A. 4D Flow MRI Estimation of Boundary Conditions for Patient Specific Cardiovascular Simulation. Annals of Biomedical Engineering. 2019;47(8):1786-1798. doi:10.1007/s10439-019-02285-2
6. Richards, K. J., Senecal, P. K., and Pomraning, E., CONVERGE 3.1, Convergent Science, Madison, WI (2021).
Figures