2573
Mapping autoregulatory mechanisms in the kidney using resting-state MRI1Radiology, Washington University in St. Louis, St. Louis, MO, United States
Synopsis
The kidney maintains stable glomerular perfusion and tubular filtration, despite fluctuation in blood pressure. This autoregulation of flow is performed by two key mechanisms: the myogenic response and the tubuloglomerular feedback. Each mechanism is associated with specific but spatially variable bands of low-frequency fluctuations. Mapping autoregulation throughout the kidney could provide new insights into pathophysiology on kidney disease, or provide noninvasive biomarkers to monitor disease. Here we demonstrate the presence of low-frequency fluctuations in the MRI signal in the rat kidney. This work provides new tools for preclinical investigation, and suggests the potential to evaluate kidney autoregulation in clinical setting.
Introduction
The kidney maintains glomerular filtration and osmotic regulation of the blood, despite constant and potentially damaging natural fluctuations in blood pressure. This is performed through local autoregulation of vascular flow. There are several identified mechanisms of autoregulation of blood flow, including a myogenic response and tubuloglomerular feedback (TGF) [1]. The myogenic response arises from passive modulation of arterial diameter in response to blood pressure fluctuations. The TGF mechanism arises from signaling to modulate glomerular arteriolar diameter in response to changes in sodium concentration in the distal tubule. These two mechanisms are linked to pathologies associated with diabetic and hypertensive nephropathy, due in part to glomerular and tubular injury from uncontrolled fluctuations in pressure [1-4]. Each mechanism is associated with specific but spatially variable low-frequency fluctuations in perfusion and vessel diameters [5, 6]. The myogenic response causes fluctuations from 0.1-0.3 Hz, and the TGF from 0.02-0.05 Hz [2, 6, 7]. Previous studies have been limited to micropuncture of single nephrons or measurements of pressure at the level of the whole organ [5, 8, 9]. However, there is strong evidence of complex tubulo-vascular coupling through networks that reflect the geometry and energetics of each individual kidney [8, 10]. Mapping autoregulation throughout the kidney could provide a new tool to understand the pathophysiology of progressive kidney diseases, and could provide new biomarkers to monitor kidney health or evaluate new therapies [1]. Here we demonstrate the feasibility of MRI to map low-frequency fluctuations in the rat kidney, suggesting the potential to evaluate kidney autoregulation noninvasively in humans.Methods
Sprague Dawley and Zucker rats (n=3 total, male, 8 wk-old) were anesthetized using Ketamine-Xylazine cocktail. The left kidney was externalized and the animal was transferred to MRI cradle. The externalized kidney was fixed on a custom platform. O2 and 1.5-2.25% isoflurane were used be maintain respiration, and core temperature was maintained by a heating pad. Animal ECG and PulseOX were measured using SA instrument (Inc. Stony Brook, NY, USA). MRI was performed at 9.4T Bruker scanner using volume coil as transmit and surface coil as receive. MRI experiment was performed using single shot spin-echo echo planar imaging (SE-EPI) acquisition with TR/TE=250 ms/13 ms, in-plane resolution= 0.3 mm2; slice thickness=0.5 mm; number of slices=3; number of averages=1, number of dummy scans=62, number of repetitions=2500, total acquisition time of ~ 10.5 minutes. In a pilot study, signals from respiration (~1.5Hz) and the heartbeat (~5Hz) aliased into the low frequency spectrum (0.01-0.3 Hz) using TR = 500 ms or 1 sec. This did not occur with TR= 250 ms, so we used TR=250ms for these experiments.Results and Discussion
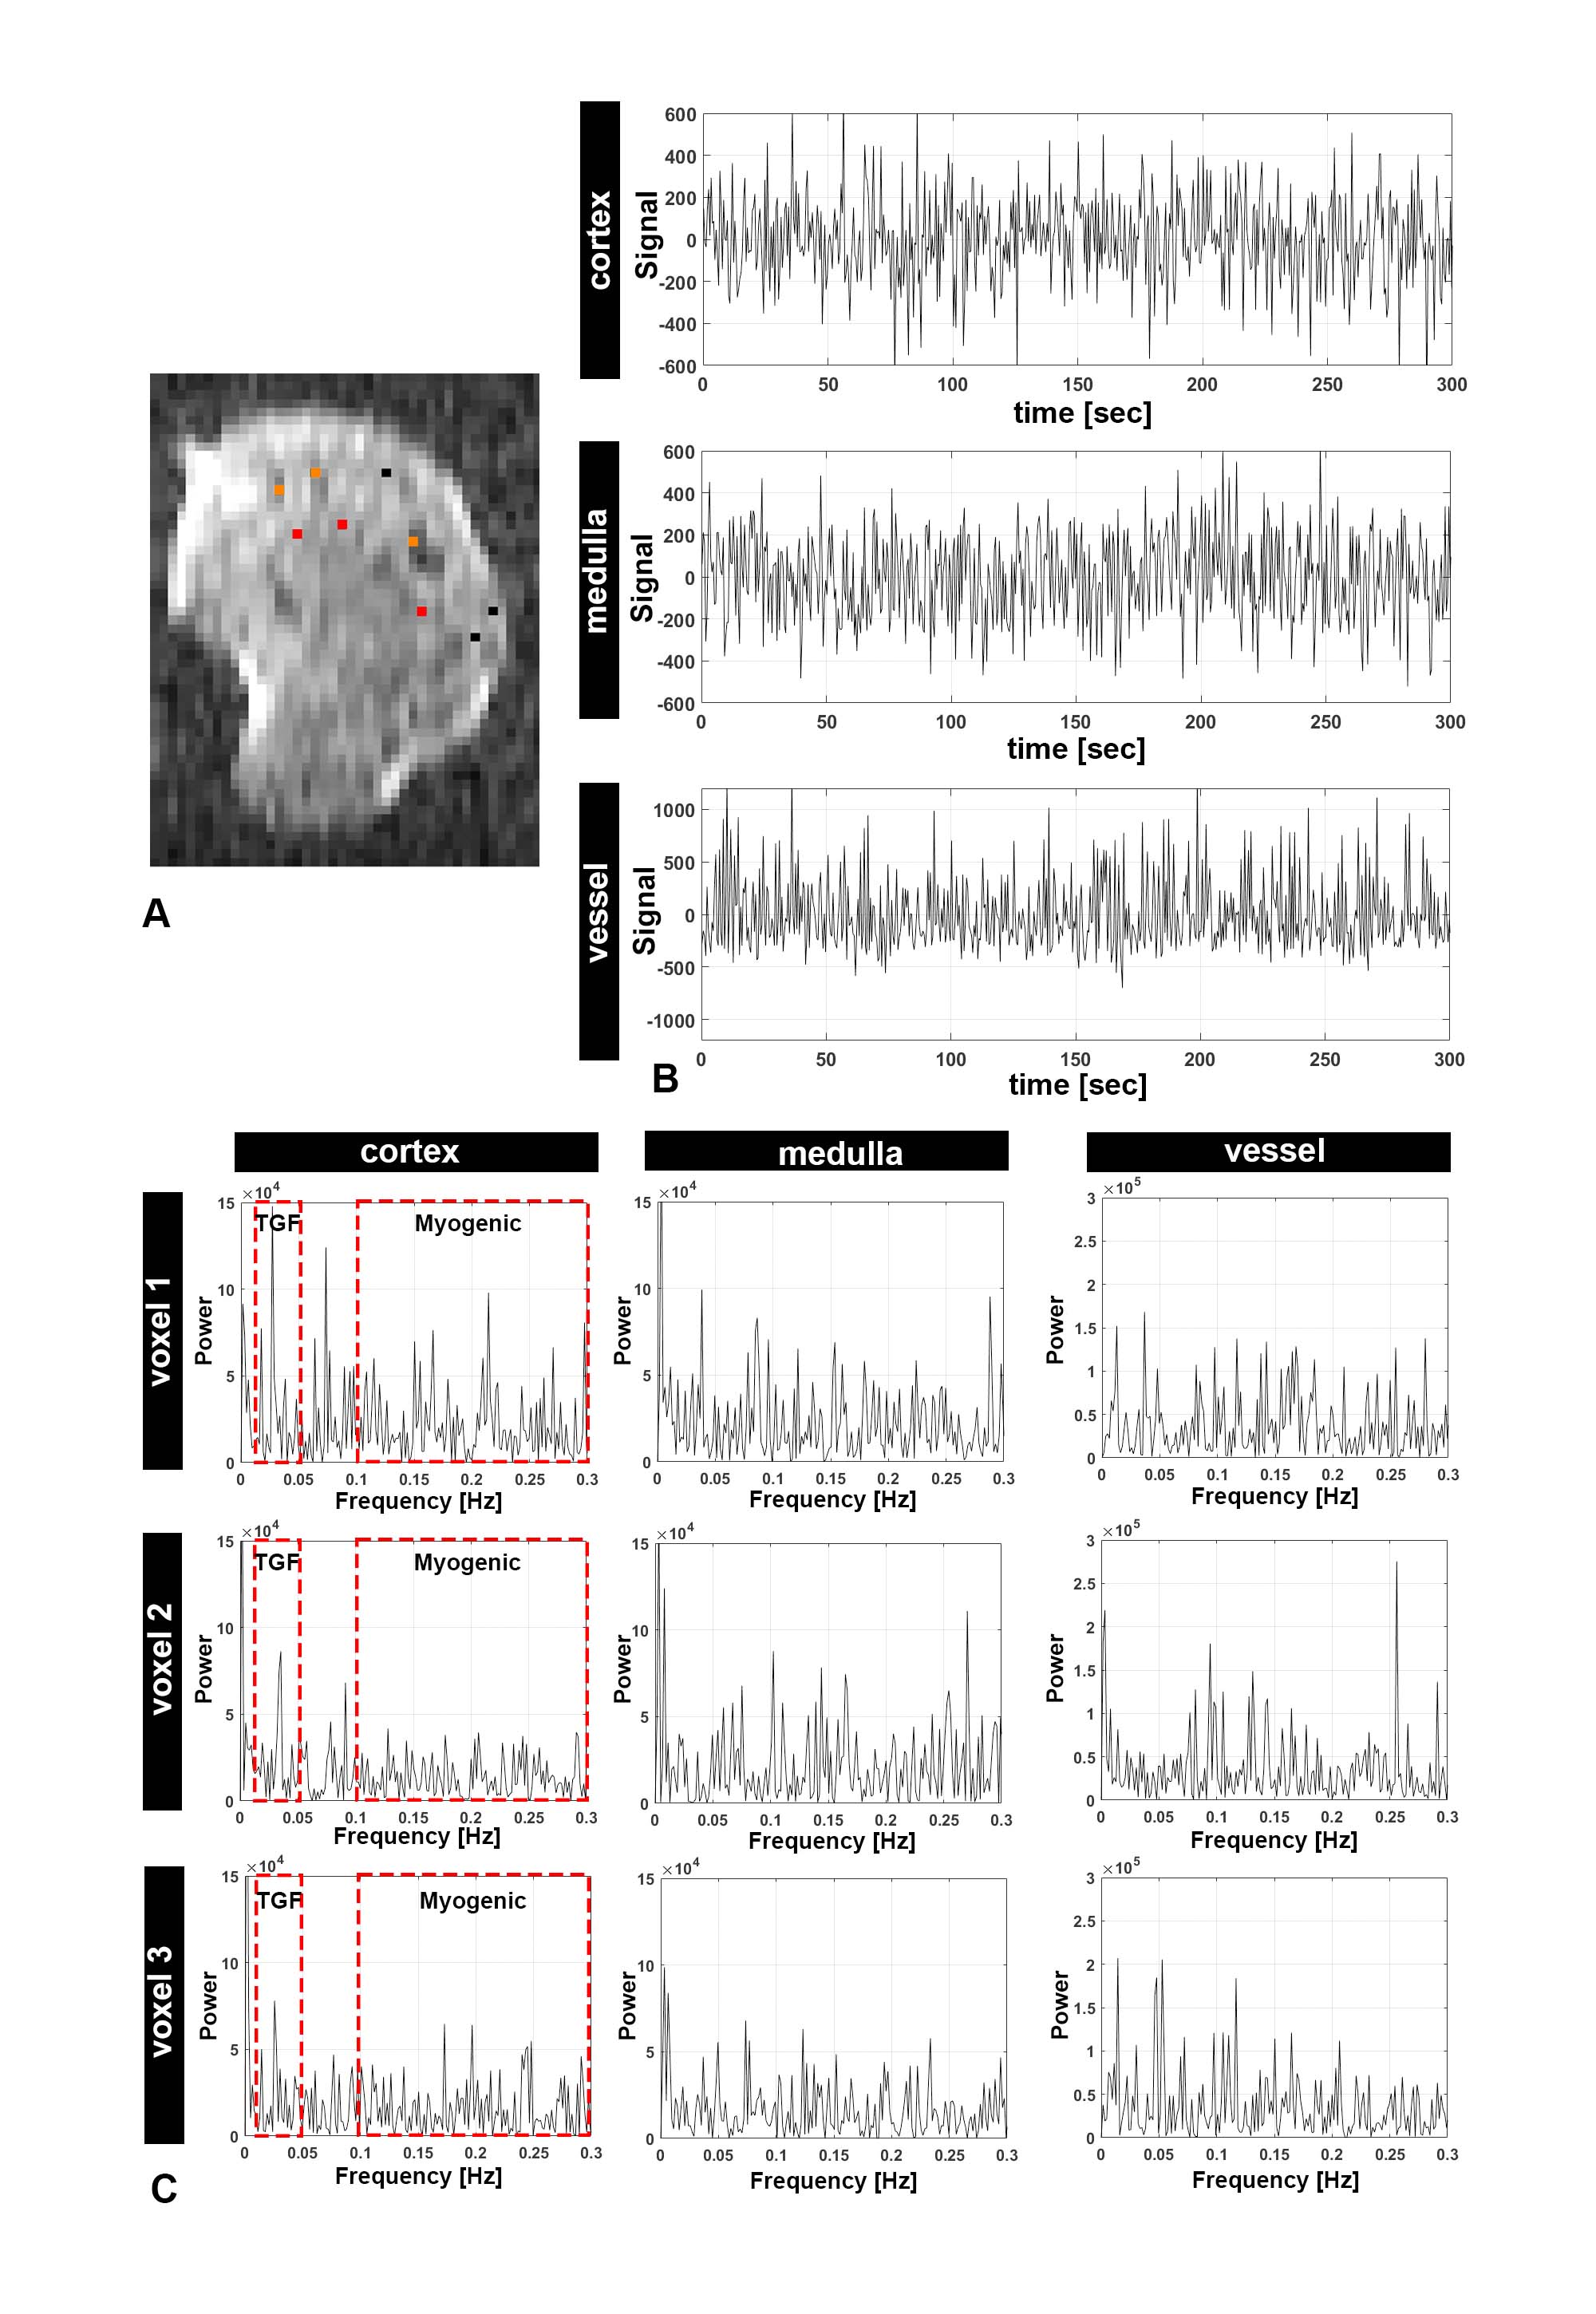
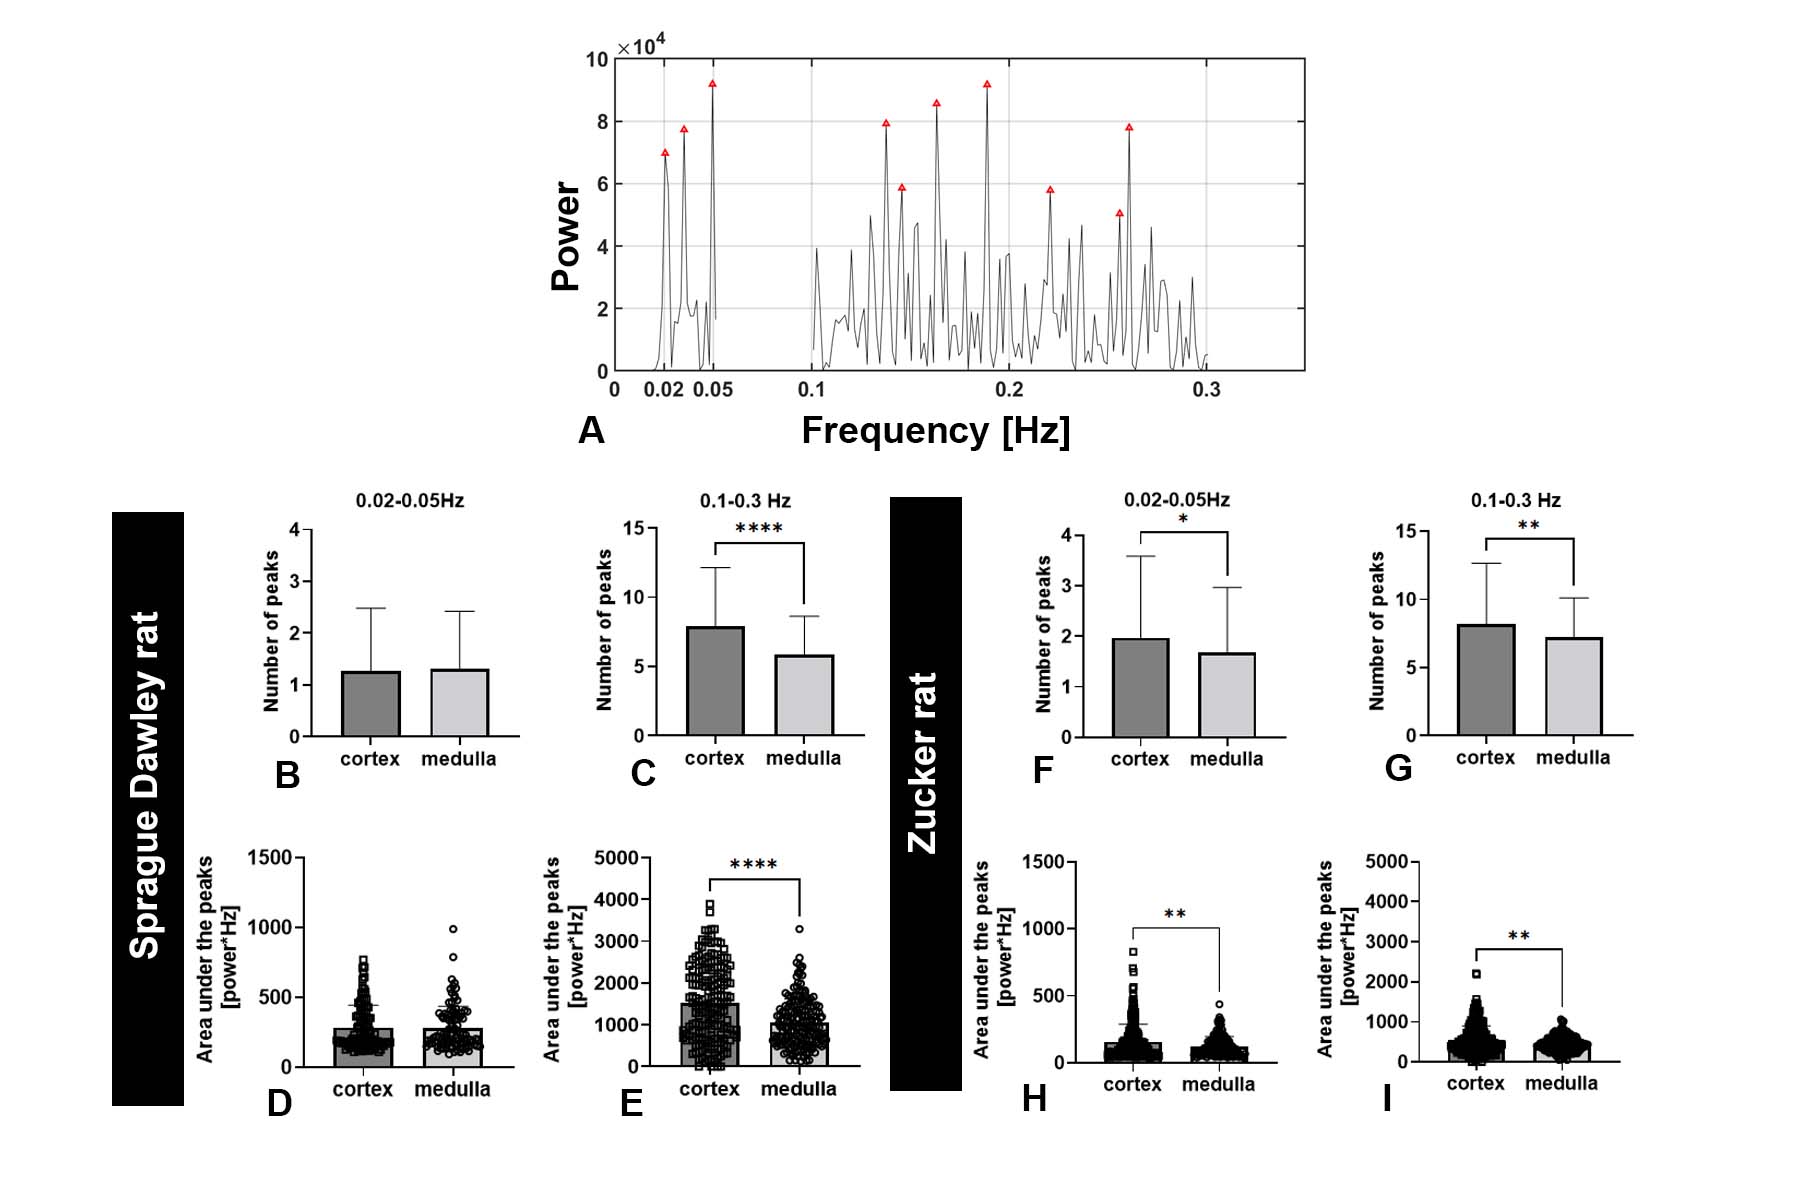
Figure 1A shows a representative 2D slice from an MR image. Figure 1B shows the time course of MR signal obtained for one representative voxel in three major compartments: cortex, medulla, and major vessels). The time course was filtered to remove linear trends. We observed oscillatory behavior that varied between compartments and between voxels within these compartments. Fluctuations also differed in phase. In cortex, this phase shift might reflect a difference in timing of modulations in arteriolar diameter between different regions of the kidney that have coupled vascular units.Figure 1C shows the frequency power spectra of several representative voxels in each major compartment. In cortex, several peaks were observed within 0.1-0.3 Hz and 0.02-0.05 Hz (red frames, Figure 1C). From different voxels, we observed a varying number of peaks from the likely myogenic or TGF frequency ranges. We hypothesize that this variation reflects differences in autoregulation of blood flow: Some voxels in the cortex may have more nephrons with synchronized TGF, while other voxels may have fewer nephrons with desynchronized microvascular networks. We compared the power spectra from both rat strains (Fig 2). Figure 2A shows peaks between frequency ranges of 0.1-0.3 Hz (likely myogenic) and 0.02-0.05 Hz (likely TGF) and in representative voxels from kidney cortex. The number and total power of peaks in the TGF range was consistently lower in both strains than in the myogenic range, consistent with localization of the TGF response to the glomerulus. We observed similar low-frequency fluctuations in both strains.
In conclusion, we detected and mapped low-frequency fluctuations in the MRI signal that are likely associated with known mechanisms of autoregulation of kidney perfusion. These fluctuations probably result from changes in vascular diameter to regulate local flow, suggesting there are other pulse sequences that can enhance their detection. Future work will focus on how these spectra are affected by pharmacologic or surgical interventions or pathologies, and exploring the potential of this technique to provide new markers of kidney health in vivo in humans.
Conclusion
Autoregulation plays a critical role in maintaining kidney filtration and blood osmotic pressure. This work is a first step toward development of a robust, non-invasive method to map kidney autoregulation in vivo by MRI.Acknowledgements
No acknowledgement found.References
1. Burke, M., et al., Molecular mechanisms of renal blood flow autoregulation. Curr Vasc Pharmacol, 2014. 12(6): p. 845-58.
2. Sosnovtseva, O.V., et al., Synchronization among mechanisms of renal autoregulation is reduced in hypertensive rats. Am J Physiol Renal Physiol, 2007. 293(5): p. F1545-55.
3. Bidani, A.K., et al., Protective Importance of the Myogenic Response in the Renal Circulation. Hypertension, 2009. 54(2): p. 393-398.
4.Sata, Y., et al., Role of the Sympathetic Nervous System and Its Modulation in Renal Hypertension. Frontiers in Medicine, 2018. 5(82).
5. Romero, C.A. and O.A. Carretero, Tubule-vascular feedback in renal autoregulation. American Journal of Physiology-Renal Physiology, 2019. 316(6): p. F1218-F1226.
6. Siu, K.L., et al., Detection of low-frequency oscillations in renal blood flow. Am J Physiol Renal Physiol, 2009. 297(1): p. F155-62.
7. Loutzenhiser, R., A. Bidani, and L. Chilton, Renal myogenic response: kinetic attributes and physiological role. Circ Res, 2002. 90(12): p. 1316-24.
8. Marsh, D.J., et al., The nephron-arterial network and its interactions. American Journal of Physiology-Renal Physiology, 2019. 316(5): p. F769-F784.
9. Kallskog, O. and D.J. Marsh, TGF-initiated vascular interactions between adjacent nephrons in the rat kidney. American Journal of Physiology-Renal Physiology, 1990. 259(1): p. F60-F64.
10. Zehra, T., W.A. Cupples, and B. Braam, Tubuloglomerular Feedback Synchronization in Nephrovascular Networks. J Am Soc Nephrol, 2021. 32(6): p. 1293-1304.
Figures