2570
Dynamic Functional Connectivity in Pediatric Spinal Cord Injury Patients Versus Healthy Controls
Joseph Schaefer1, Jingya Miao2, Caio Matias2, Feroze Mohamed2, Laura Krisa2, James Harrop2, and Mahdi Alizadeh2
1Neurological Surgery, Thomas Jefferson University, Philadelphia, PA, United States, 2Thomas Jefferson University, Philadelphia, PA, United States
1Neurological Surgery, Thomas Jefferson University, Philadelphia, PA, United States, 2Thomas Jefferson University, Philadelphia, PA, United States
Synopsis
The purpose of this study is to investigate the distributed network properties of subjects with pediatric spinal cord injury using static and dynamic functional connectivity analysis. 36 subjects of which 18 had history of SCI between the ages of 0-18 years underwent 3-Tesla resting state functional MRI (rs-fMRI). Static and dynamic functional connectivity was calculated. Results showed patients with a history of pediatric spinal cord injury did not show widespread changes in static functional connectivity but did have significant changes in dynamic functional connectivity, including spending more time in a relatively hypoconnected brain state and less brain state transitions.
Background: Complete or partial spinal cord injury has been shown to lead to changes in brain network organization. Static and dynamic functional connectivity allow for detecting changes in network organization and dynamic brain states.
Objective: To investigate the distributed network properties of subjects with pediatric spinal cord injury using static and dynamic functional connectivity analysis.
Methods: 36 subjects of which 18 had history of SCI between the ages of 0-18 years underwent 3-Tesla resting state functional MRI (rs-fMRI). The rs-fMRI data was first preprocessed using a standard protocol, which includes the removal of the first 10 volumes to remove the T1 saturation effects, realignment, unwarping, slice-timing correction, and outlier identification based on framewise displacement and global BOLD signal standard deviations. Independent component analysis was applied to extract spatially independent components (ICs) from the rs-fMRI. Static FC between ICs was calculated across the whole time series. Dynamic FC between ICs was calculated using a sliding window method (window size = 30*TRs, step = 1*TR, TR = 2 seconds) to estimate windowed FC matrices between ICs. Then, k-means clustering was applied to assess the frequency and patterns of FC matrices based on the L1/Manhattan distance approach. The clustering algorithm was repeated 500 times to increase the accuracy of grouping windowed matrices into brain states, which indicate different FC patterns that occurred throughout the scanning period.
Results: The mean (SD) age at time of SCI was 10.2 (7.6). The mean (SD) age at enrollment for the control and SCI group was 16.7 (4.1) and 16.5 (4.2) (p = 0.898), respectively. Static FC analysis did not demonstrate widespread differences between SCI and control patients (Figure 1). In dynamic FC analysis, k-clustering yielded 4 brain states (Figure 2). For all subjects, 85% of the scan duration was spent in State-3 or State-4. State-3 was relatively hypoconnected compared to State-4. The SCI injury group spent a statistically significant longer amount of time in State-3 (p = 0.0219), and the control group spent a statistically significant longer amount of time in State-4 (p = 0.0376). The SCI group transitioned between brain states less frequently than the control group: 3.1 versus 1.3, p = 0.0043).
Conclusions: Subjects with history of pediatric spinal cord injury did not show widespread changes in static functional connectivity but did have significant changes in dynamic functional connectivity. Subjects with SCI spent more time in a relatively hypoconnected brain state and had less brain state transitions.
Acknowledgements
No acknowledgement found.References
No reference found.Figures

Figure 1: Resting State FNC Connectivity Matrix. A) Resting State FNC Connectivity Matrix for all subjects; B) Control-SCI Connectivity Matrix filtered for statistical significance (p = 0.005). AUD = Auditory Network, DMN = Default Mode Network, ECN = Executive Control Network, SAL = Salience Network, SMN = Sensory Motor Network, VLN = Visual Lateral Network, VMN = Visual Medial Network , VON = Visual Occipital Network.

Figure 2: Resting State dFNC k-clustering states. A) State-1, B) State-2, C) State-3, and D) State-4. AUD = Auditory Network, DMN = Default Mode Network, ECN = Executive Control Network, VLN = Visual Lateral Network, VMN = Visual Medial Network, SMN = Sensory Motor Network, SAL = Salience Network, VON = Visual Occipital Network.
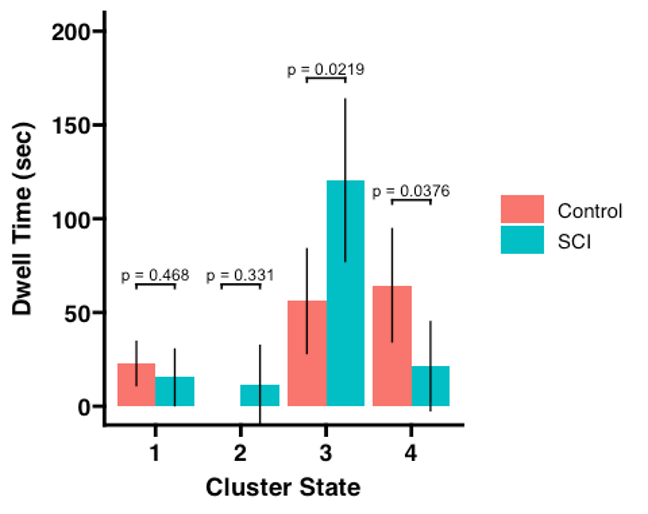
Figure 3: Cluster State Dwell Time. Total scan time = 210 scans.
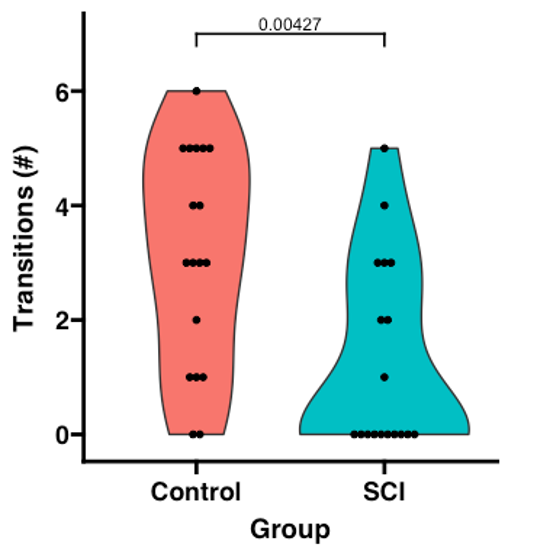
Figure 4: State Transition Frequency

Table 1: Patient Characteristics
DOI: https://doi.org/10.58530/2022/2570