2569
Dynamic Changes in Functional Network Connectivity Involving Amyotrophic Lateral Sclerosis and Its Correlation With Disease Severity.1Fujian Medical University Union Hospital, Fuzhou, China
Synopsis
We explored dynamic functional network connectivity (dFNC) in ALS and its correlation with disease severity. FNC states were determined by k-mean clustering, and state-specific FNC and dynamic indices (fraction time/mean dwell time/transition number) were calculated. ALS patients showed increased FNC between DMN-SMN in state 1 and between CCN-SMN in state 4. Patients remained in state 2 (showing the weakest FNC) for a significantly longer time and remained in state 1 (showing a relatively strong FNC) for a shorter time. A significant correlation was observed between ALSFRS-R and mean dwell time in state 2 and transition number.
Introduction
Resting-state functional MRI (fMRI) is a tool that may provide information toward an improved understanding of the pathophysiological mechanisms of ALS1,2. A number of resting-state fMRI investigations have revealed that ALS patients exhibit impairment of functional connectivity (FC) involving intrinsic brain networks1,3,4.Functional network connectivity (FNC) is an informative variation of FC that assesses functional coupling/coherence among large-scale distributed networks and has been extensively utilized in a variety of neuropsychiatric disorders5,6. It has been demonstrated that FNC analyses have shed light on the dysfunctional mechanisms under these neuropsychiatric disorders. DFNC evaluates the time-varying and interactive properties among brain networks that can provide a comprehensive understanding of the brain’s dynamic integration, coordination, and response to internal state changes and external stimulation7. The utilization of dFNC analysis not only enhances our understanding of brain development/ aging and cognitive-behavioral mechanisms but also enables us to explore the pathogenesis of neurodegenerative disorders (eg, Parkinson’s disease and dementia) from a new perspective.Methods
Thirty-two ALS patients and 45 healthy controls wew included in the study.Multiband resting-state functional images using gradient echo echo-planar imaging and T1- weighted images were acquired at 3.0 T. Disease severity was evaluated with the revised ALS Functional Rating Scale (ALSFRS-R) and patients were stratified according to diagnostic category. Independent component analysis was conducted to identify the components of seven intrinsic brain networks (ie, visual/sensorimotor (SMN)/auditory/cognitive-control (CCN)/default-mode (DMN)/subcortical/cerebellar networks). A sliding-window correlation approach was used to compute dFNC. To assess reoccurring FC patterns, the k-means clustering method was employed on the time-varying covariance matrices for clustering into four FNC states, where the optimal number of states was determined based on the elbow criteria cluster index. And state-specific FNC and dynamic indices (fraction time/mean dwell time/transition number) were calculated. Two-sample t test used for comparisons on dynamic measures and Spearman’s correlation analysis.Results
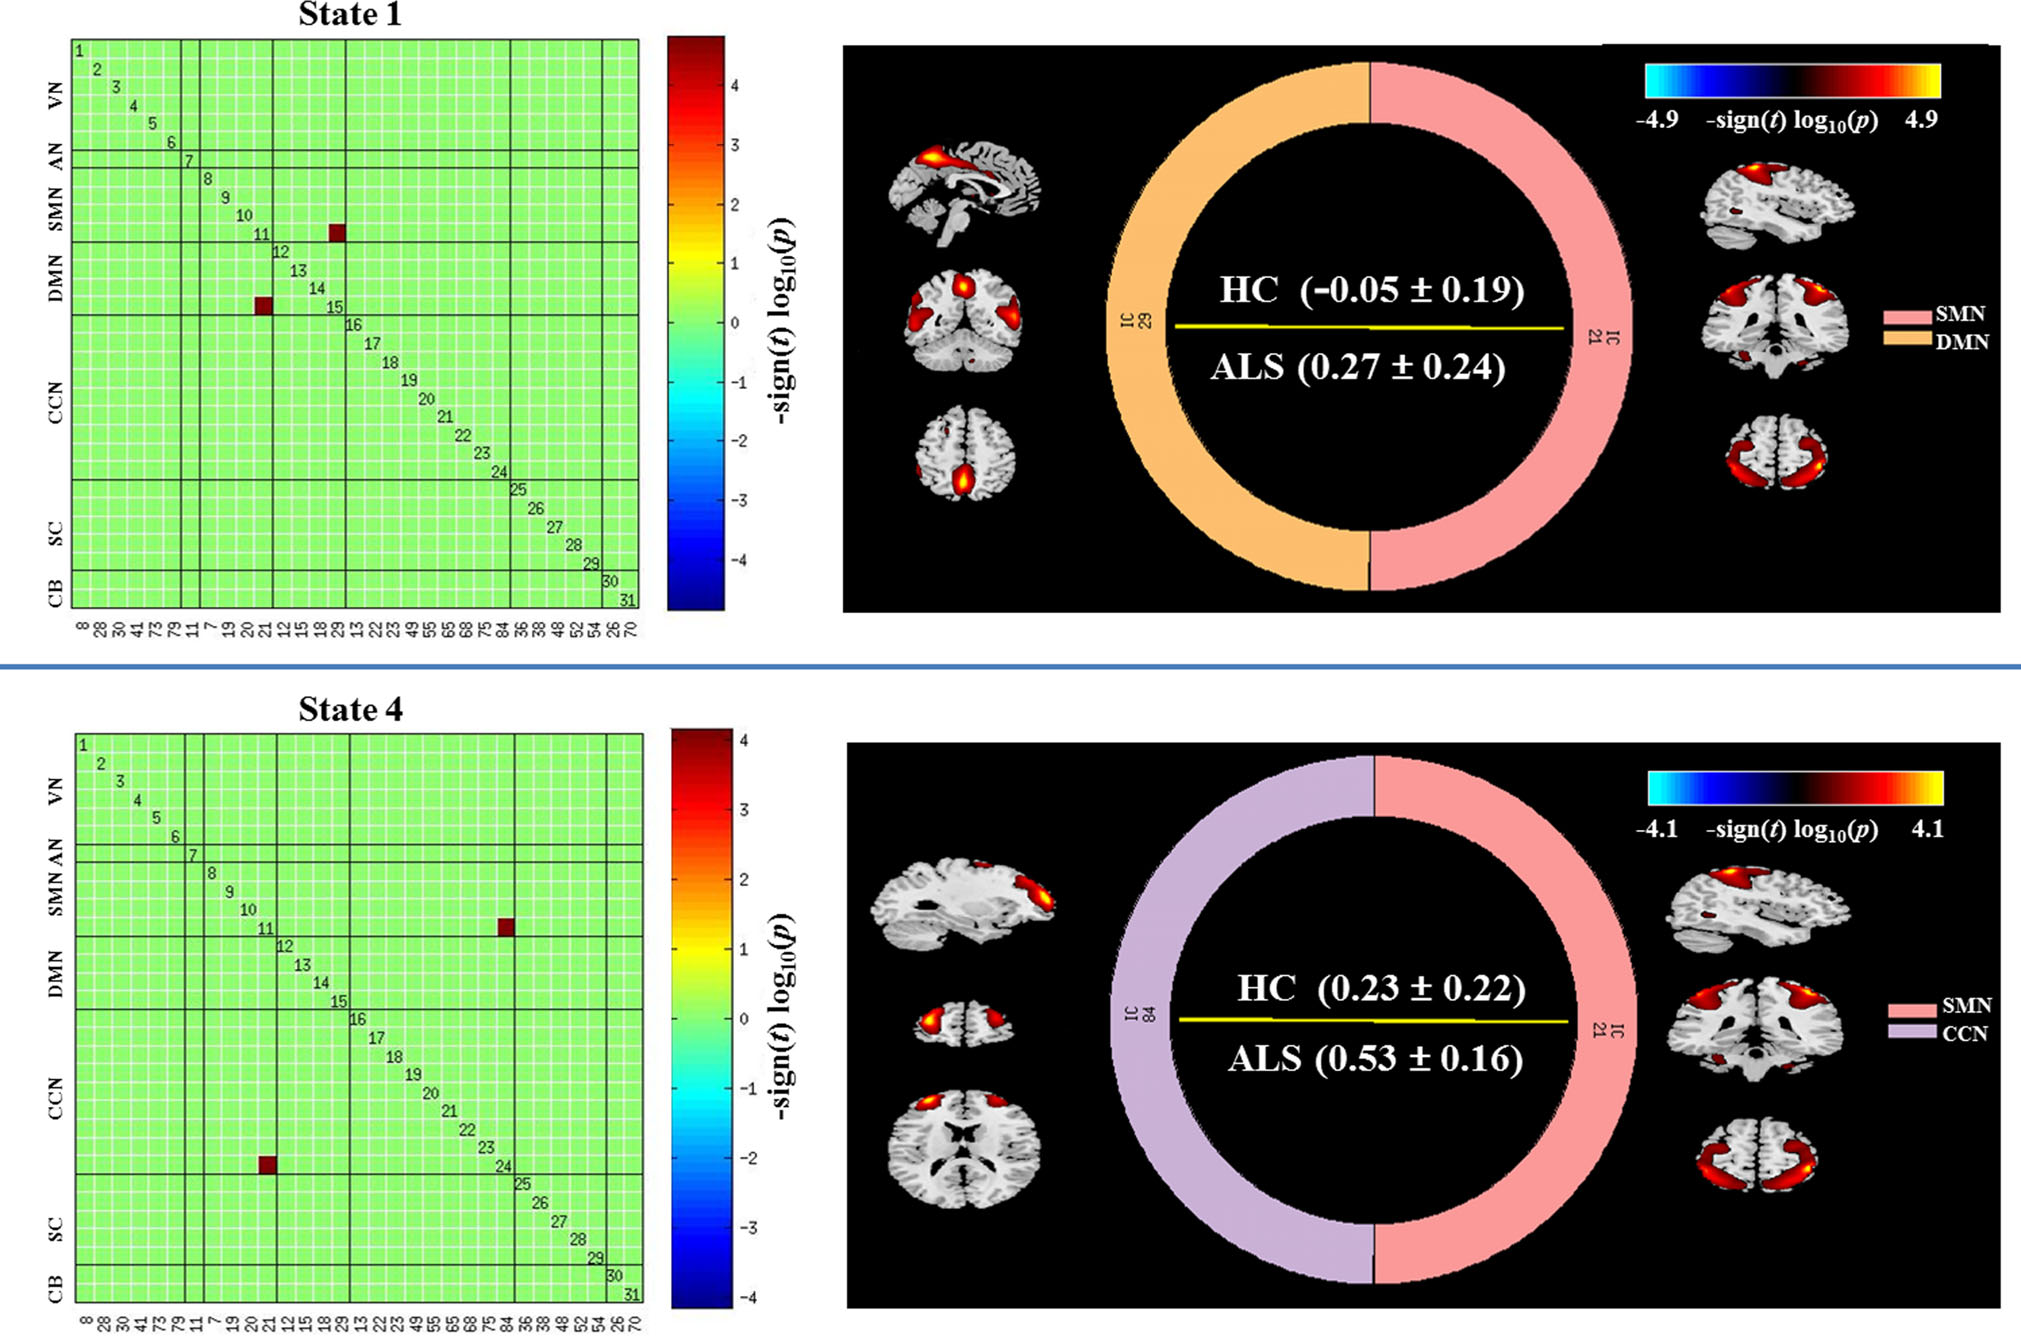
In ALS patients, relative to all other states, the results showed state 4 exhibited the most complex dFNC pattern, in which there were stronger positive connectivities within and between perceptual networks, DMN, cognitive networks, SC, and CB. Similar to state 4, state 3 also primarily captured the positive connectivity across all subsystems of the seven networks, although with the relatively lower connectivity strength. State 1 maintained a strong positive connectivity among perceptual networks and captured several negative dFNC(Figure 2).Furthermore, the relatively strong positive connectivities within and among CCN, SC, and CB were also observed in state 1. The connectivity pattern in state 2 was similar to that in state 1. However, state 2 exhibited the weakest connectivity across the distinct networks relative to the other states and in this state, the connections within each network were not very adequate.(Figure 2).In state 1, the dFNC between the DMN (represented by IC-29) and SMN (represented by IC-21) was negative (−0.05 ± 0.19) in healthy controls, but positive connectivity (0.27 ± 0.24) was observed in ALS patients. In state 4, the connectivity strength between CCN (represented by IC-84) and SMN (represented by IC-21) significantly increased in the ALS group (0.23 ± 0.22 vs. 0.53 ± 0.16)(Figure3). Compared with the healthy controls, the fraction time in state 1 was significantly lower (0.27 ± 0.25 vs. 0.13 ± 0.20, P < 0.05) and mean dwell time in state 2 was significantly higher (49.8 ± 40.1 vs. 93.6 ± 126.3, P < 0.05) in ALS patients. Additionally, the transition number was significantly lower in patients compared to healthy controls (10.2 ± 4.4 vs. 7.8 ± 3.8, P < 0.05).Correlation analyses revealed a significant negative correlation (r = −0.414, P < 0.05) between mean dwell time in state 2 and ALSFRS-R score in the ALS group. Additionally, a significantly positive correlation (r = 0.452, P < 0.05) between ALSFRS-R score and transition number was observed in the ALS group.Conclusion
Our findings suggest aberrant dFNC properties in ALS, which represent an additional characteristic of ALS and may underlie the neuropathological mechanisms of motor dysfunction. The dFNC analysis could provide the alternative biomarker for assessing disease severity of ALS.Acknowledgements
The National Natural Science Foundation of China (81501450 and 82071900), Fujian Provincial Science Fund for Distinguished Young Scholars (2018J06023), Fujian Province Joint Funds for the Innovation of Science and Technology (2019Y9067), and Fujian Provincial Health Commission Project for Scientific Research Talents (2018-ZQN-28) supported this study.References
1. Agosta F, Canu E, Valsasina P, Riva N, Prelle A, Comi G, et al. Divergent brain network connectivity in amyotrophic lateral sclerosis. Neurobiol Aging. 2013;34(2):419–27.
2. Schmidt R, Verstraete E, de Reus MA, Veldink JH, van den Berg LH, van den Heuvel MP. Correlation between structural and functional connectivity impairment in amyotrophic lateral sclerosis. Hum Brain Mapp. 2014;35(9):4386–95.
3. Schulthess I, Gorges M, Muller HP, et al. Functional connectivity changes resemble patterns of pTDP-43 pathology in amyotrophic lateral sclerosis. Sci Rep. 2016;6:38391.
4. Mohammadi B, Kollewe K, Samii A, Krampfl K, Dengler R, Munte TF. Changes of resting state brain networks in amyotrophic lateral sclerosis. Exp Neurol. 2009;217(1):147–53.
5.Meda SA, Gill A, Stevens MC, Lorenzoni RP, Glahn DC, Calhoun VD, et al. Differences in resting-state functional magnetic resonance imaging functional network connectivity between schizophrenia and psychotic bipolar probands and their unaffected first-degree relatives. Biol Psychiatry. 2012;71(10):881–9.
6. Filippi M, Agosta F, Scola E, Canu E, Magnani G, Marcone A, et al. Functional network connectivity in the behavioral variant of frontotemporal dementia. Cortex. 2013;49(9):2389–401.
7. Hutchison RM, Womelsdorf T, Allen EA, Bandettini PA, Calhoun VD, Corbetta M, et al. Dynamic functional connectivity: Promise, issues, and interpretations. Neuroimage. 2013;80:360–78.
Figures