2568
Dynamic alterations of functional connectivity density in amyotrophic lateral sclerosis: a resting-state fMRI study1Fujian Medical University Union Hospital, Fuzhou, China, 2Radiology, Fujian Medical University Union Hospital, Fuzhou, China
Synopsis
In this study, we made the first investigation on abnormal pattern of dynamic functional connection density (dFCD) in ALS. We gathered resting state functional magnetic resonance imaging (fMRI) data from 50 patients with ALS and 55 healthy controls (HC). dFCD was analyzed by sliding window correlation method; and the standard deviation of dFCD across the sliding window was calculated voxel-wisely to quantify dFCD variability. Our study has found abnormal dFCD variability in ALS. The indices of dFCD variability showed moderate discrimination power between two groups, suggesting its potential serving as the diagnostic biomarker for ALS.
Introduction
Amyotrophic lateral sclerosis (ALS) is the most common form of motor neuron disease in adult characterized by the progressive degeneration of upper and lower motor neurons, resulting in muscular weakness1. Resting-state functional magnetic resonance imaging (fMRI), a noninvasive neuroimaging method dependent on blood oxygen level dependent (BOLD) signals, has received more and more attention in neuroscience studies2. In addition, resting-state fMRI can be used to study and quantify the variation in functional connectivity (FC) between the distinct brain regions. The FC method has been applied to ALS patients and provides more information about brain functional architecture in resting-state, which has shown its promise as a potential biomarker for ALS3. Furthermore, the utilization of dynamic FC analysis enables us to reveal the mechanisms in several psychiatric and neurological disorders4. Of note, several studies have also investigated the FC changes in ALS, from a dynamic point of view5. As an extension of the FC method, the analysis of functional connectivity density (FCD) calculates the sum of FC strength between a given node and all other nodes in the whole-brain network6. Recently, dynamic FCD (dFCD) approach, which combinates FCD analysis and sliding window correlation method, has also been used to explore dynamic neural communication between distinct brain regions and has been draw more and more attention7. The knowledge of the temporal dynamics of the brain functional organization in ALS is limited. The current study aimed to investigate the change of brain dynamic property in ALS, by making the first assessment of dFCD variability, to further provide the new insight into the mechanisms underlying ALS disease.Methods
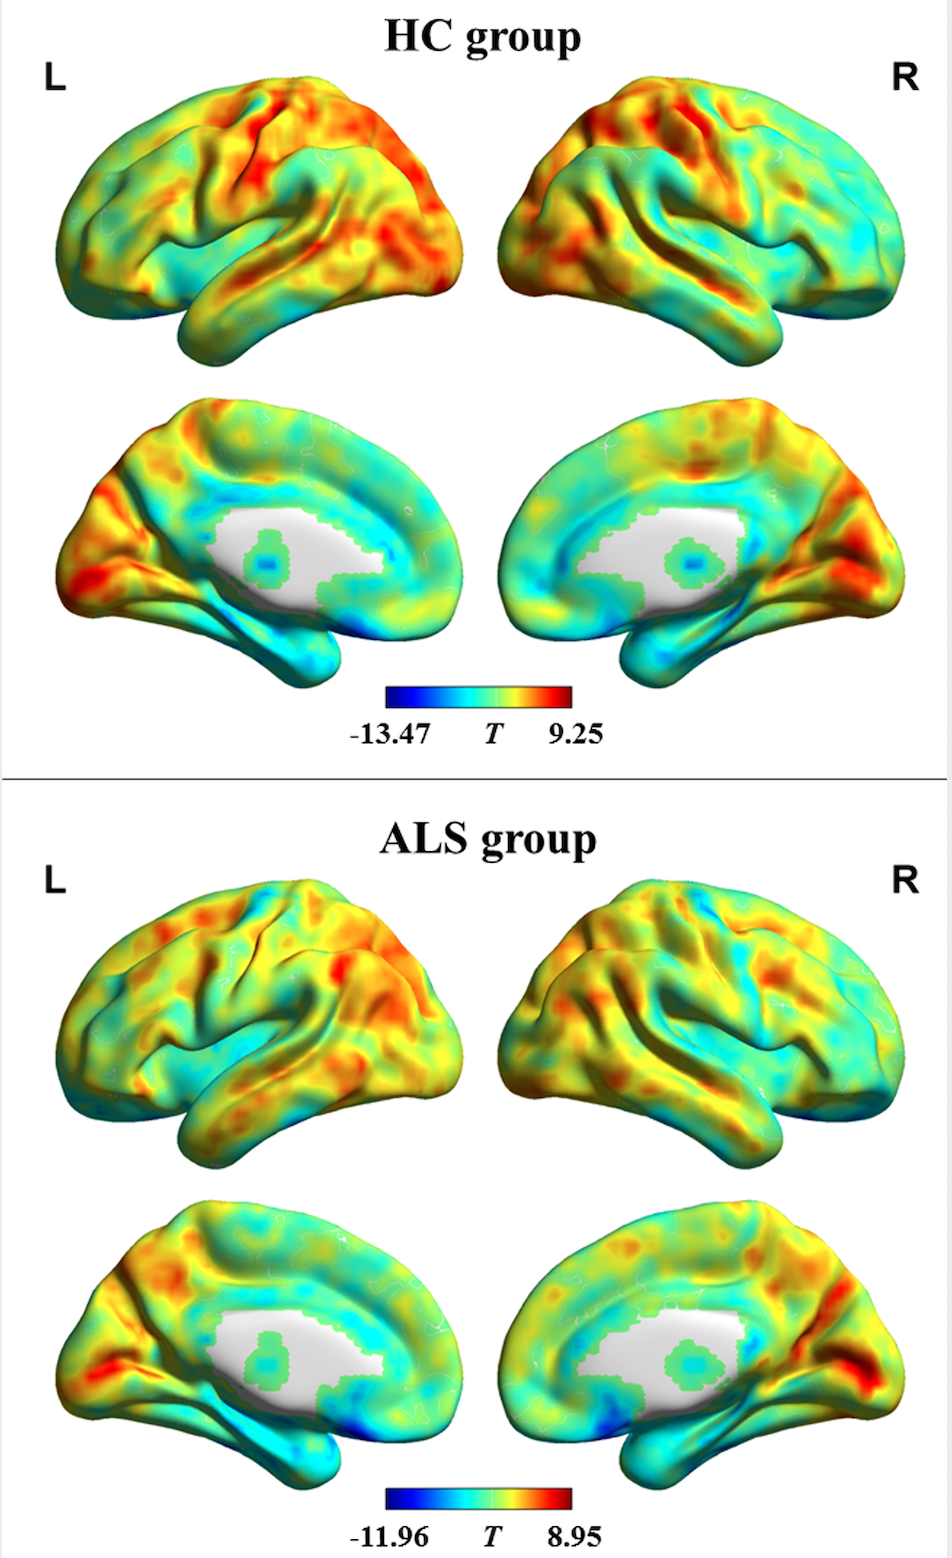
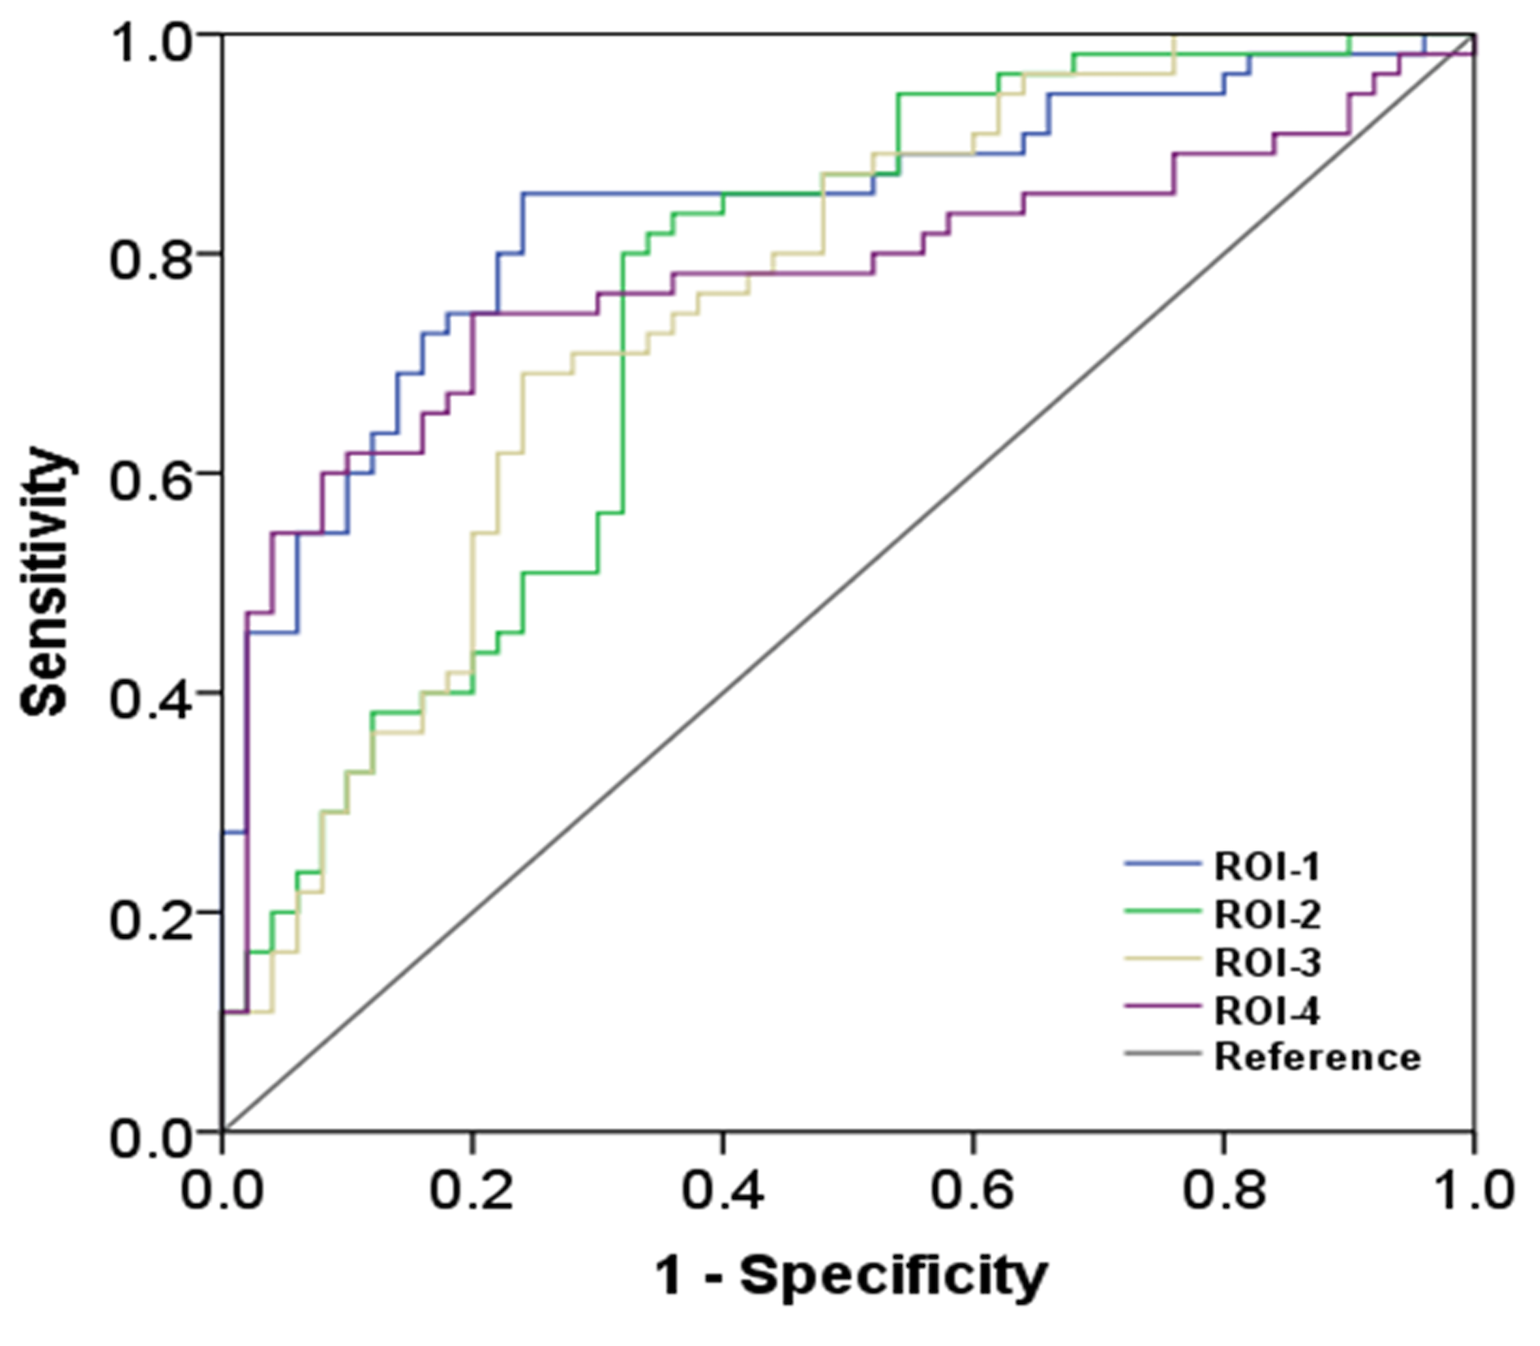
We gathered resting state functional magnetic resonance imaging (fMRI) data from 50 patients with ALS and 55 healthy controls (HC). The sum of functional connectivity strength between a given voxel and all other voxels in the whole brain was calculated as the FCD value of each voxel. dynamic FCD was analyzed by sliding window correlation method; and the standard deviation (SD) of dFCD across the sliding window was calculated voxel-wisely to quantify dynamic FCD variability. The difference of dynamic FCD variability between the two groups was assessed by two-sample t test in voxel-wise manner. The receiver operating characteristic (ROC) curve was used to assess the between-group recognition performance of dynamic FCD variability index.Results
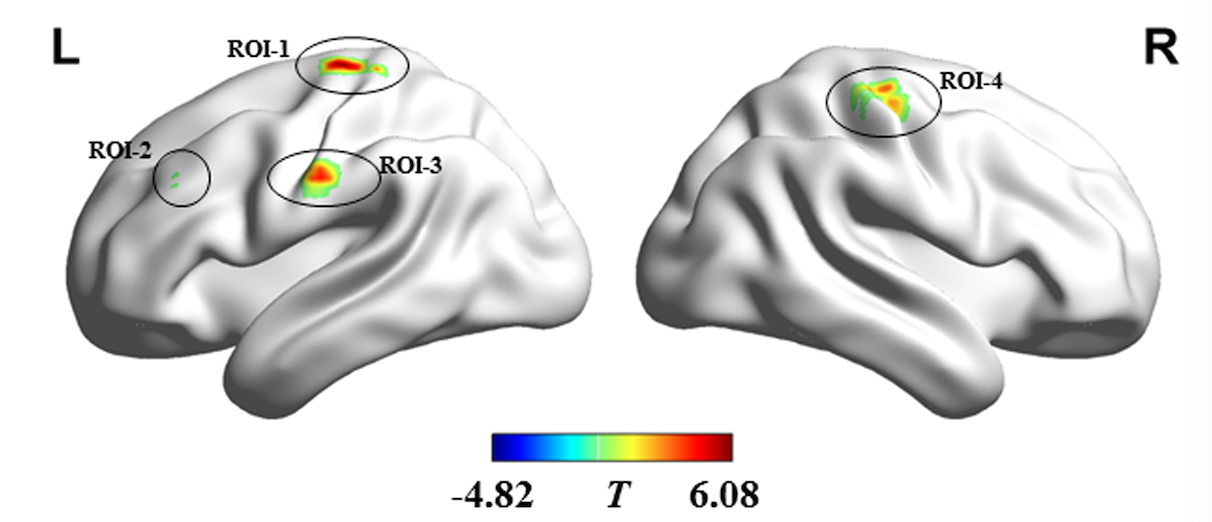
Compared with HC group, the dynamic FCD variability was significantly decreased in bilateral precentral and postcentral gyrus while notably increased in left middle frontal gyrus in ALS patients. The indices of dynamic FCD variability exhibited moderate potential (areas under ROC curve = 0.753~0.837, all P < 0.001) in distinguishing two groups.Conclusion
ALS patients have abnormal dynamic patterns of brain functional architecture. The dynamic FCD evaluation could help us further understand the pathological mechanisms underlying ALS and may contribute to the assisted diagnosis of disease.Acknowledgements
The National Natural Science Foundation of China (No. 82071900) and Fujian Province Joint Funds for the Innovation of Science and Technology (No. 2019Y9067) supported this study.References
1. Hardiman O, Al-Chalabi A, Chio A et al. Amyotrophic lateral sclerosis. Nat Rev Dis Primers. 2017; 3:17071
2. Smith K. Brain imaging: fMRI 2.0. Nature. 2012; 484:24-26
3. Li W, Zhang J, Zhou C, et al. Abnormal Functional Connectivity Density in Amyotrophic Lateral Sclerosis. Front Aging Neurosci. 2018; 10:215
4. Sendi MSE, Zendehrouh E, Ellis CA et al. Aberrant Dynamic Functional Connectivity of Default Mode Network in Schizophrenia and Links to Symptom Severity. Front Neural Circuits. 2021; 15:649417
5. Chen HJ, Zou ZY, Zhang XH, et al. Dynamic Changes in Functional Network Connectivity Involving Amyotrophic Lateral Sclerosis and Its Correlation With Disease Severity. J Magn Reson Imaging. 2021; 54:239-248
6. Lv H, Wang Z, Tong E et al. Resting-State Functional MRI: Everything That Nonexperts Have Always Wanted to Know. AJNR Am J Neuroradiology. 2018; 39:1390-1399
7. Chen Y, Cui Q, Xie A et al. Abnormal dynamic functional connectivity density in patients with generalized anxiety disorder. J Affect Disord. 2020; 261:49-57
Figures