2566
Altered dynamic functional network connectivity in post-stroke dementia with subcortical lesion1Key Laboratory for Biomedical Engineering of Ministry of Education, Department of Biomedical Engineering, College of Biomedical Engineering & Instrument Science, Zhejiang University, Hangzhou, China, 2Department of Engineering, University of Oxford, Oxford, United Kingdom, 3Department of Neurology, Neuroscience Center,, Sir Run Run Shaw Hospital, Zhejiang University, Hangzhou, China, 4Department of Radiology, Neuroscience Center,, Sir Run Run Shaw Hospital, Zhejiang University, Hangzhou, China
Synopsis
This study aimed to explore the changes of functional network connectivity (FNC) in post-stroke dementia (PSD) using a dynamic FNC (dFNC) method. We collected resting-state fMRI data from16 PSD patients, 20 post-stroke non-dementia (PSND) patients and 19 normal controls, and identified 13 functional networks. We found PSD-specific decreases in the dFNC between default mode network and executive control network as well as visual network, which were not observed in static FNC analysis. Moreover, PSD showed a significant decrease in time-variance of global efficiency in whole brain compared with PSND. These changes were associated with the clinical assessments of patients.
Introduction
Recent studies have demonstrated that dynamic functional network connectivity (dFNC) analysis uses an increased temporal resolution to better illustrate transient characteristics of a network than traditional static FNC (sFNC) [1, 2]. Although previous studies have reported changes of dFNC in dementia under stroke diseases [3-5], it remains unclear how the temporal configurations of functional connectivities of resting-state brain networks would be altered in post-stroke dementia (PSD) so far. This study combined the dFNC analysis with graph theory and associated image information with cognitive assessment to illustrate clinical significance of FNC on PSD.Methods
The present study is a cross-sectional experimental design. The present study collected rs-fMRI and T1-weighted images from 16 PSD patients, 20 post-stroke non-dementia (PSND) patients, and 19 age-matched normal control (NC). We selected the stroke patients with a subcortical lesion only to avoid effect of lesion on cortical functional networks. We first used an independent component analysis to extract functional networks and calculated their sFNC. Then, we applied a sliding window approach with a time window size of 44s (22 repetition times) and convolved with a Gaussian of 6s (3 repetition times), to perform the dFNC analysis within each window from the l1 norm of the regularized inverse covariance matrix [6]. The connectivity matrixes were divided into different states by k-means clustering using l1 distance function, in which the number of states was determined by elbow criterion. Finally, we computed dFNC-related metrics, including fractional time, dwell time and number of transitions, and further estimated the time-variance of global and local efficiencies in the whole brain with each network as a node and FNC as an edge using graph theory method.In statistical analysis, we compared the differences among three groups in sFNC and dFNC by applying one-way ANCOVA (significance level p < 0.05) with the covariates (age, sex, education, intracranial volume, head motion, and lesion information), and then post hoc two-sample t-test (significance level p < 0.05, FDR-BH-corrected). We also evaluated the relationship between the MRI measurements and the clinical assessments with statistical significance threshold of p < 0.05.
Results
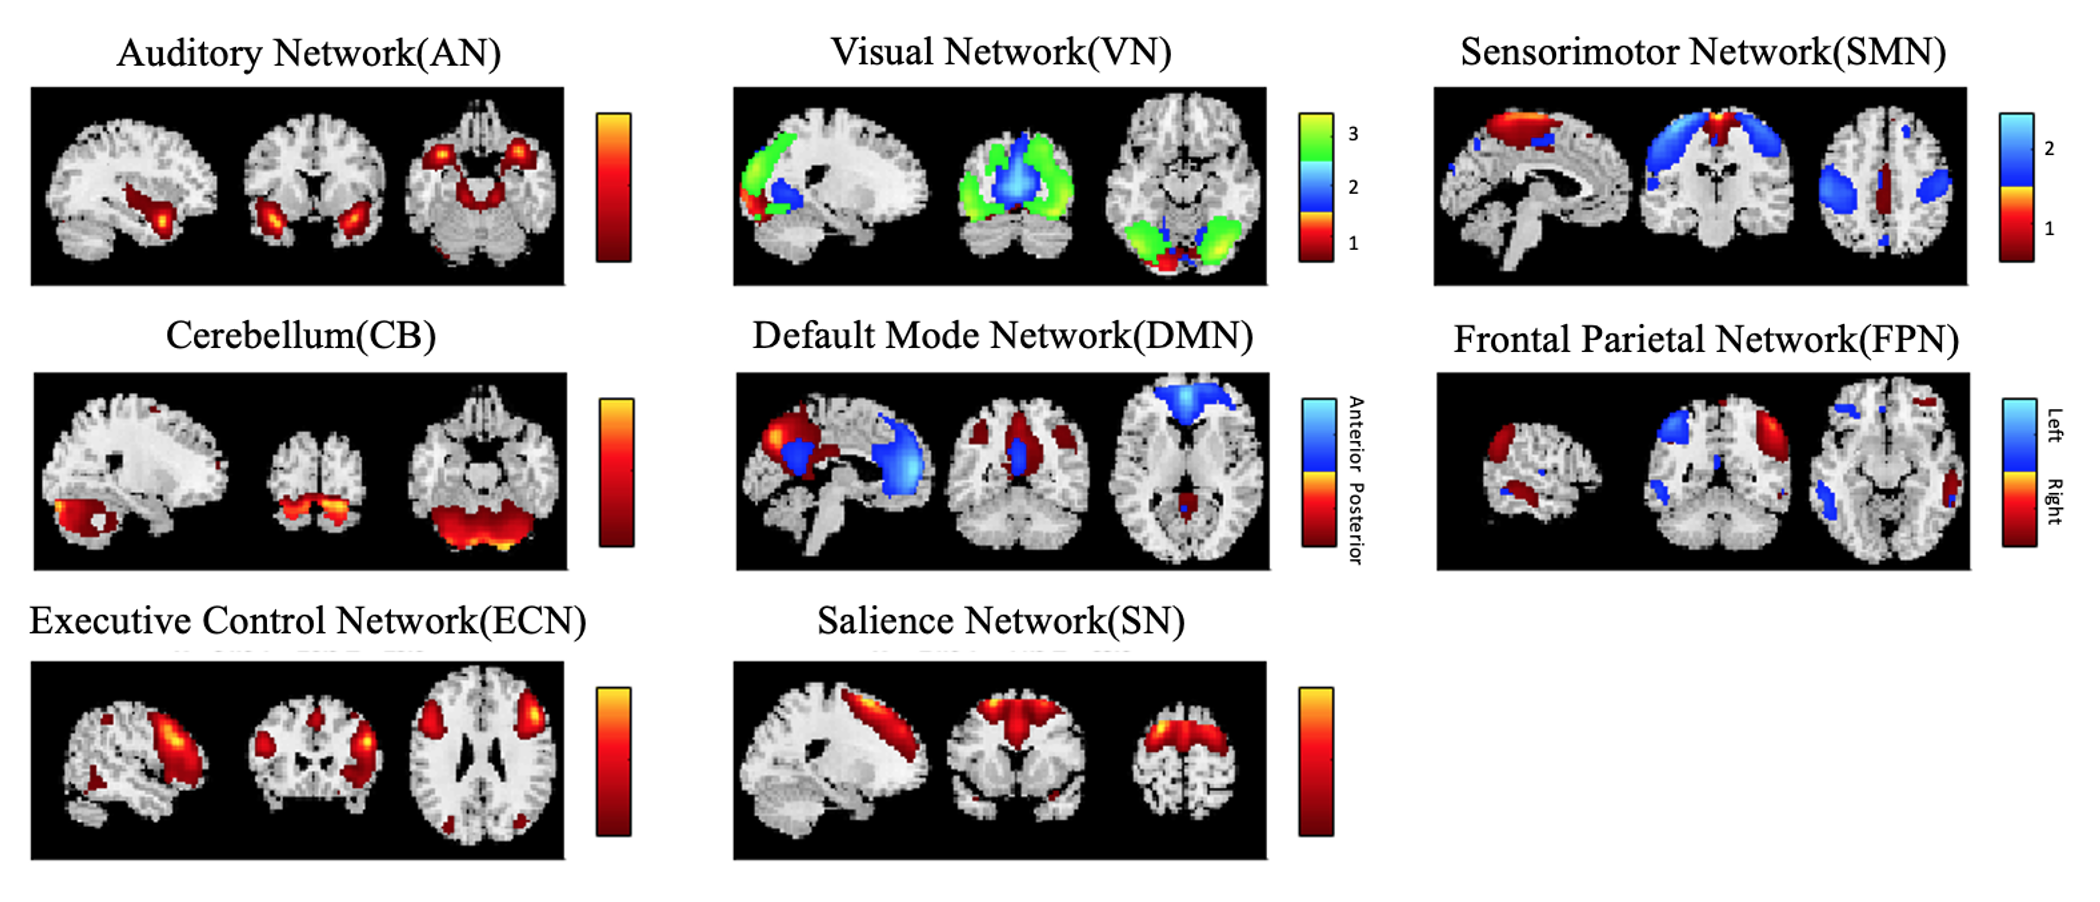
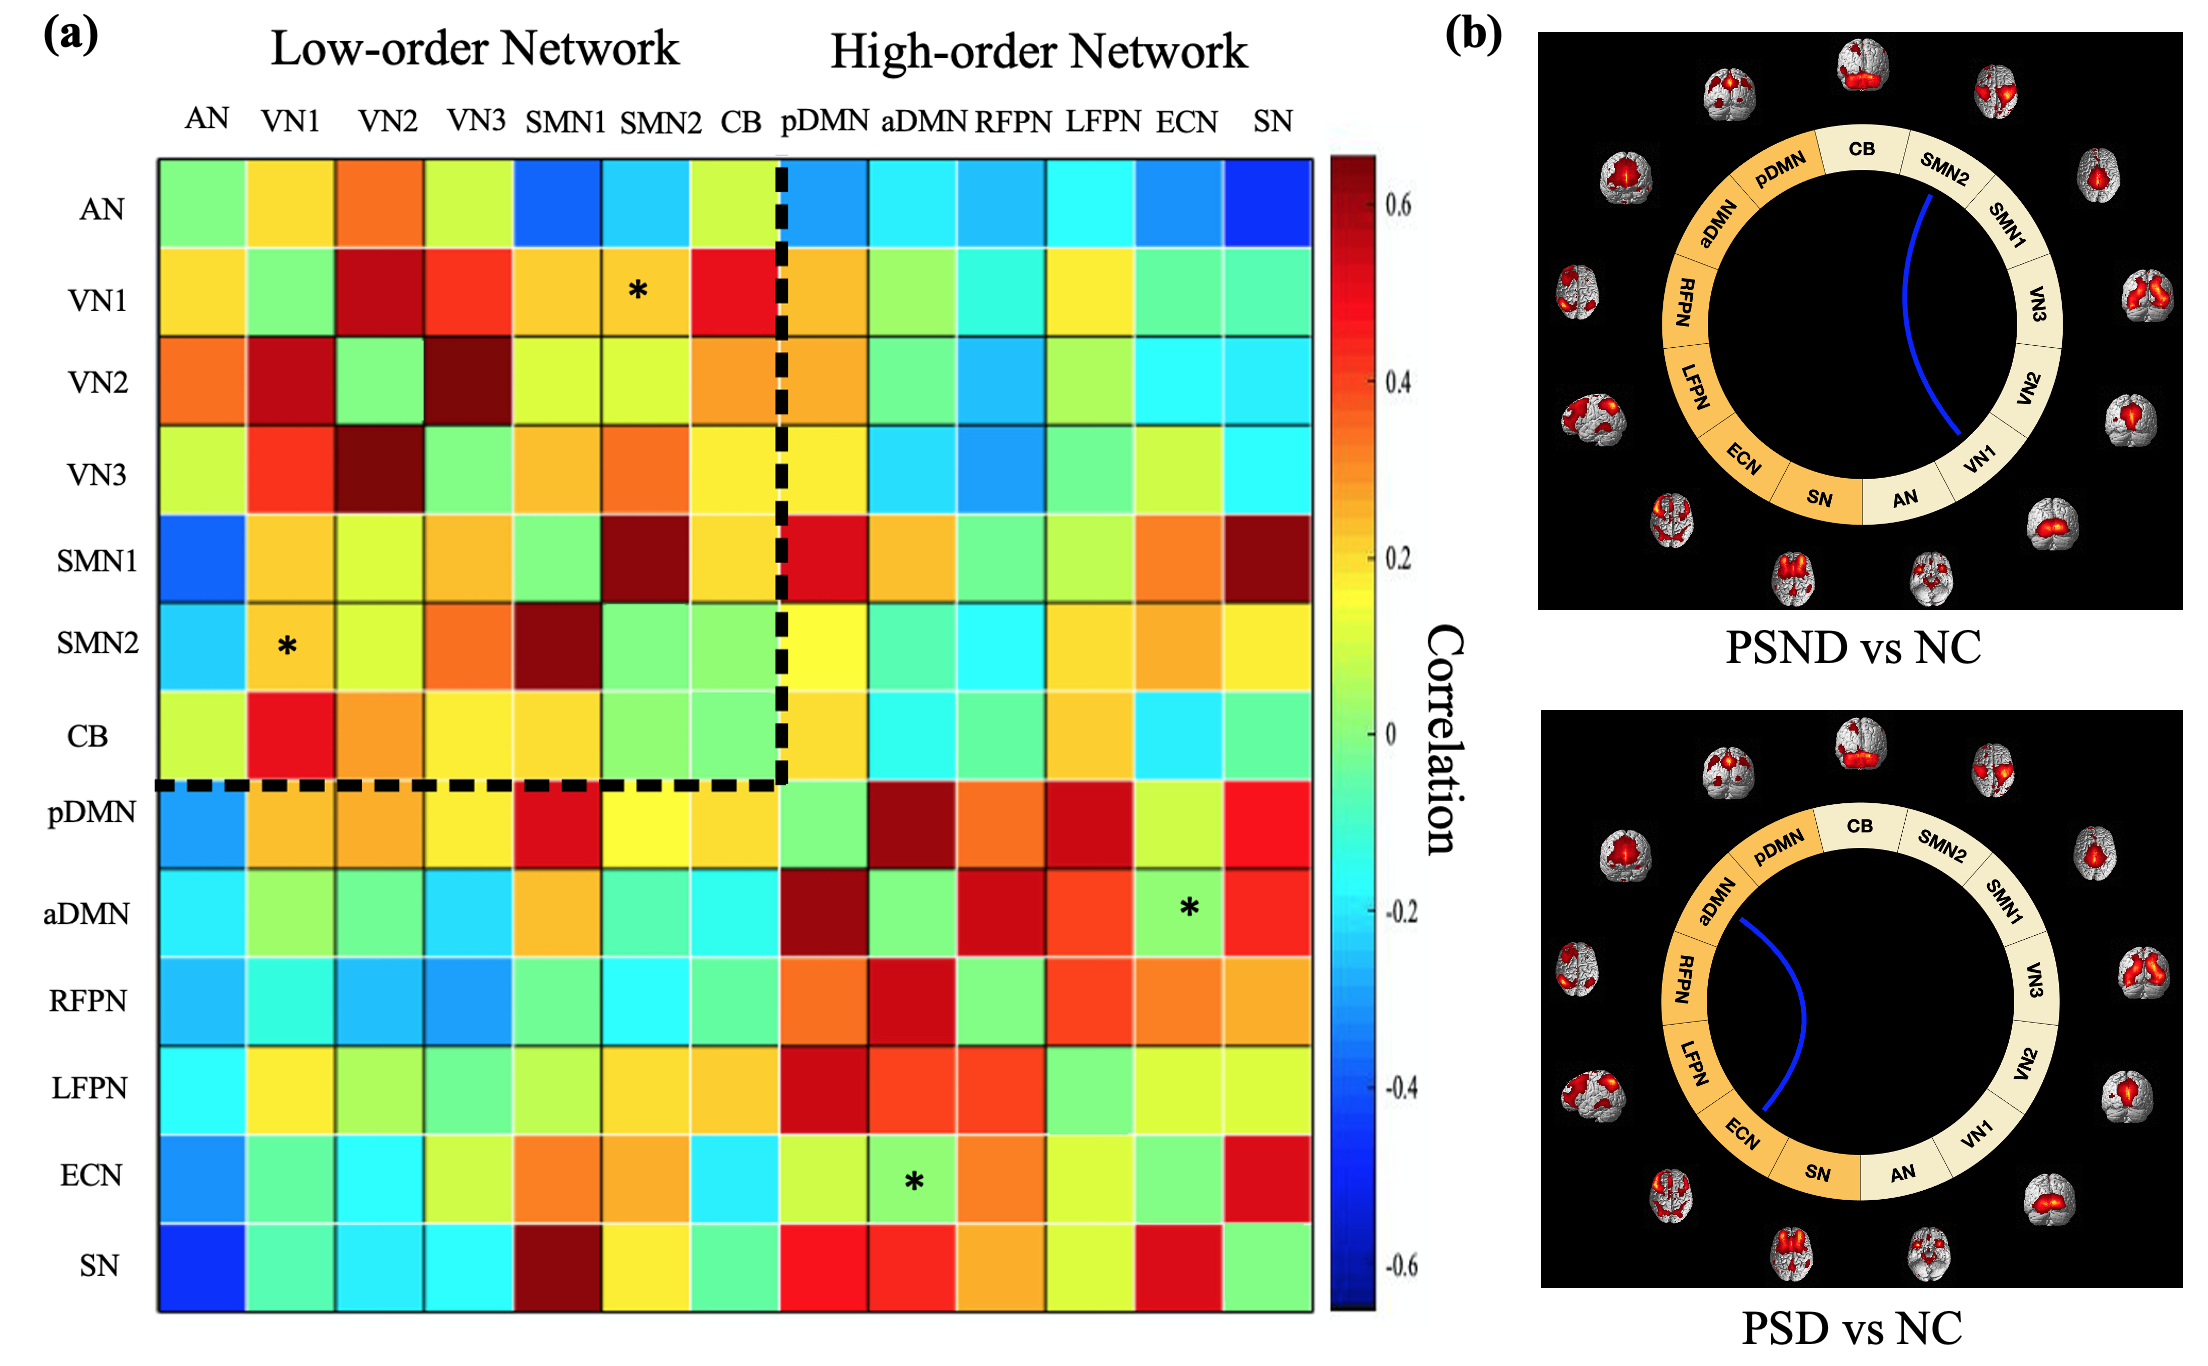
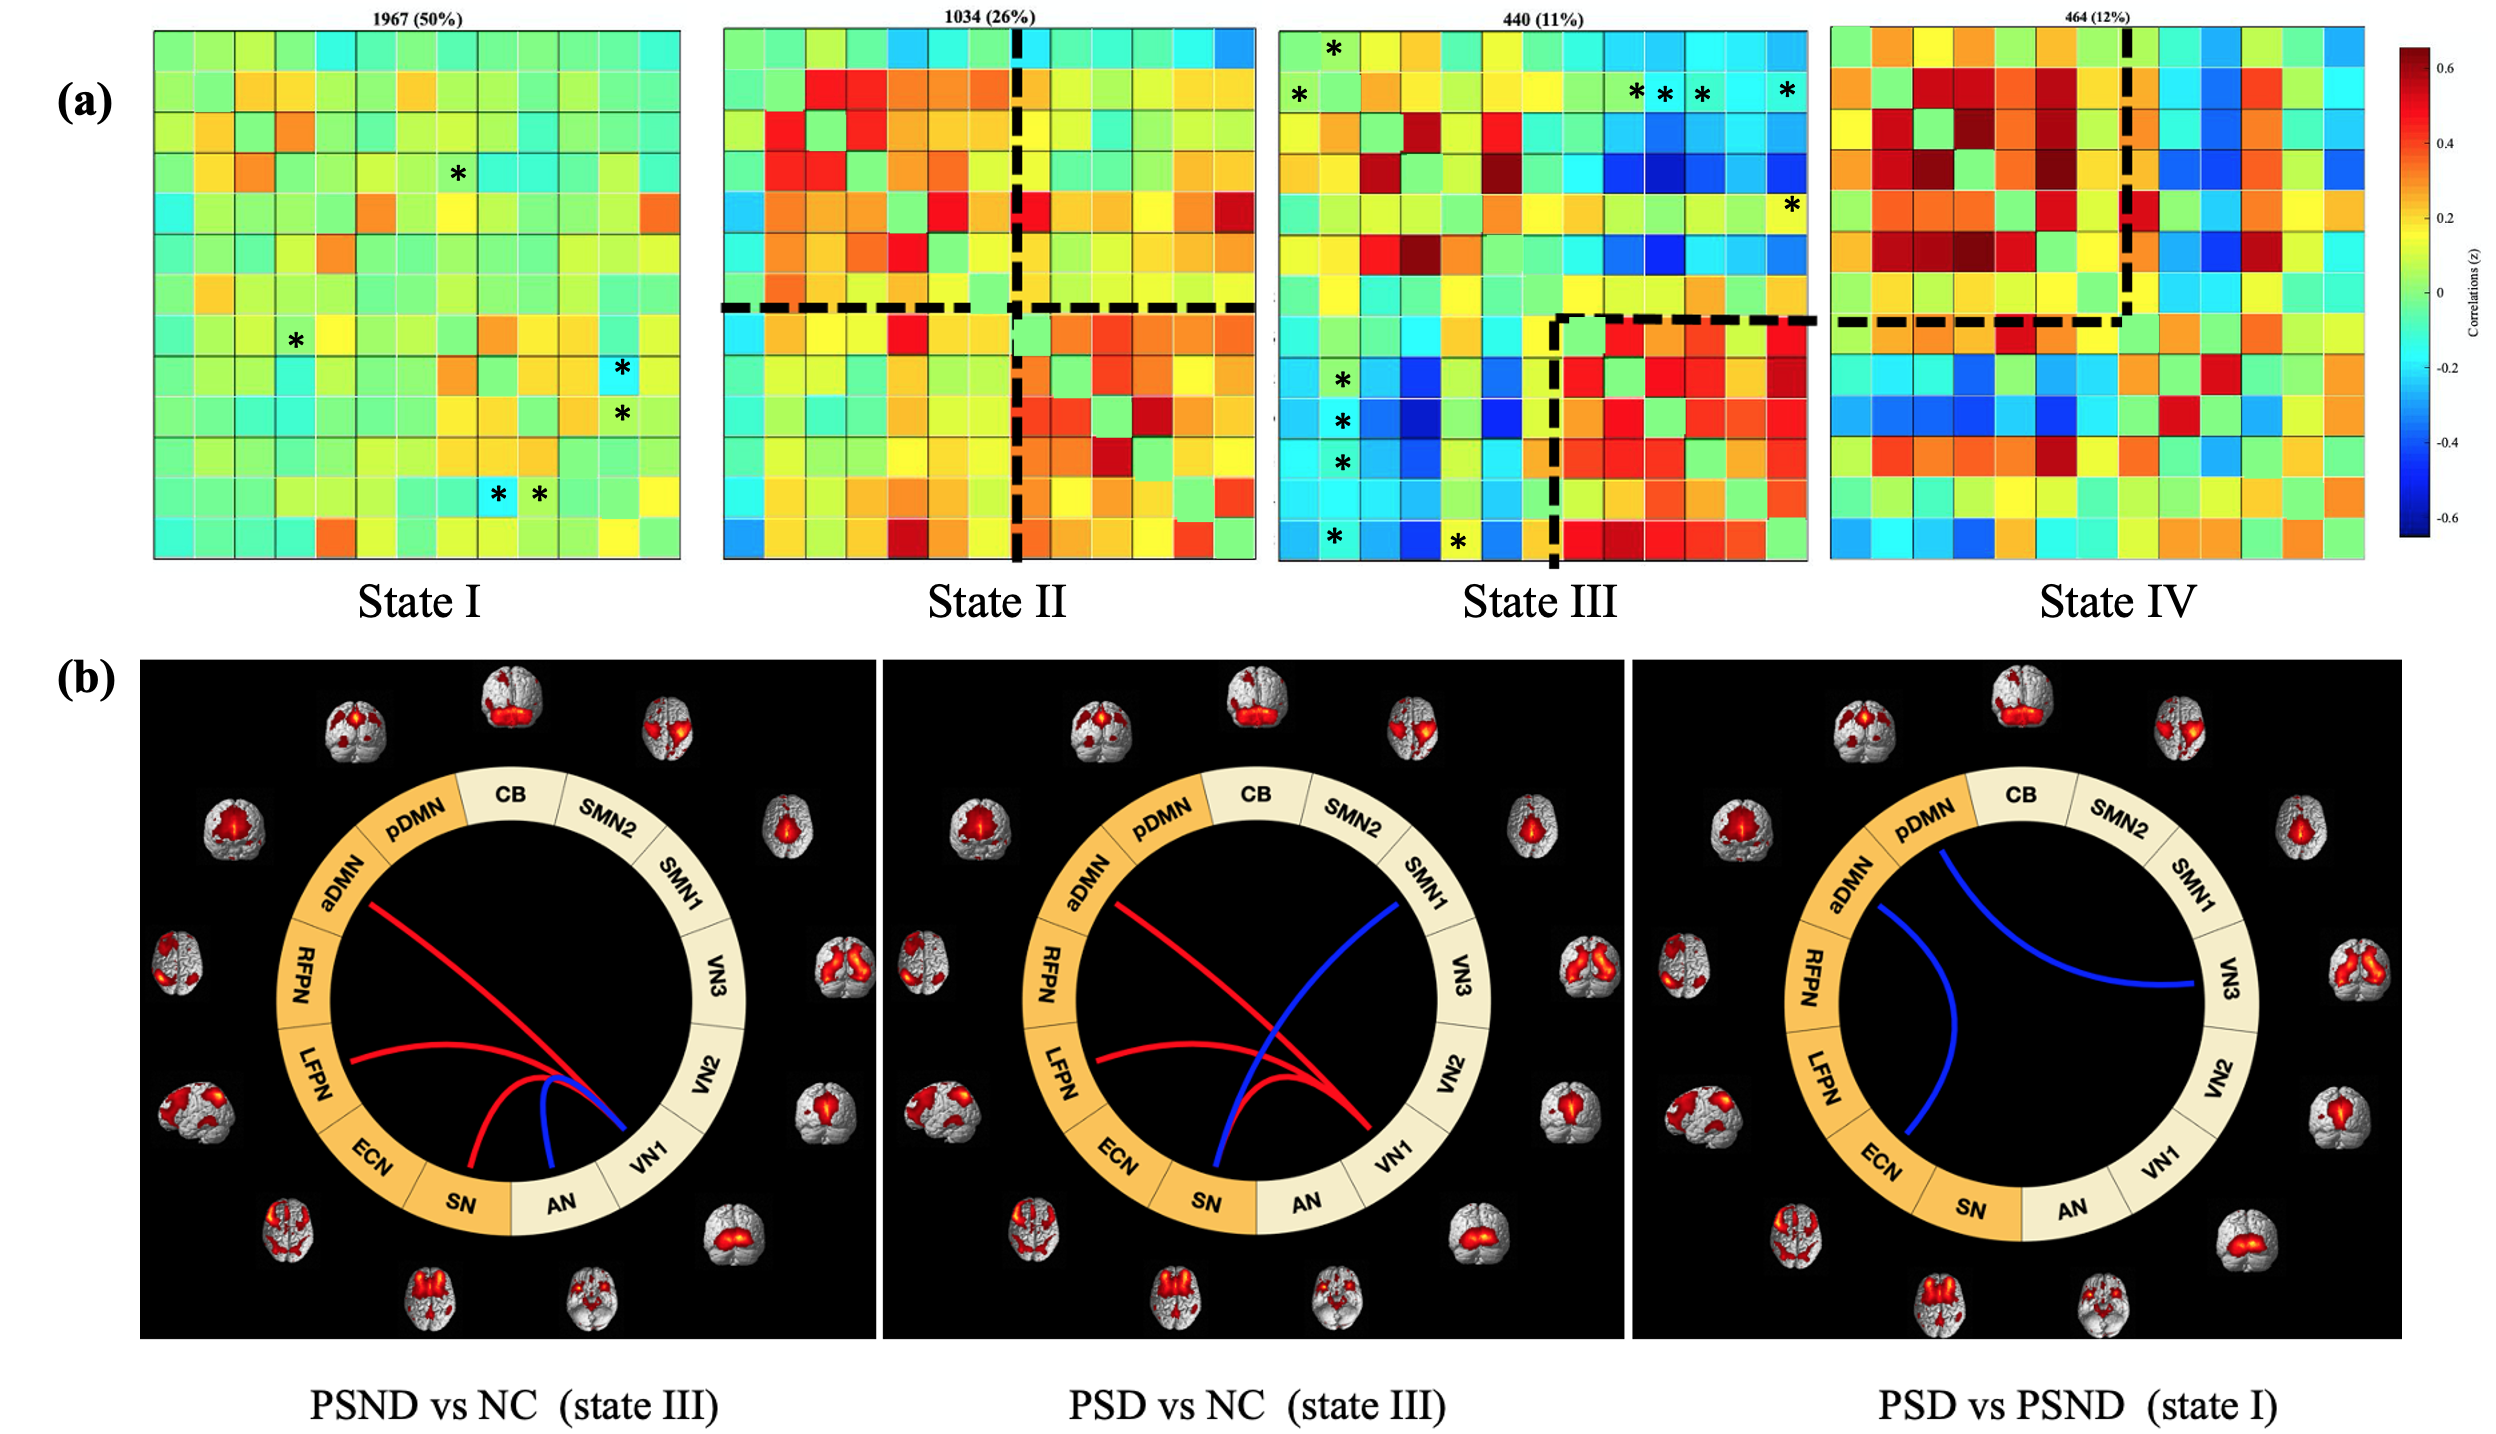
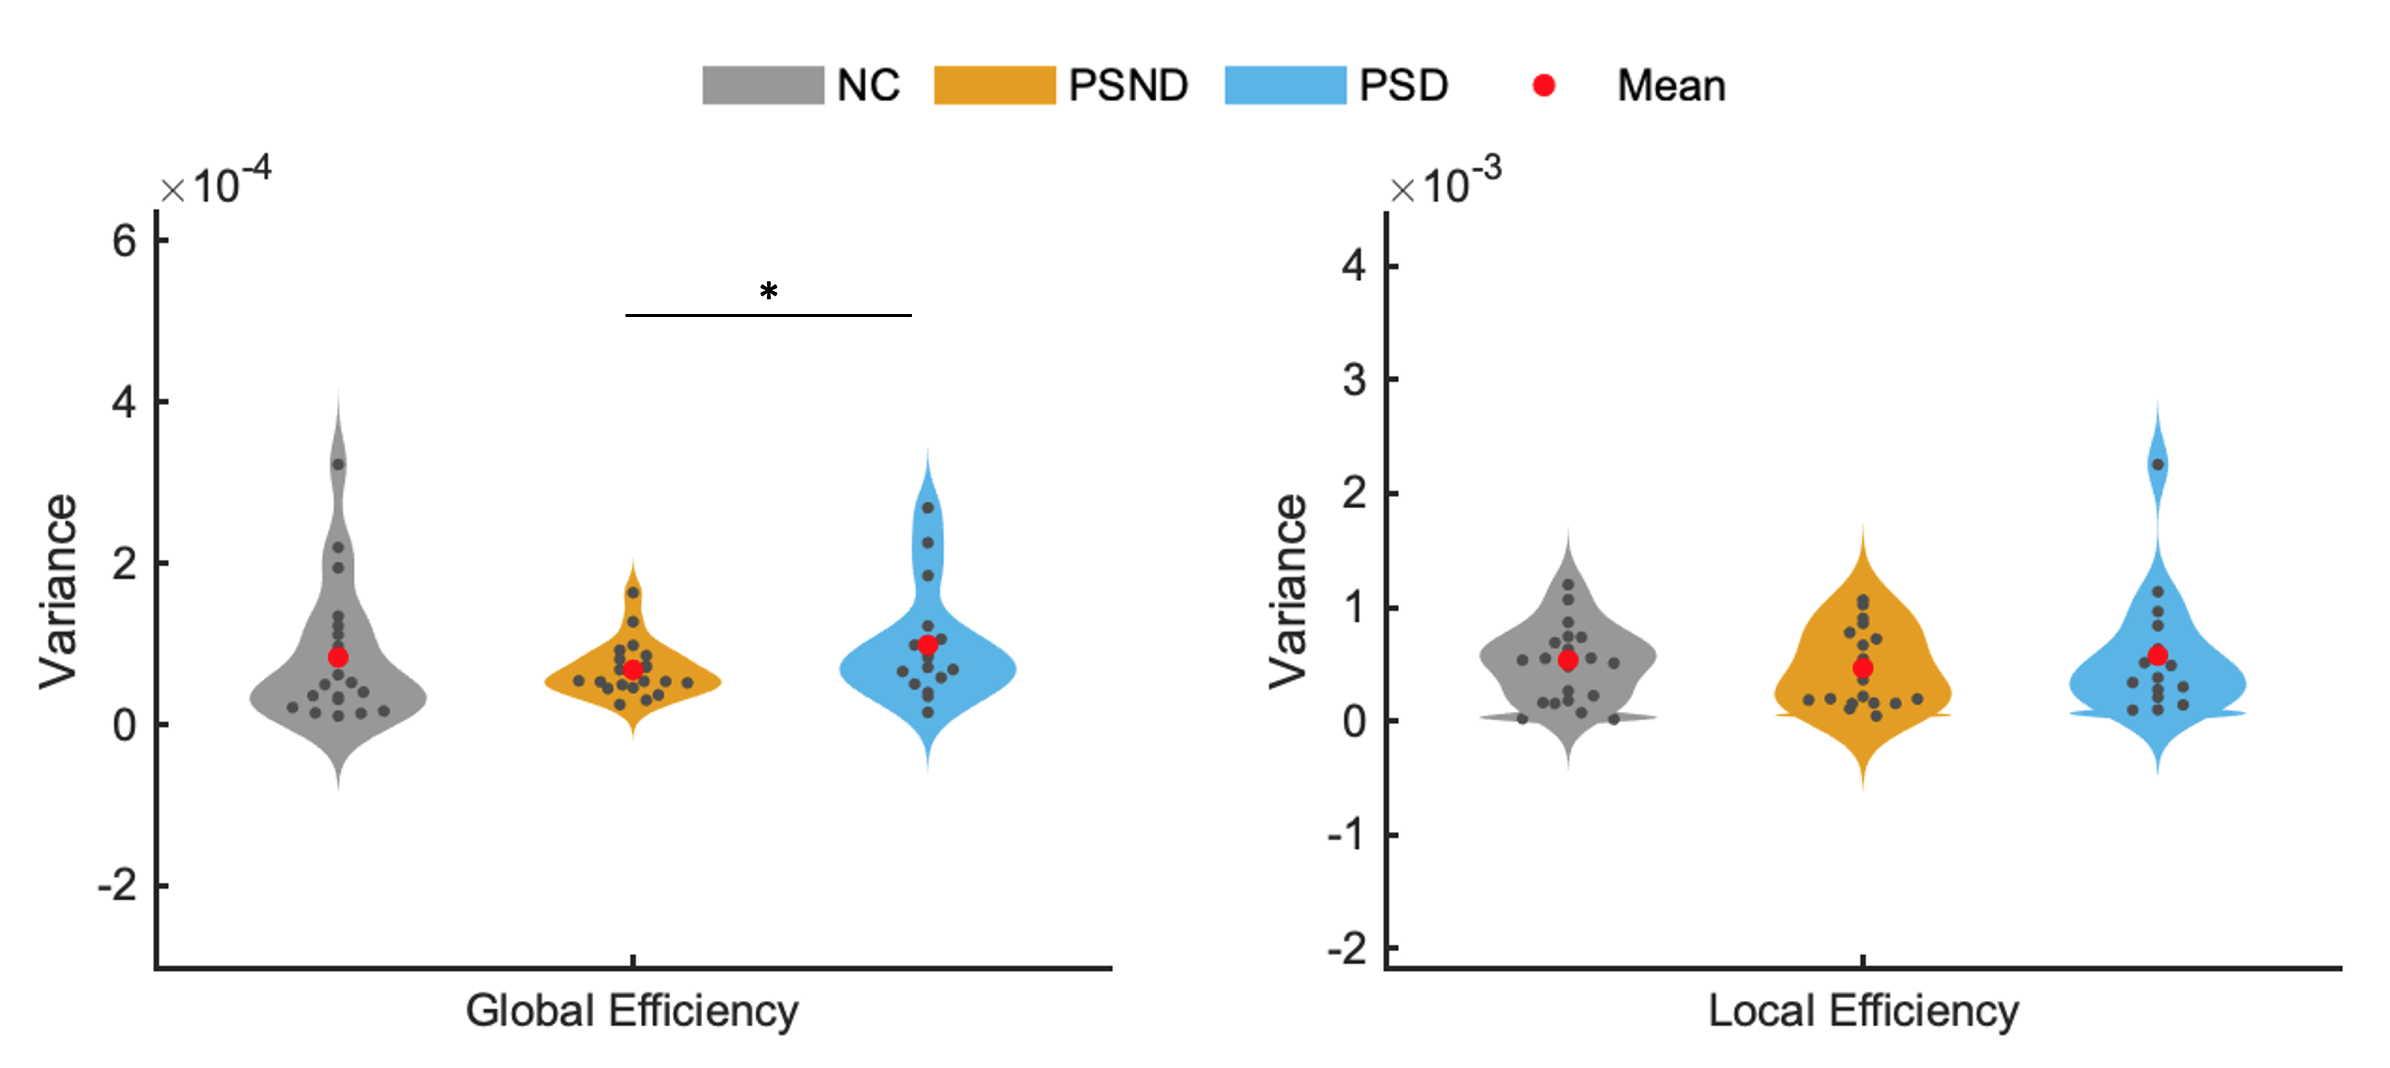
We identified 13 wide-recognized functional networks (Figure 1), which were divided into seven low-order networks (auditory network (AN), three visual networks (VN), two sensorimotor networks (SMN) and cerebellum network (CB)), and six high-order networks (anterior and posterior default mode networks (aDMN and pDMN), left and right frontal parietal networks (LFPN and RFPN), executive control network (ECN) and salience network (SN)).Comparisons between the groups in the sFNC revealed significant reductions (Figure 2) in the low-order network connectivity between VN1 and SMN2 in the PSND, and in the high-order network connectivity between aDMN and ECN in the PSD compared with NC. However, we did not observe a significant difference between PSD and PSND subgroups in the sFNC. The dFNCs were clustered into four connectivity configurations: State I had low connectivity between any pair of networks; State II had high connectivity between high-order networks and between low-order ones; State III and state IV were with high connectivity only between high-order networks or only between low-order ones, respectively (Figure 3a). Comparisons between the groups in the dFNC found that, the state III not only partly replicated the findings in sFNC that PSND group showed decreased FNCs between low-order networks compared with NC group, but also revealed new FNC changes that 1) two patient subgroups both showed increased connectivity between VN1 and three high-order networks (aDMN, LFPN and SN) than NC group; 2) PSND and PSD showed weaker connectivity between VN1 and AN and between SN and SMN1 than NC, respectively (Figure 3b). Moreover, dFNC in the state I displayed decreased connectivity between aDMN and ECN, and between VN3 and pDMN in the PSD compared with PSND, which was not uncovered in the sFNC analysis. Furthermore, the three temporal characteristics of dFNC showed an evident trend that the gradually decreased transitions happened from normal control to PSND to PSD. The graph theory analysis showed a significant increase in time-variance of global efficiency in the PSD compared with PSND group (Figure 5).
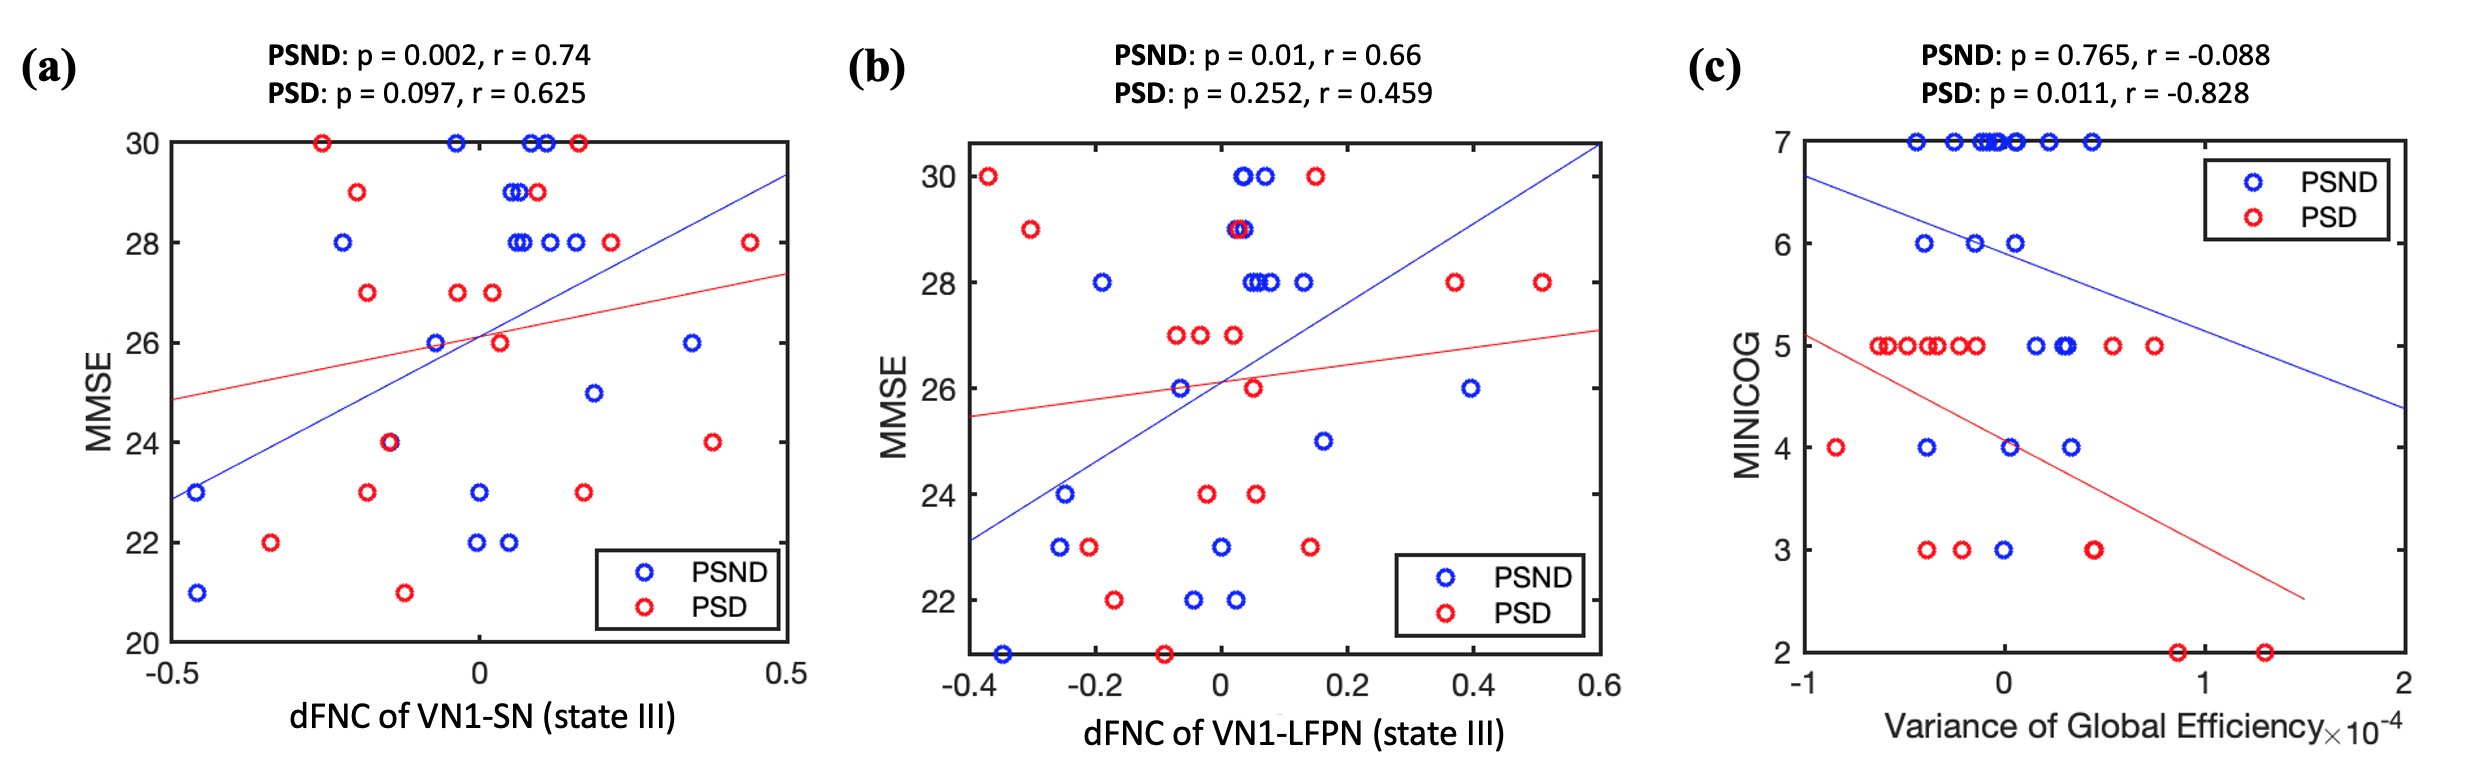
Additionally, the dFNC between VN1 and SN and between VN1 and LFPN in the State III in PSND group, and the variance of global efficiency in PSD group were positively and negatively correlated with cognitive assessments of patients, respectively (Figure 4).
Discussion
In this study, dFNC analysis found PSD-related increases and decreases in the functional connectivity between low- and high-order networks (such a pattern was not observed in sFNC), indicating a coexistence mechanism of functional impairment and compensation at the network level in stroke patients with dementia, which were consistent with the previous stroke and dementia studies [7-9]. Also, PSD patients were less able to switch functional connectivity state and spent longer in state I than the other states, and similar findings have been reported in the Lewy body and Alzheimer’s disease [4]. Moreover, the increased time-variance in the global efficiency may suggest a disrupted functional integration in the whole brain in PSD patients.Conclusion
Our findings suggest that dFNC reveals more PSD-related changes in the FNCs than sFNC, which may characterize the pathological mechanism underlying PSD from the temporal properties.Acknowledgements
This work is supported by the Youth Program of National Natural Science Foundation of China (82001907), Natural Science Foundation of Zhejiang Province of China (LY19H090027), and China Postdoctoral Science Foundation (2020M671726).References
1. Allen, E.A., et al., Tracking whole-brain connectivity dynamics in the resting state. Cerebral cortex, 2014. 24(3): p. 663-676.
2. Calhoun, Vince D., et al., The Chronnectome: Time-Varying Connectivity Networks as the Next Frontier in fMRI Data Discovery. Neuron, 2014. 84(2): p. 262-274.3.
3. Bonkhoff, A.K., et al., Acute ischaemic stroke alters the brain’s preference for distinct dynamic connectivity states. Brain, 2020. 143(5): p. 1525-1540.
4. Schumacher, J., et al., Dynamic functional connectivity changes in dementia with Lewy bodies and Alzheimer's disease. NeuroImage: Clinical, 2019. 22: p. 101812.4.
5. Zhou, J., et al., Divergent network connectivity changes in behavioural variant frontotemporal dementia and Alzheimer’s disease. Brain, 2010. 133(5): p. 1352-1367.5.
6. Smith, S.M., et al., Network modelling methods for FMRI. Neuroimage, 2011. 54(2): p. 875-891.6.
7. Tuladhar, A.M., et al., Default mode network connectivity in stroke patients. PloS one, 2013. 8(6): p. e66556.7.
8. Filippi, M., et al., Resting state dynamic functional connectivity in neurodegenerative conditions: a review of magnetic resonance imaging findings. Frontiers in neuroscience, 2019. 13: p. 657.
9. Fiorenzato, E., et al., Dynamic functional connectivity changes associated with dementia in Parkinson’s disease. Brain, 2019. 142(9): p. 2860-2872.
Figures