2565
Emerging functional connectivity differences in children with autism spectrum disorders and younger siblings affected with Autism1Neuroimaging and Interventional Radiology, National Institute of Mental Health and Neurosciences, Bengaluru, India, 2Child and Adolescent Psychiatry, National Institute of Mental Health and Neurosciences, Bangalore, India, 3Speech Pathology and Audiology, National Institute of Mental Health and Neurosciences, Bangalore, India
Synopsis
Resting-state fMRI studies performed during natural sleep indicate that functional-connectivity in ASD-children begins to differentially mature from earliest periods of life and continues to have distinct patterns throughout early development. In current study, we have performed rs-fMRI in younger (12 to 36-months-of-age) cohorts of ASD, ASD-siblings, and typically developing children to look for functional-connectivity patterns. We observed significantly reduced functional-connectivity in language, social-cognition, and motor regions than controls and ASD-siblings. Interestingly, some of these regions are also considerably different when compared between ASD and ASD-siblings. Altered connectivity may use for targeted interventional therapy for better clinical outcomes in ASD-children.
Introduction
Autism spectrum disorder (ASD) is a group of neurodevelopmental disorders characterized by social deficits and repetitive behaviours that typically emerge by 24 months, resulting from altered brain development1,2. Abnormal cortical brain connectivity has been reported as an explanatory model for ASDs, suggesting how functional connectivity among brain areas may compromise ASDs patients, hampering their ability to accomplish cognitive functions and social tasks3. Resting-state-fMRI provides a means to investigate functional networks or changes in cortical activity with a degree of spatial accuracy that other non-invasive methods cannot obtain. Ample evidence has emerged from rs-fMRI findings for concomitant differences in brain function early in life in at-risk infants and siblings from ASD-affected children before the emergence of overt behavioural signs of ASD4,5. Early detection is essential to develop targeted therapies for early intervention that can facilitate the defining deficits of ASD and improve long-term outcomes.Material and Methods
Twelve ASD-children [mean (SD) age=28.4(5.13)-months], four ASD-siblings [mean (SD) age=17(5)-months], and five typically developing children[ mean (SD) age=16.4(4.5)-months] were included in this study. All participants underwent a detailed clinical and neurodevelopmental evaluation along with an MRI scan. All MRI scans were performed on a 3T Skyra MR system (Siemens, Erlangen, Germany) using a 32-channel head-coil under natural sleep without administering any sedative medication. Following MRI, acquisition parameters were included for T1W and rs-fMRI data. Axial 3D-T1WI [TR/TE/TI=1900/2.43/900ms, FA=13°, resolution=1×1×1mm3], and rs-fMRI [TR/TE=1420/39ms, FA=52°, resolution=2.5×2.5×2.5mm3, acceleration factor=2, volumes=200].Data processing and analysis: All resting-state fMRI data were processed using SPM12 and CONN functional connectivity toolbox6. The pre-processing involved realignment, co-registration of the anatomical scan, normalization, and smoothing. Subsequently, this data was further processed using CONN-toolbox6. For normalization with the paediatric template, we used SPM12 old Normalise (Estimate and Write). The estimation was done using the core-registered T1-weighted image as the source image and a 2-year old infant T1-weighted average image as the template7. Then the functional images were segmented (simultaneous gray/white/CSF segmentation) using mean functional volume, and individual participant masks were created to remove signals from cerebral WM and CSF. Simultaneously the structural image was also segmented. Then both, structural and functional images were normalized to the MNI152 template using CONN-toolbox. To further eliminate correlations caused by head motion and artifacts, we identified outlier time-points in the motion parameters and global signal intensity using the ART method implemented in the CONN toolbox (https://www.nitrc.org/projects/artifact_detect/). Any time point with FD>0.9mm was scrubbed, and data smoothing was performed using Gaussian FWHM of 6mm. Statistical methods: All the statistical analysis was performed in CONN-Toolbox. We explored the positive and negative brain functional connectivity between groups using a two-sided t-test (threshold |t score|>3.97) with a voxel-wise threshold of p<0.001 (uncorrected) and p<0.05 cluster level for FDR-corrected, respectively. We also choose the regions with voxel size ≥50 for statistical significance. Age and gender were included in the analysis as covariates to remove the confounding effect. We also evaluate our neurodevelopmental data to look for differences in social cognition, motor, and language function between these groups.Results
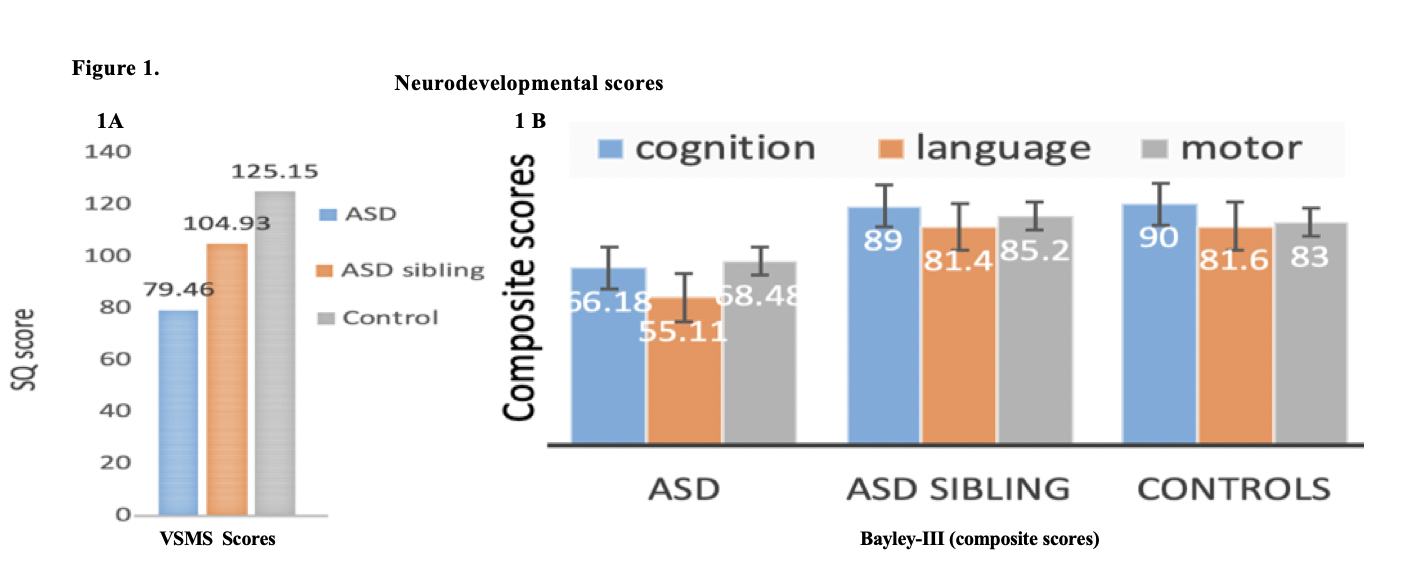
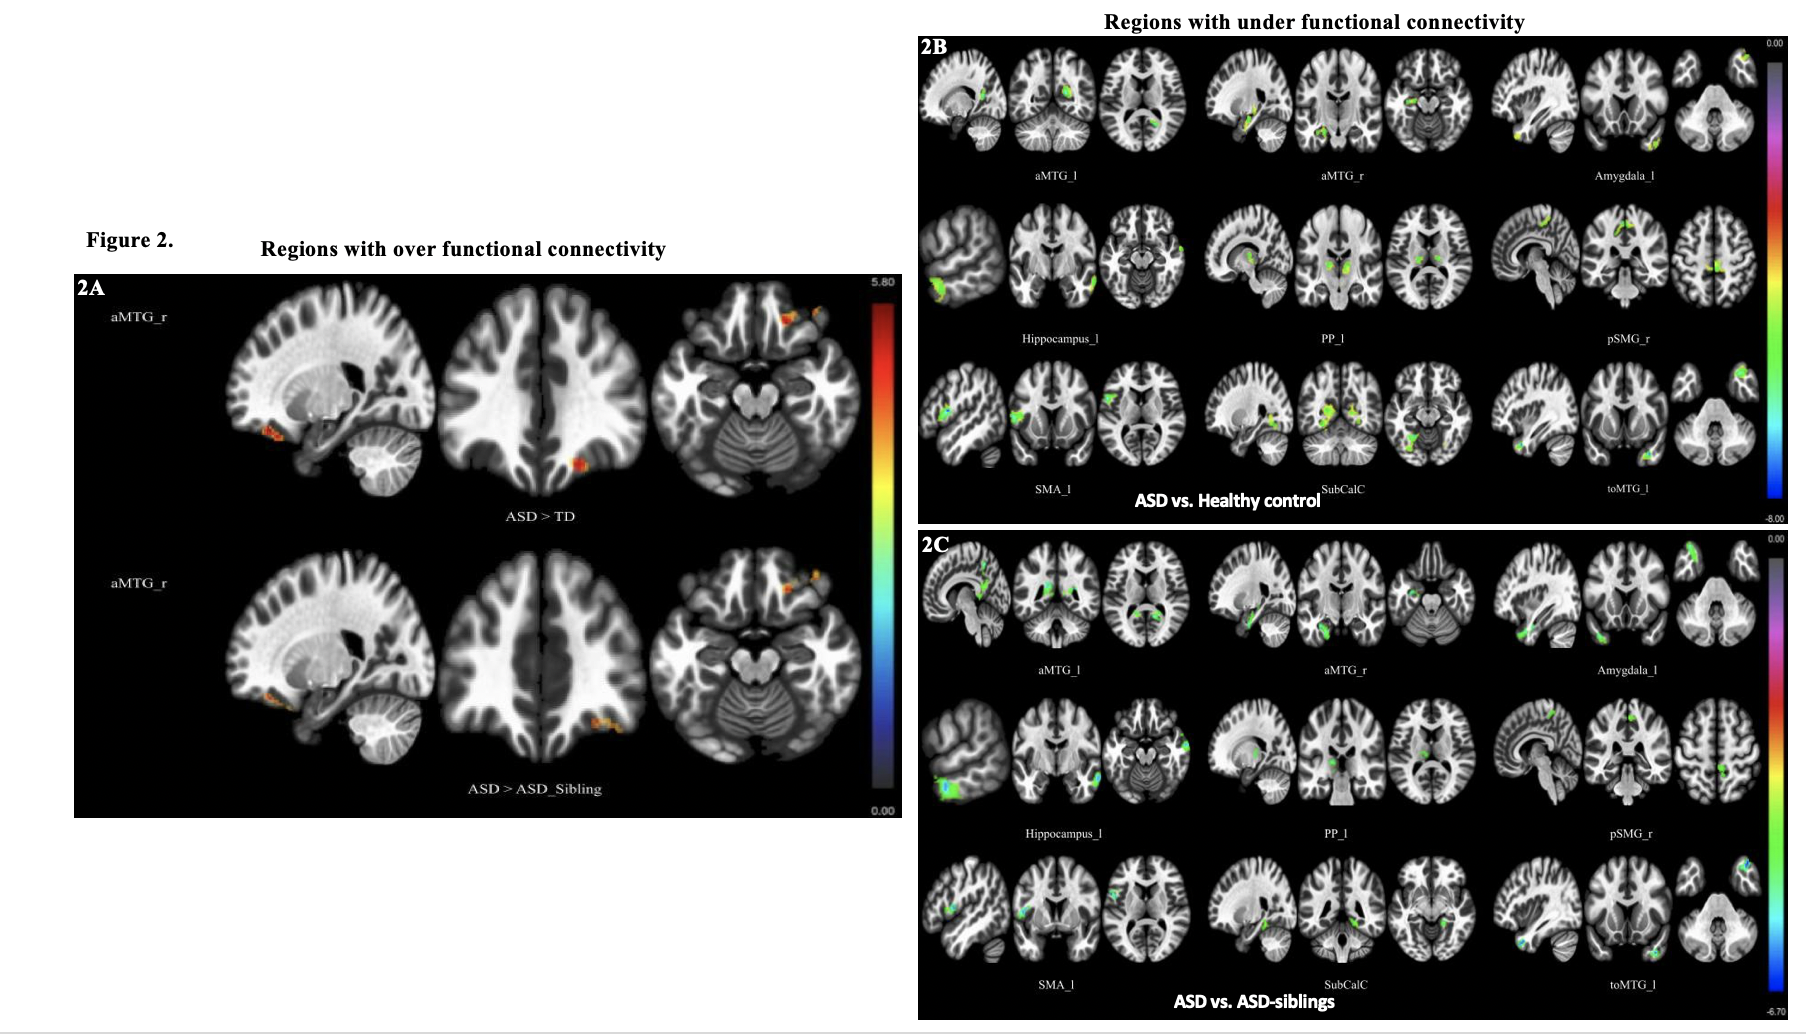
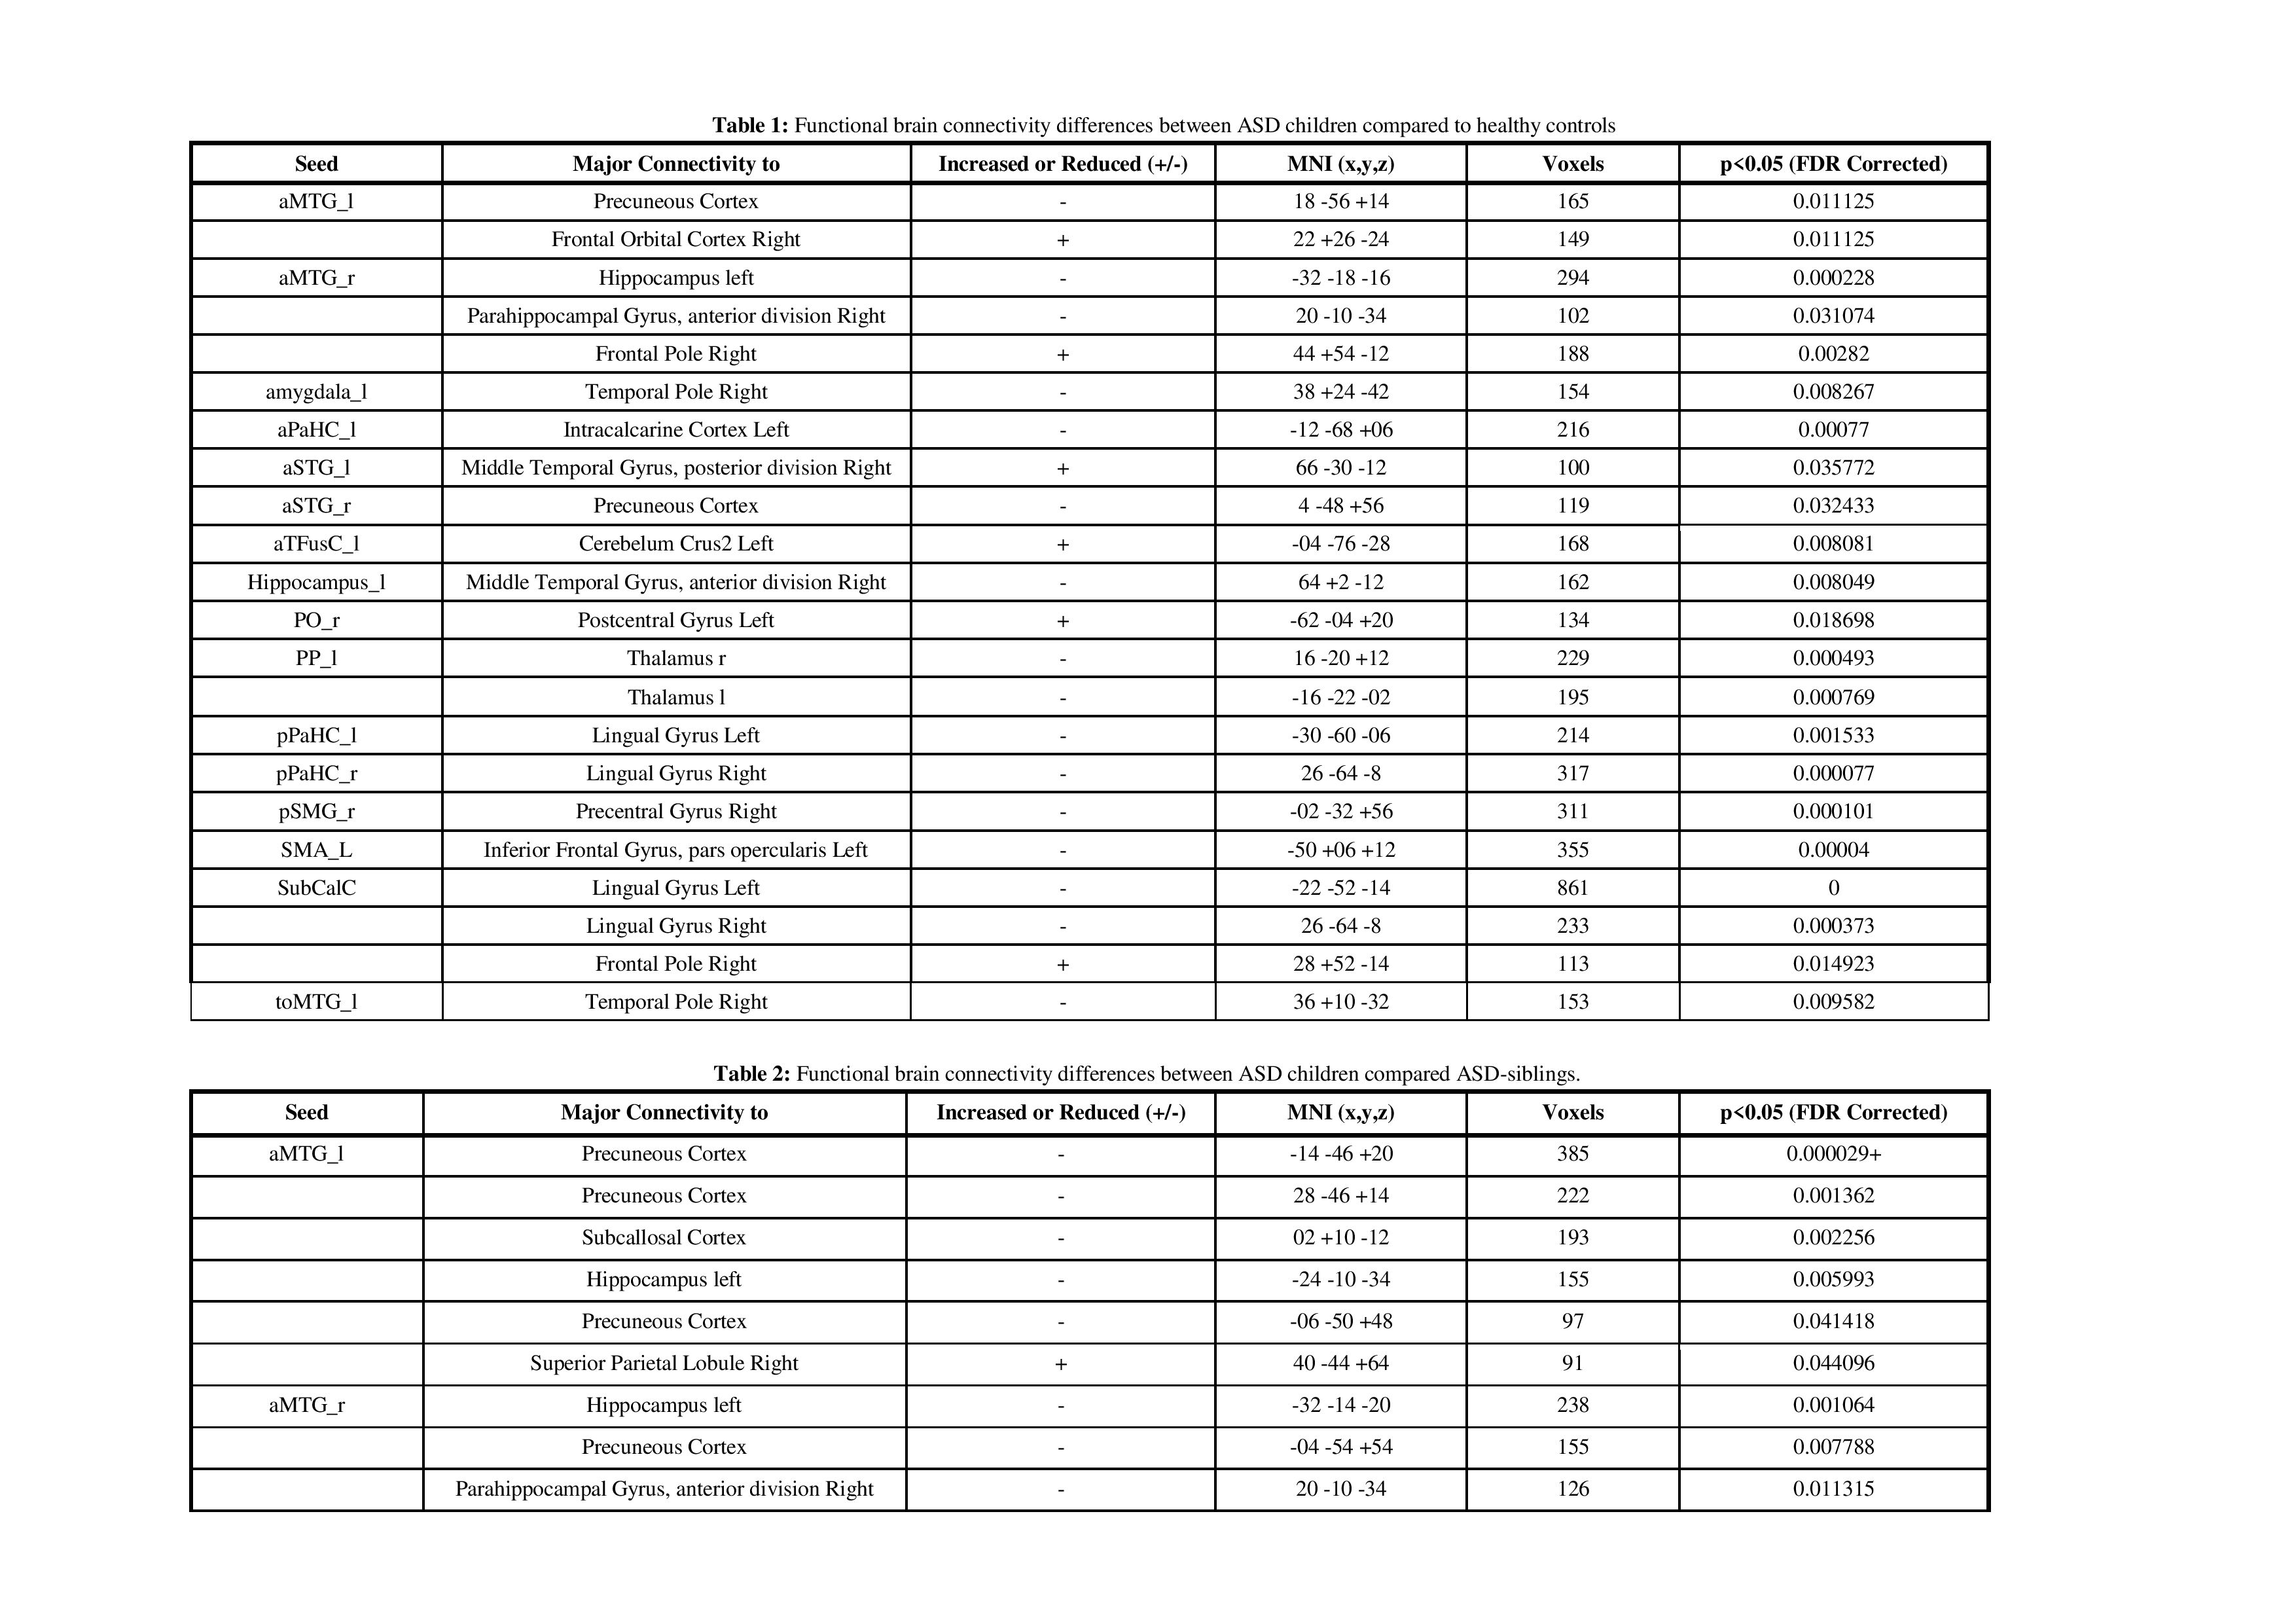
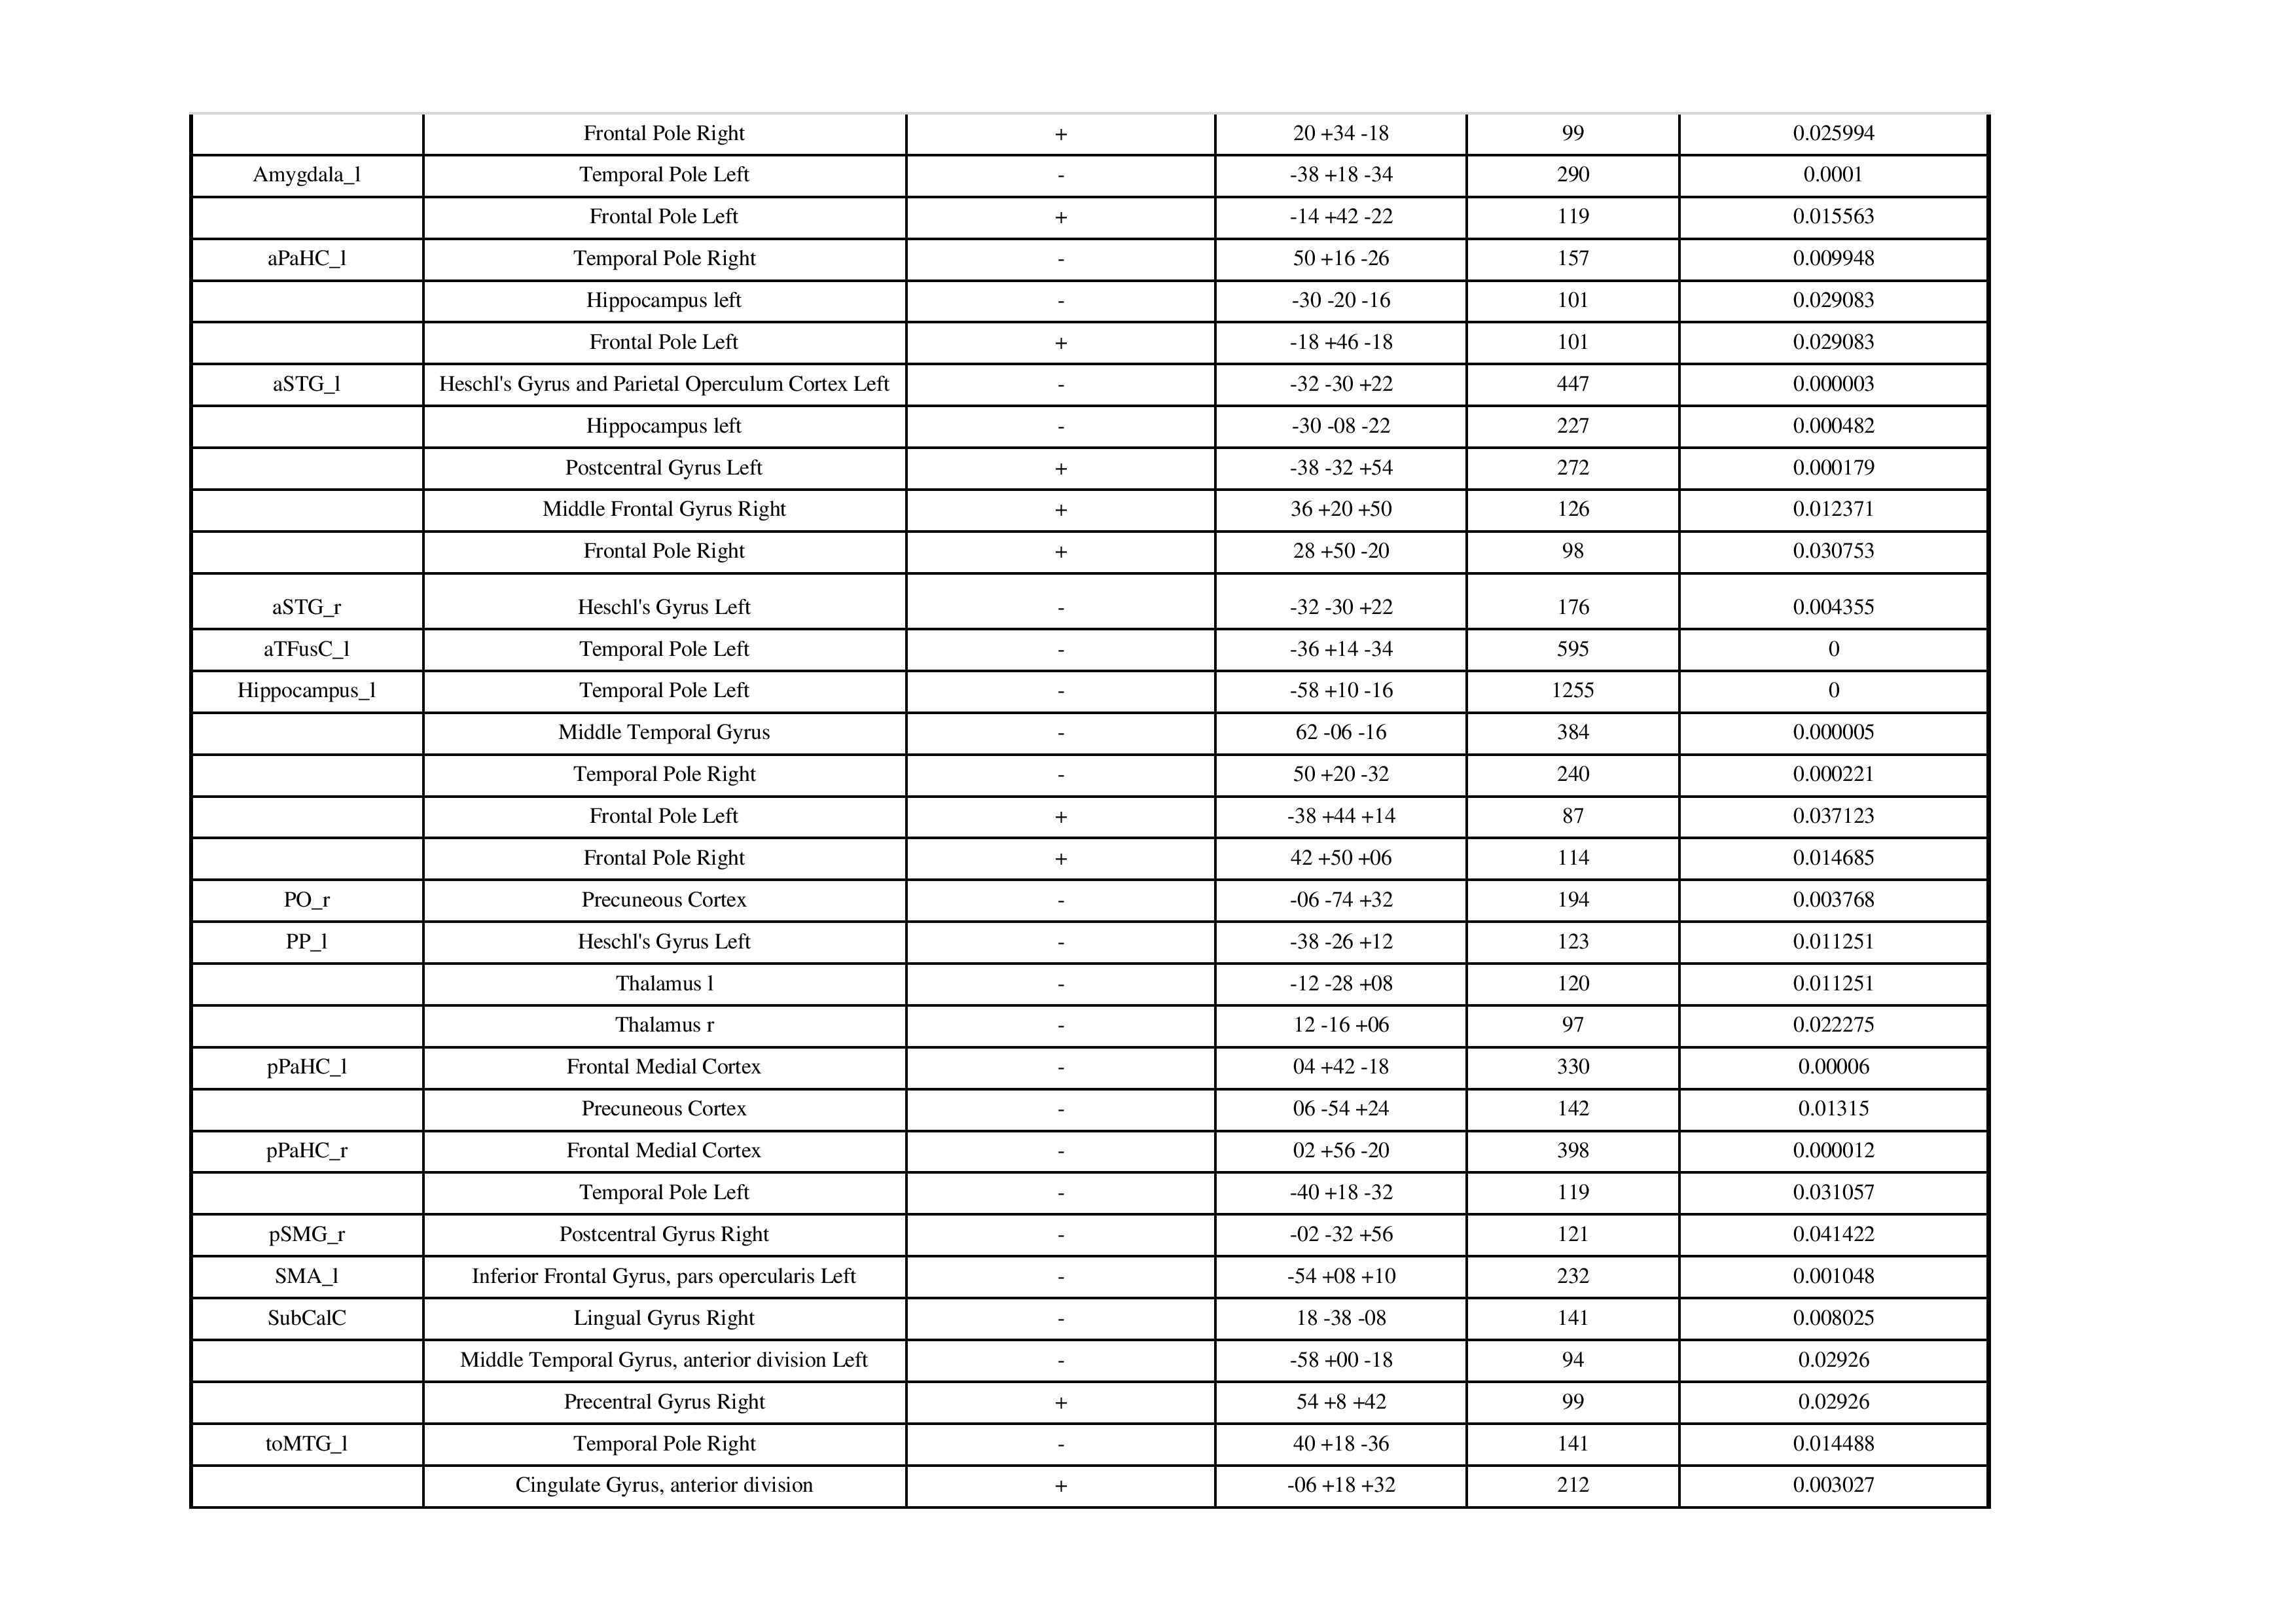
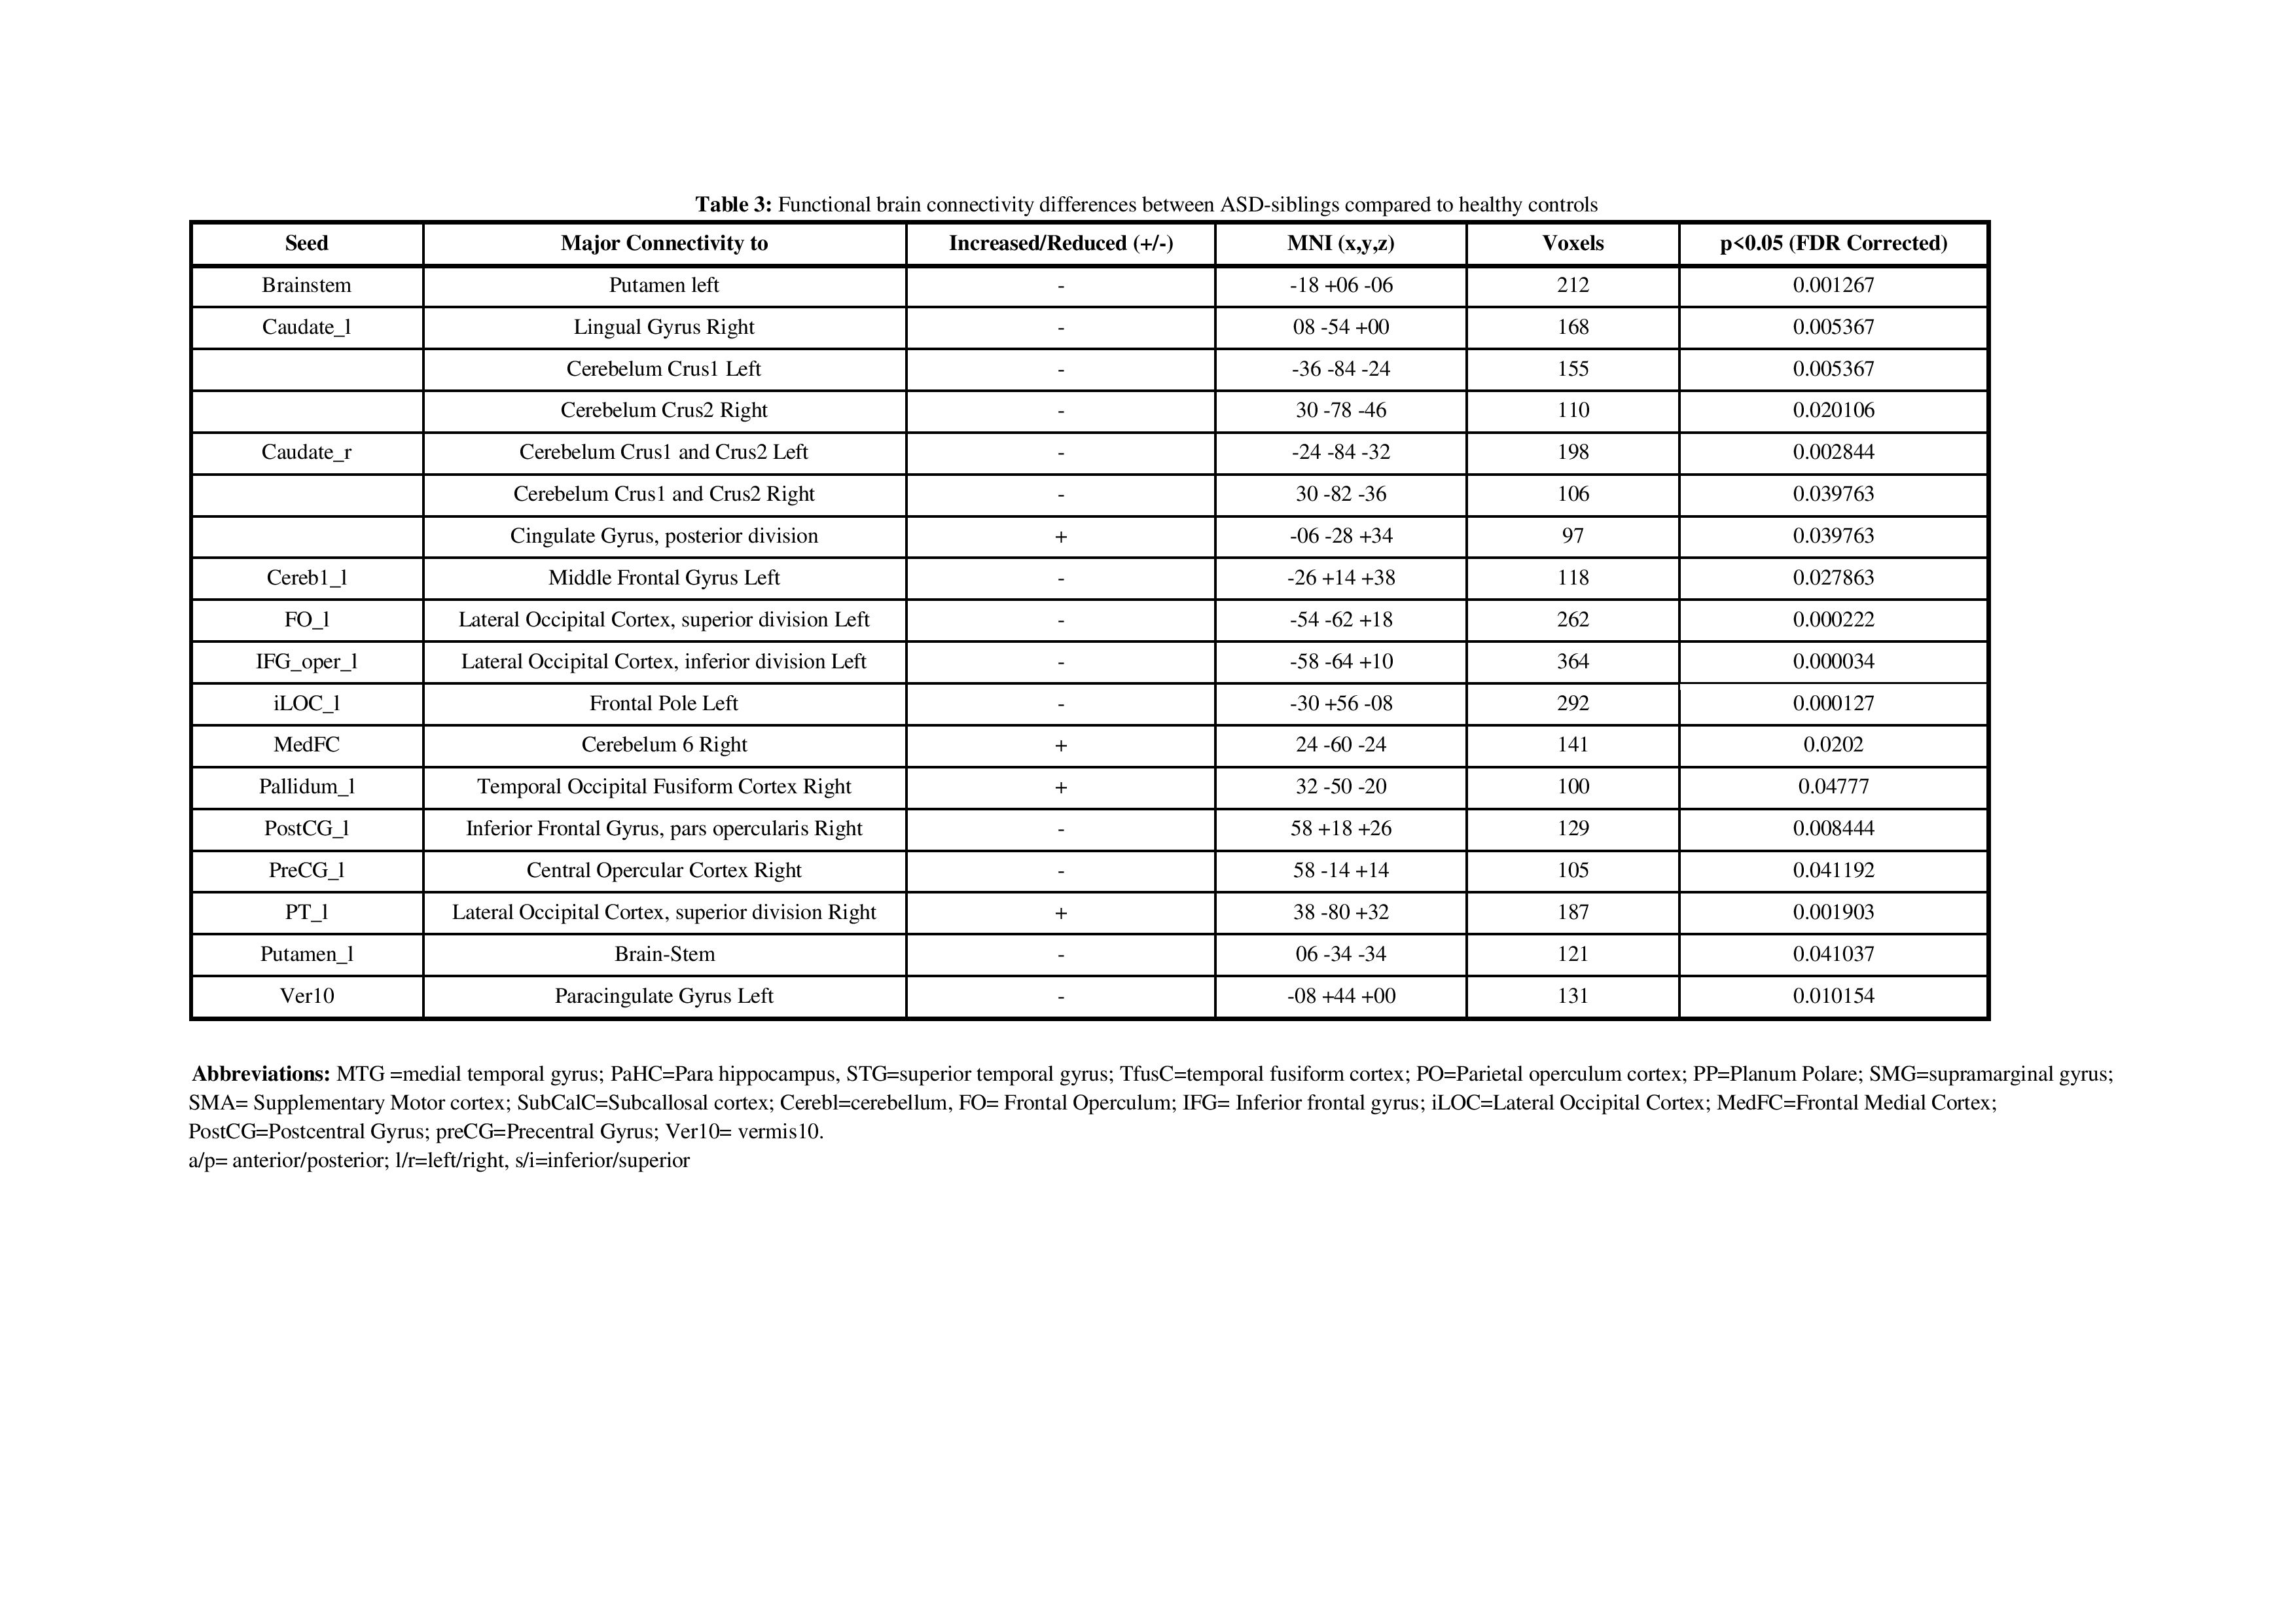
Our neurodevelopmental [Vineland Social Maturity Scale (VSMS), and Bayley-III scales) data demonstrate significant differences between three groups in social quiescent scores (Fig.1A), and social-cognition, language, and motor functions (Fig. 1B). Our resting-state fMRI findings are also concordance with neurodevelopmental data. We observed significantly altered brain connectivity (under- and over-connectivity) patterns in brain regions related to social cognition, motor, and language at a very early age in ASD children compared to age-matched ASD-siblings and typically developing children (Fig. 2A-C, and Table 1-3); respectively. We observed significantly altered functional connectivity in language, social cognition, and motor regions than healthy controls and ASD-siblings. For example, we observed underconnectivity in the areas like aMTGl, aMTGr, amygdala, hippocampus, PP-L, pSMG-R, SMA-L, SubcalC, ToMTG-L. We also found regions like aPaHC-L, aSTG-L, aSTG-R, aTFusC-L, PO-R, pPaHC-L, and pPaHC-R where alterations in connectivity were different in ASD compared to ASD-sibling. Interestingly, most of the altered connectivity was found in the left hemisphere of the brain, complementing the previous study8.Discussion
Altered functional brain connectivity is a crucial characteristic of developmental disorders involving various socio-behavioral impairments in ASD. ASD children demonstrate atypical brain connectivity in several resting-state networks compared to ASD siblings and typically developing children1, 2, 9. Higher frontal connectivity and lower temporoparietal connectivity predicted higher ASD symptoms, suggesting that frontal and temporoparietal dysconnectivity play essential roles in the early pathophysiology of ASD. We also observed significantly reduced functional connectivity in language, social-cognition, and motor regions in children with ASD compared to controls and ASD siblings concordance with the previous studies8, 9.Conclusion
Early altered functional brain connectivity in ASD can be captured using resting-state fMRI during early childhood and may inform much-needed advancements in the early detection of ASD. Alterations in some core brain networks occurred in preschool children with autism, which can be used as potential imaging biomarkers for evaluating ASD in earlier stages. This study may provide an insight into altered connectivity that may use for targeted early interventional therapy for better clinical outcomes for children with ASD.Acknowledgements
We would like to thank the children and family members who gave their time and energy to participate in this. We also thank the funding agency (DBT, Govt. India, Grant Award Number: DBT-RF/007/303/2017/01027) for supporting us in carrying out this work.References
1. Emerson RW, Adams C, et. al. Functional neuroimaging of high-risk 6-month-old infants predicts a diagnosis of autism at 24 months of age. Sci Transl Med. 2017 Jun 7;9(393):eaag2882.
2. Hiremath CS, Sagar KJV, et. al. Emerging behavioral and neuroimaging biomarkers for early and accurate characterization of autism spectrum disorders: a systematic review. Transl Psychiatry. 2021 Jan 13;11(1):42.
3. Kana RK, Libero LE, Moore MS. Disrupted cortical connectivity theory as an explanatory model for autism spectrum disorders. Phys Life Rev. 2011 Dec;8(4):410-37.
4. Hull JV, Dokovna LB, et. al. Resting-State Functional Connectivity in Autism Spectrum Disorders: A Review. Front Psychiatry. 2017 Jan 4;7:205.
5. Varcin KJ, Jeste SS. The emergence of autism spectrum disorder: insights gained from studies of brain and behaviour in high-risk infants. Curr Opin Psychiatry. 2017;30(2):85-91.
6. Whitfield-Gabrieli S, Nieto-Castanon A. Conn: a functional connectivity toolbox for correlated and anticorrelated brain networks[J]. Brain connectivity, 2012, 2(3): 125-141.
7. VS Fonov, AC Evans, et. al. Unbiased nonlinear average age-appropriate brain templates from birth to adulthood. NeuroImage 2009 July; 47(1): S102.
8 Floris DL, Wolfers T, et. al. Atypical Brain Asymmetry in Autism-A Candidate for Clinically Meaningful Stratification. Biol Psychiatry Cogn Neurosci Neuroimaging. 2021 Aug;6(8):802-812.
9. Yerys BE, Herrington JD, et al. Globally weaker and topologically different: resting-state connectivity in youth with autism. Molecular Autism 8, 39 (2017). https://doi.org/10.1186/s13229-017-0156-6
Figures