2562
Non-invasive measures of resting perfusion and hemodynamic compromise in patients with large vessel steno-occlusive disease1Department of Physiology, University of Toronto, Toronto, ON, Canada, 2Department of Anaesthesia and Pain Management, University Health Network, Toronto, ON, Canada, 3Joint Department of Medical Imaging and the Functional Neuroimaging Lab, University Health Network, Toronto, ON, Canada
Synopsis
Dynamic susceptibility contrast perfusion measures using hypoxia-induced deoxyhemoglobin (dOHb) and BOLD-MRI-CO2 CVR reveals that patients with steno-occlusive disease can have the degree of hymodynamic compromise classified into two severities by the differences in hemodynamic measures at rest and in response to stress.
Introduction
In various neurovascular pathological conditions, the structure and intraluminal diameter of thebrain blood vessels may be compromised. Paired with inadequate collateral blood flow,these pathologies may result in hemodynamic failure. Measuring resting cerebral blood flow (CBF) assesses the adequacy of perfusion but is not indicative of the hemodynamic reserve function of the vessels, as CBF may may be normal even in the presence of a reduced CVR. It is the CVR that is the strongest indicator of increased stroke risk1. This is because low CVR reflects the inadequacy of the collateral blood flow to compensate for surges in CBF demands. Resting CBF measure reflect the adequacy of brain perfusion at rest. In this study we surveilled a cohort of patients with large vessel steno-occlusive disease for concordance of hemodynamic perfusion metrics at rest and following vasoactive stimulation. We measured BOLD-MRI-CO2 CVR and dynamic susceptibility contrast perfusion measures using a new contrast agent, hypoxia-induced deoxyhemoglobin (dOHB)2,3. Generating high concentrations of deoxyhemoglobin by transient lung hypoxia makes this measurement non-invasive and provides a large signal to noise ratio2.Methods
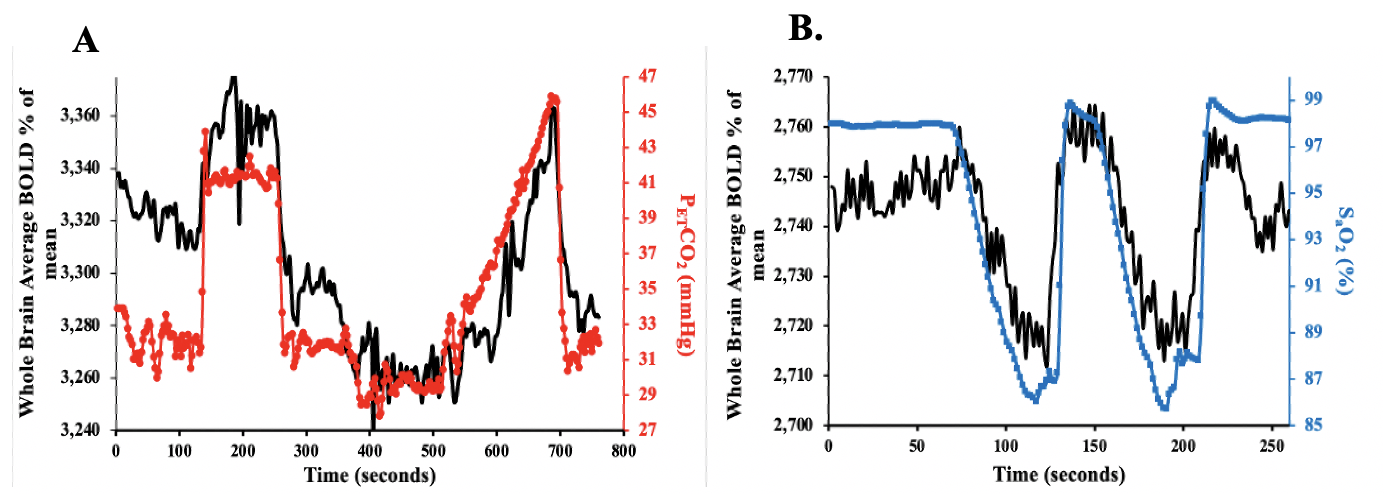
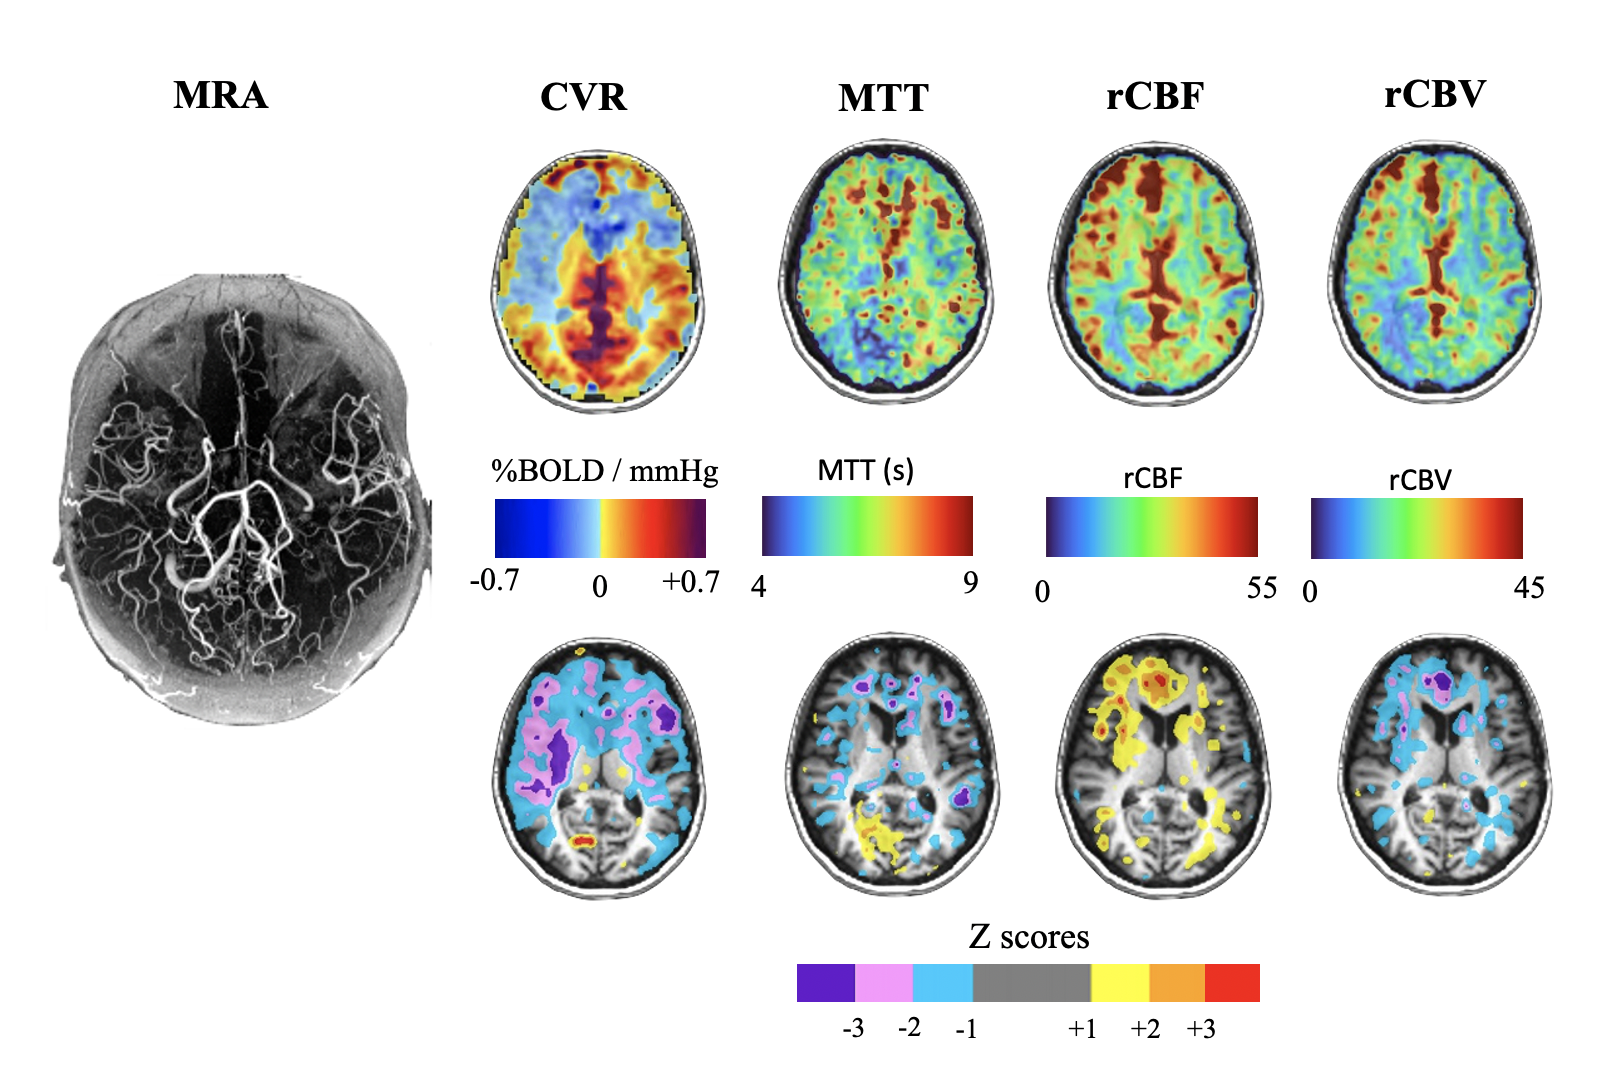
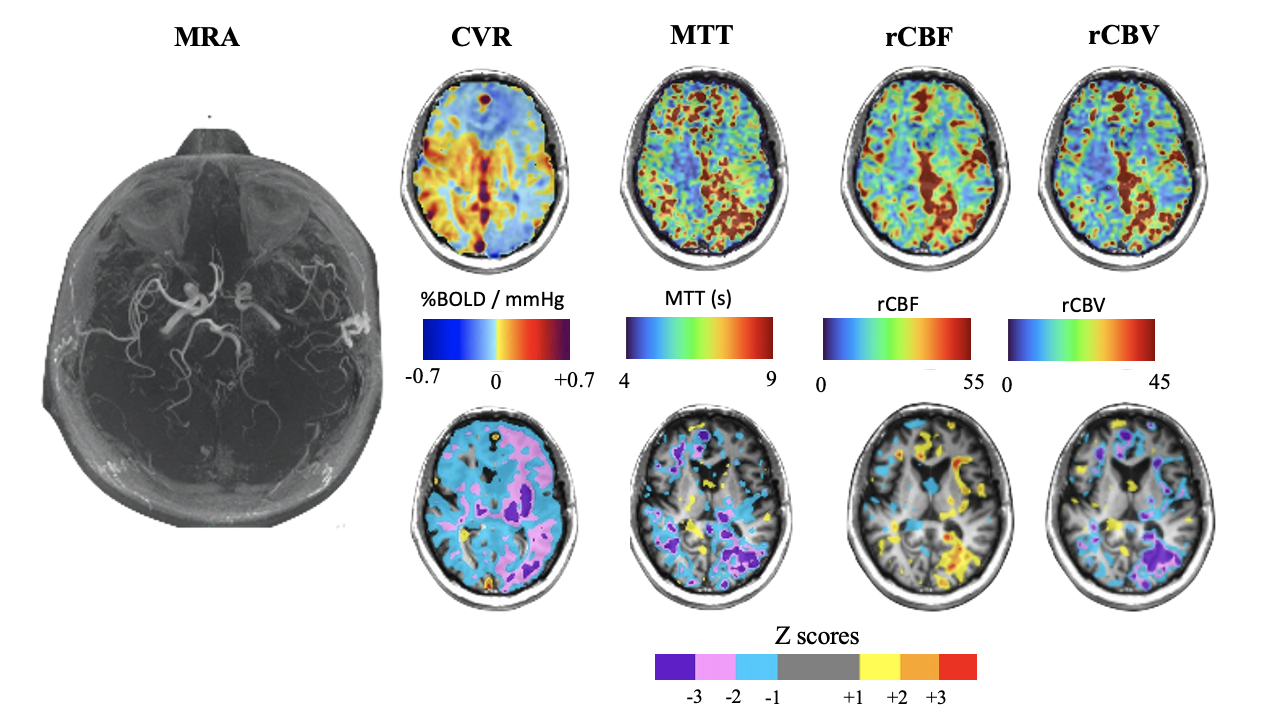
After ethics approval and informed consent, we recruited 22 patients between the ages of 18 and 75 (mean (SD) = 46 (17.72)) with known steno-occlusive disease undergoing routine periodic MRI assessments. A computer-controlled gas blender was used to control end-tidal O2 and CO2 concentrations using sequential gas delivery (RespirAct™, Thornhill Medical, Toronto, Canada). The hypoxia and CVR paradigms are shown in Figure 1. MRI was performed on a 3-Tesla scanner. A total of 2-BOLD sequence scans and a high-resolution T1-weighted scan were attained. The first BOLD sequence was acquired during PETCO2 manipulation while maintaining isoxia over a 13-minute standardized protocol known as a CVR protocol (Figure 1A). The following parameters were used: TR/TE = 2400/30 ms, flip angle = 70◦, 41 slices voxel size = 3.5 mm3 and matrix size = 64 × 64. The second BOLD sequence was acquired during PETO2 manipulation while maintaining normocapnia during a 4 minute 20 second scan (Figure 1B). The following parameters were used: TR/TE = 1500/30 ms, flip angle = 73◦, 29 slices voxel size = 3 mm isotropic voxels and matrix size = 64 × 64. The PETCO2 data was time-shifted to the point of maximum correlation with the whole brain average BOLD signal. A linear fit of the BOLD signal data series to the PETCO2 data series was then performed on a voxel-by-voxel basis, together with a linear trend regressor to calculate CVR values using AFNI software4. Next, the SaO2 was used as the arterial input function (AIF) as calculated from oxyhemoglobin disassociation curve5 using the PETO2 data3. To determine perfusion measures such as MTT and rCBF, VERBENA software6 was used. rCBV was calculated as MTT multiplied by rCBF. Previously generated CVR and dOHb atlases were used to calculate individualized z-scores on a voxel-by-voxel basis and scored by assigning a z-score according to the mean and SD of the corresponding voxel of the atlas7.Results
We found differences in the patterns of hemodynamic measures between resting and functional assessments in 10 patients. At rest these patients showed close to normal CBF and MTT values, but when the vasculature was stressed with CO2 hypercapnia, vasodilation cannot respond and CVR is decreased. In 12 patients perfusion measures at rest showed the same distribution of pathological MTT as the CVR measure (Figure 1). We attribute these findings to patients having a severity of impaired CBF at rest with slow MTT values which spatially correspond to abnormal CVR (Figure 2).Discussion
In subacute cerebrovascular disease, normal resting hemodynamic parameters may indicate that the vasculature is coping with any pathology but the status of vascular reserve is unknown. No further evaluated is available using conventional angiography or resting CBF measurements (such as DSC imaging). However, the presence of collateral circulation as indicated by normal CVR in the presence of large vessel steno-occlusive disease, indicates the presence of collateral blood flow and a reduced risk of stroke1,8. In our study, hemodynamic assessment by using dOHb as dynamic susceptibility contrast and CVR tested the hemodynamics in the resting state and CVR aided in the detection and characterization of the effectiveness of collateral blood flow8,9.Conclusion
By using BOLD-MRI-CO2 CVR and novel dynamic susceptibility contrast perfusion measures using hypoxia-induced deoxyhemoglobin2,3 we were able to categorize patients into two categories of pathological severity. This may aid in the management of patients with cerebrovascular disease.Acknowledgements
All the authors thank Toronto Western Hospital MR technologist Keith Ta for all his help in acquiring the MR imaging data.References
1. Reinhard M, Schwarzer G, Briel M, Altamura C, Palazzo P, King A, Bornstein NM, Petersen N, Motschall E, Hetzel A, et al. Cerebrovascular reactivity predicts stroke in high-grade carotid artery disease. Neurology. 2014;83(16):1424–1431. doi:10.1212/WNL.0000000000000888
2. Sayin ES, Schulman J, Poublanc J, Levine H, Venkatraghavan L, Uludag K, Fisher JA, Mikulis DJ, Sobczyk O. Cerebral perfusion imaging: Hypoxia-induced deoxyhemoglobin or gadolinium? 2021 Nov 10:29.
3. Poublanc J, Sobczyk O, Shafi R, Sayin ES, Schulman J, Duffin J, Uludag K, Wood JC, Vu C, Dharmakumar R, et al. Perfusion MRI using endogenous deoxyhemoglobin as a contrast agent: Preliminary data. Magnetic Resonance in Medicine. 2021;86(6):3012–3021. doi:10.1002/mrm.28974
4. Cox RW. AFNI: Software for Analysis and Visualization of Functional Magnetic Resonance Neuroimages. Computers and biomedical research. 1996;29(3):162–173. doi:10.1006/cbmr.1996.0014
5. Balaban DY, Duffin J, Preiss D, Mardimae A, Vesely A, Slessarev M, Zubieta-Calleja GR, Greene ER, MacLeod DB, Fisher JA. The in-vivo oxyhaemoglobin dissociation curve at sea level and high altitude. Respiratory physiology & neurobiology. 2013;186(1):45–52. doi:10.1016/j.resp.2012.12.011
6. Chappell MA, Mehndiratta A, Calamante F. Correcting for large vessel contamination in dynamic susceptibility contrast perfusion MRI by extension to a physiological model of the vasculature: Correcting Contamination in DSC Perfusion. Magnetic resonance in medicine. 2015;74(1):280–290. doi:10.1002/mrm.25390
7. Sobczyk O, Battisti-Charbonney A, Poublanc J, Crawley AP, Sam K, Fierstra J, Mandell DM, Mikulis DJ, Duffin J, Fisher JA. Assessing cerebrovascular reactivity abnormality by comparison to a reference atlas. Journal of cerebral blood flow and metabolism : official journal of the International Society of Cerebral Blood Flow and Metabolism. 2015;35(2):213–220. doi:10.1038/jcbfm.2014.184
8. Liebeskind DS. Collateral Circulation. Stroke. 2003;34(9):2279–2284. doi:10.1161/01.STR.0000086465.41263.06
9. Powers WJ. Cerebral hemodynamics in ischemic cerebrovascular disease. Annals of neurology. 1991;29(3):231–240. doi:10.1002/ana.410290302
Figures