2561
Impact of capillary transit time heterogeneity on resting-state BOLD-FC in patients with unilateral asymptomatic carotid artery stenosis1School of Medicine, Klinikum rechts der Isar, Department of Diagnostic and Interventional Neuroradiology, Technical University of Munich, Munich, Germany, 2School of Medicine, Klinikum rechts der Isar, TUM Neuroimaging Center, Technical University of Munich, Munich, Germany, 3Philips GmbH Market DACH, Hamburg, Germany, 4School of Medicine, Klinikum rechts der Isar, Department of Psychiatry, Technical University of Munich, Munich, Germany, 5School of Medicine, Klinikum rechts der Isar, Department of Vascular and Endovascular Surgery, Technical University of Munich, Munich, Germany, 6School of Medicine, Klinikum rechts der Isar, Department of Diagnostic and Interventional Neuroradiology, School of Medicine, Klinikum rechts der Isar, Department of Neurology, Munich, Germany
Synopsis
Blood oxygenation level dependent functional connectivity (BOLD-FC) is commonly used as a proxy for neuronal connectivity. Therefore, aberrant BOLD-FC in brain disorders is typically interpreted as aberrant neuronal connectivity. However, beyond changes in neuronal connectivity, impairments in neurovascular coupling (NVC) may also impact on BOLD-FC. This study investigates how impaired local NVC, under conditions of preserved neural functioning, influences BOLD-FC in a sample of unilateral asymptomatic internal carotid artery stenosis patients and healthy age-matched controls. We show that timing aspects of local NVC, namely increased capillary transit time heterogeneity, reduces BOLD-FC, without changes in neuronal functioning.
Introduction
Blood oxygenation level dependent functional connectivity (BOLD-FC) in the resting state is commonly used as an indicator of organized, coherent and functionally connected neuronal activity 1,2. Thus, altered BOLD-FC is commonly interpreted in terms of aberrant neuronal connectivity. Neurological and psychiatric diseases or even healthy aging, however, are often accompanied by hemodynamic-vascular impairments 3–8. By means of a BOLD-FC simulation model 9, we recently demonstrated critical influence of timing aspects of local neurovascular coupling (NVC) on BOLD-FC, in particular of delayed and broadened cerebral blood flow (CBF) response.In this study, we build on the idea that timing aspects of local blood flow response can be characterized by the capillary transit time heterogeneity (CTH) 10, 11, which has recently been found to be increased in asymptomatic patients with high-grade unilateral internal carotid artery stenosis (ICAS) 3. We hypothesized that increased CTH reduces BOLD-FC in a sample of unilateral ICAS patients and healthy controls.
Methods
To test this hypothesis, we analyzed multi-parametric hemodynamic MRI data from 28 asymptomatic ICAS patients and 27 age-matched healthy controls (median age in both groups: 71 years) from an existing cohort 3, 7. CTH 10, 11 and rCBV 16, 17 were derived from dynamic susceptibility contrast (DSC) MRI (see Fig. 1b ), CBF from pseudo-continuous arterial spin labeling (pCASL) MRI 18 (see Fig. 1c). BOLD-FC was calculated from multiband echo planar imaging (EPI) data (see Fig.1a) by correlating averaged VOI BOLD time courses between 192 left and right homotopic VOI pairs derived from the atlas of intrinsic connectivity of homotopic areas, AICHA 19. To investigate the influence of CTH, CBF and rCBV on BOLD-FC between the homotopic VOI pairs, absolute VOI difference values were extracted from the same VOIs, yielding |ΔCTH| [sec] = |CTHVOI-Left – CTHVOI-Right|, |ΔCBF| [ml/100g/min] = |CBFVOI-Left – CBFVOI-Right| and |ΔrCBV| [pp (percentage points)] = |rCBVVOI-Left – rCBVVOI-Right|. These differences were z-standardized to achieve an identical scale and range for all parameters.Statistical Analysis: The extent of NVC differences in ICAS patients and healthy controls was tested by comparing subjects’ mean BOLD-FC and mean NVC parameter differences across all VOIs between the groups by Welch’s t-tests. We used a linear-mixed regression model to predict the influence of pairwise NVC differences, in particular |ΔCTH|, |ΔCBF|, and |ΔrCBV|, on BOLD-FC. As further control variables, we added group affiliation and participant age 20, 21.
Results
Figure 2 demonstrates that ICAS patients and healthy controls did not differ in their average BOLD-FC (Fig. 2e) and |ΔrCBV| (Fig. 2g), but ICAS patients had significantly larger average |ΔCTH| (Fig. 2f) and |ΔCBF| (Fig. 2h) between VOI pairs. In support of our hypothesis, the regression model demonstrates that BOLD-FC decreases with increasing |ΔCTH| and |ΔCBF|, where the effect of CTH is significantly stronger (Fig. 3a versus 3c). For CTH, the decrease was -0.12 for each 1 σ (2.47 s; see Fig. 3a) across groups and for CBF -0.05 for each 1 σ (5.72 ml/100g/min; see Fig. 3c). In addition, the effect of CTH was significantly stronger for ICAS patients, -0.16 BOLD-FC decrease (see Fig. 3a right side), as compared to the healthy controls, -0.08 BOLD-FC decrease (see Fig. 3a, left side). Age only had a slight effect on the BOLD-FC decrease caused by |ΔCBF|.Discussion
Differences in CTH and CBF between homotopic VOI pairs lead to reductions in BOLD-FC, with CTH effects being significantly stronger than CBF effects. As neuronal function is preserved in asymptomatic ICAS patients, our results demonstrate that BOLD-FC reductions can be caused by local NVC aberrations. Concerning CTH, our finding fits previous simulation results, where BOLD-FC reductions are induced by altered CBF response timing, suggesting a correspondence between CTH and CBF response time changes 9. The observed effect of CTH was significantly stronger in ICAS patients as compared to the healthy controls, potentially explained by reduced cerebrovascular reserve capacity (CVR) in ICAS patients 3, as intact CVR is essential to facilitate adequate CBF response to neural activity 22–26. Concerning CBF, the detrimental effect of baseline CBF on BOLD-FC corroborates previous results linking blood flow to BOLD-FC 27–30.Conclusion
Our results demonstrate that BOLD-FC aberrations between homotopic brain areas can be caused by CTH increases. To aid interpretation of aberrant BOLD-FC in patient populations, we therefore propose to combine resting-state BOLD fMRI with multi-parametric hemodynamic MRI.Acknowledgements
We thank Kim van de Ven (Philips Healthcare, Best, Netherlands) for her support with the ASL imaging and Kim Mouridsen and Mikkel Bo Hansen (both Center of Functionally Integrative Neuroscience, Aarhus University, Aarhus, Denmark) for their supplying software and support for CTH processing.
References
1. Buckner, R. L., Krienen, F. M. & Yeo, B. T. T. Opportunities and limitations of intrinsic functional connectivity MRI. Nat Neurosci 16, 832–837 (2013).
2. Fox, M. D. & Raichle, M. E. Spontaneous fluctuations in brain activity observed with functional magnetic resonance imaging. Nature Reviews Neuroscience 8, 700–711 (2007).
3. Kaczmarz, S. et al. Hemodynamic impairments within individual watershed areas in asymptomatic carotid artery stenosis by multimodal MRI. J Cereb Blood Flow Metab 41, 380–396 (2021).
4. Preibisch, C. et al. Age-related cerebral perfusion changes in the parietal and temporal lobes measured by pulsed arterial spin labeling. Journal of Magnetic Resonance Imaging 34, 1295–1302 (2011).
5. Richter, V. et al. MR Imaging of Individual Perfusion Reorganization Using Superselective Pseudocontinuous Arterial Spin-Labeling in Patients with Complex Extracranial Steno-Occlusive Disease. AJNR Am J Neuroradiol 38, 703–711 (2017).
6. Riederer, I. et al. Alzheimer Disease and Mild Cognitive Impairment: Integrated Pulsed Arterial Spin-Labeling MRI and (18)F-FDG PET. Radiology 288, 198–206 (2018).
7. Göttler, J. et al. Reduced blood oxygenation level dependent connectivity is related to hypoperfusion in Alzheimer’s disease. J Cereb Blood Flow Metab 39, 1314–1325 (2019).
8. West, K. L. et al. BOLD hemodynamic response function changes significantly with healthy aging. NeuroImage 188, 198–207 (2019).
9. Archila-Meléndez, M. E., Sorg, C. & Preibisch, C. Modeling the impact of neurovascular coupling impairments on BOLD-based functional connectivity at rest. NeuroImage 218, 116871 (2020).
10. Jespersen, S. N. & Østergaard, L. The Roles of Cerebral Blood Flow, Capillary Transit Time Heterogeneity, and Oxygen Tension in Brain Oxygenation and Metabolism. J Cereb Blood Flow Metab 32, 264–277 (2012).
11. Mouridsen, K., Hansen, M. B., Østergaard, L. & Jespersen, S. N. Reliable estimation of capillary transit time distributions using DSC-MRI. J Cereb Blood Flow Metab 34, 1511–1521 (2014).
12. Christen, T. et al. Noncontrast mapping of arterial delay and functional connectivity using resting-state functional MRI: A study in Moyamoya patients: Maps of Arterial Delay Using BOLD Signal. J. Magn. Reson. Imaging 41, 424–430 (2015).
13. Erdoğan, S. B., Tong, Y., Hocke, L. M., Lindsey, K. P. & deB Frederick, B. Correcting for Blood Arrival Time in Global Mean Regression Enhances Functional Connectivity Analysis of Resting State fMRI-BOLD Signals. Front. Hum. Neurosci. 10, (2016).
14. Jahanian, H., Christen, T., Moseley, M. E. & Zaharchuk, G. Erroneous Resting-State fMRI Connectivity Maps Due to Prolonged Arterial Arrival Time and How to Fix Them. Brain Connectivity 8, 362–370 (2018).
15. Siegel, J. S., Snyder, A. Z., Ramsey, L., Shulman, G. L. & Corbetta, M. The effects of hemodynamic lag on functional connectivity and behavior after stroke. J Cereb Blood Flow Metab 36, 2162–2176 (2016).
16. Kluge, A. et al. Analysis of three leakage-correction methods for DSC-based measurement of relative cerebral blood volume with respect to heterogeneity in human gliomas. Magn Reson Imaging 34, 410–421 (2016).
17. Hedderich, D. et al. Consistency of normalized cerebral blood volume values in glioblastoma using different leakage correction algorithms on dynamic susceptibility contrast magnetic resonance imaging data without and with preload. J Neuroradiol 46, 44–51 (2019).
18. Alsop, D. C. et al. Recommended implementation of arterial spin-labeled perfusion MRI for clinical applications: A consensus of the ISMRM perfusion study group and the European consortium for ASL in dementia. Magn Reson Med 73, 102–116 (2015).
19. Joliot, M. et al. AICHA: An atlas of intrinsic connectivity of homotopic areas. Journal of Neuroscience Methods 254, 46–59 (2015).
20. Bates, D., Mächler, M., Bolker, B. & Walker, S. Fitting Linear Mixed-Effects Models Using lme4. Journal of Statistical Software 67, 1–48 (2015).
21. Kuznetsova, A., Brockhoff, P. B. & Christensen, R. H. B. lmerTest Package: Tests in Linear Mixed Effects Models. Journal of Statistical Software 82, 1–26 (2017).
22. De Vis, J. B., Bhogal, A. A., Hendrikse, J., Petersen, E. T. & Siero, J. C. W. Effect sizes of BOLD CVR, resting-state signal fluctuations and time delay measures for the assessment of hemodynamic impairment in carotid occlusion patients. Neuroimage 179, 530–539 (2018).
23. D’Esposito, M., Deouell, L. Y. & Gazzaley, A. Alterations in the BOLD fMRI signal with ageing and disease: a challenge for neuroimaging. Nat Rev Neurosci 4, 863–872 (2003).
24. Lewis, N. et al. Static and dynamic functional connectivity analysis of cerebrovascular reactivity: An fMRI study. Brain Behav 10, e01516 (2020).
25. Mark, C. I., Mazerolle, E. L. & Chen, J. J. Metabolic and vascular origins of the BOLD effect: Implications for imaging pathology and resting-state brain function: Understanding BOLD in Disease and Rest. J. Magn. Reson. Imaging 42, 231–246 (2015).
26. van Niftrik, C. H. B. et al. The voxel-wise analysis of false negative fMRI activation in regions of provoked impaired cerebrovascular reactivity. PLOS ONE 14, e0215294 (2019).
27. Champagne, A. A. et al. Multi-modal normalization of resting-state using local physiology reduces changes in functional connectivity patterns observed in mTBI patients. Neuroimage Clin 26, 102204–102204 (2020).
28. Li, Z., Zhu, Y., Childress, A. R., Detre, J. A. & Wang, Z. Relations between BOLD fMRI-derived resting brain activity and cerebral blood flow. PLoS One 7, e44556 (2012).
29. Liang, X., Zou, Q., He, Y. & Yang, Y. Coupling of functional connectivity and regional cerebral blood flow reveals a physiological basis for network hubs of the human brain. Proc Natl Acad Sci U S A 110, 1929–1934 (2013).
30. Qiu, M., Scheinost, D., Ramani, R. & Constable, R. T. Multi-modal analysis of functional connectivity and cerebral blood flow reveals shared and unique effects of propofol in large-scale brain networks. Neuroimage 148, 130–140 (2017).
Figures
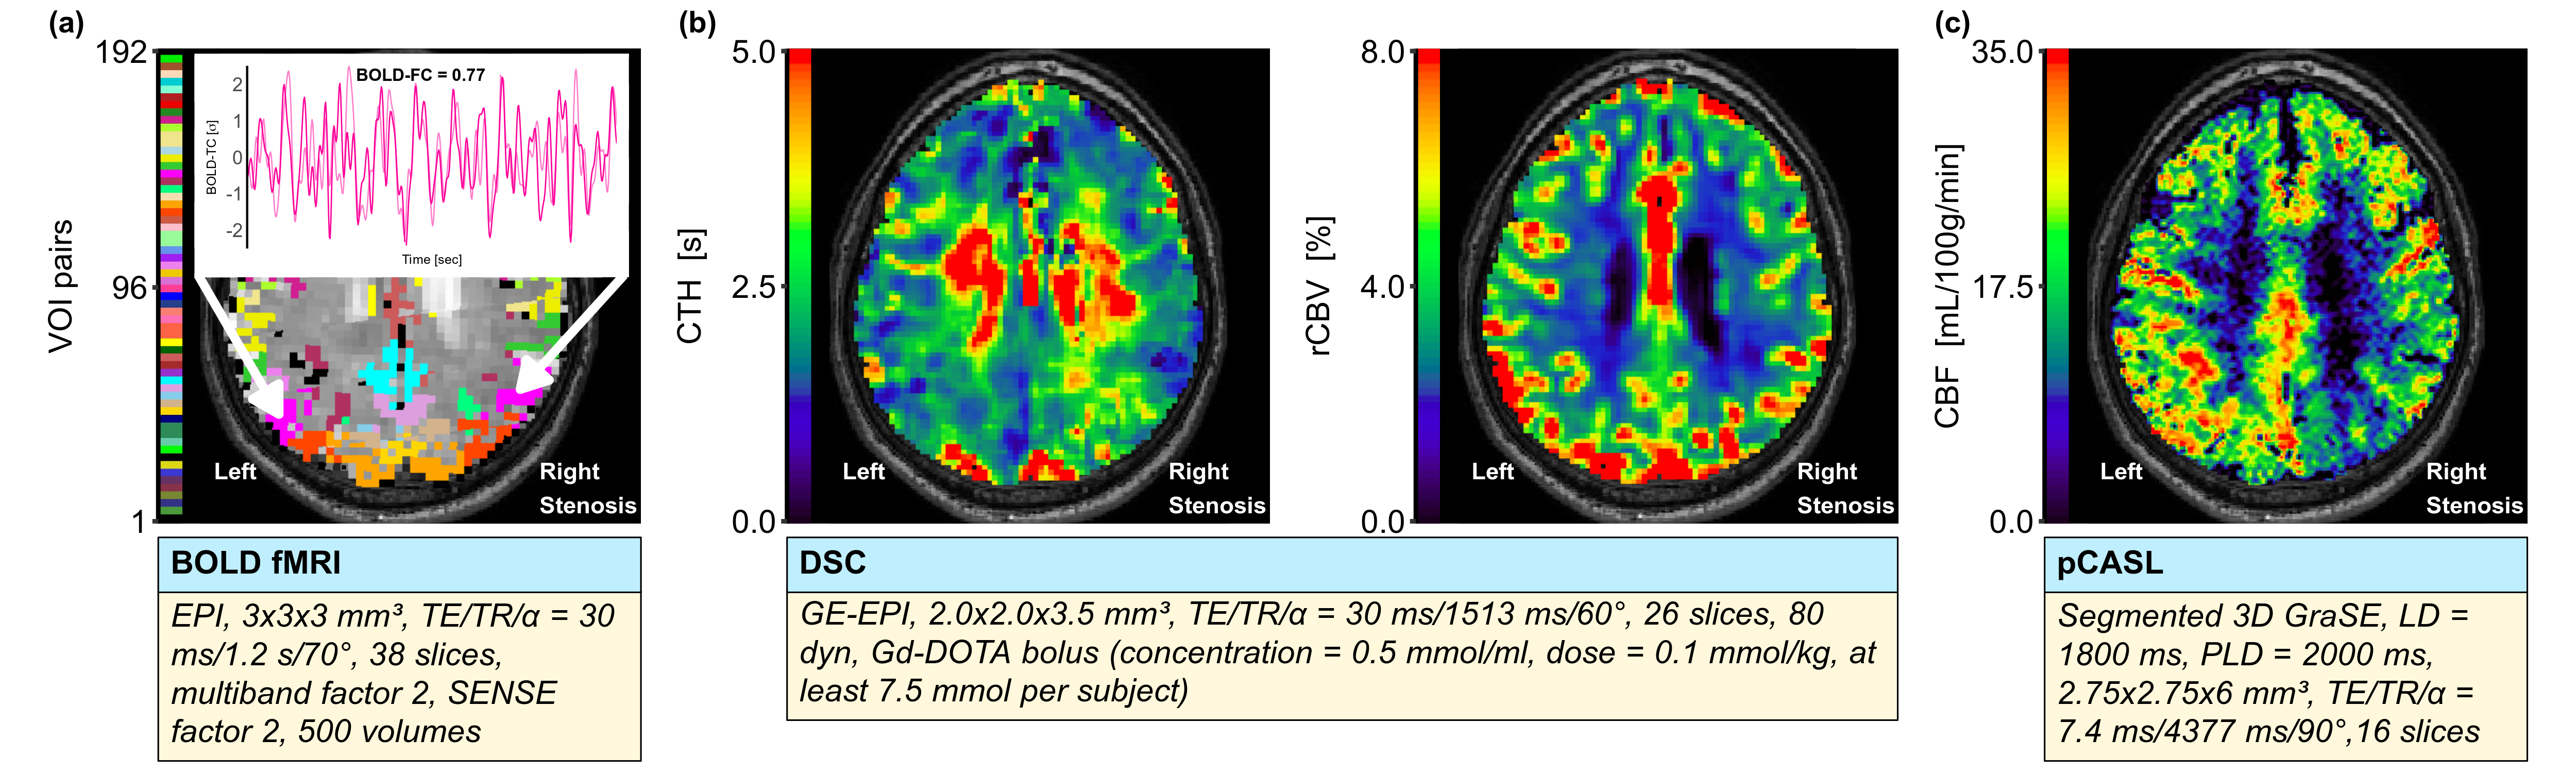
AICHA VOIs (a) and exemplary NVC parameter maps of one ICAS patient with respective sequence parameters (b-c). Brain parcellation according to the AICHA atlas with an insert depicting two exemplary BOLD time courses of homotopic regions, whose Pearson’s correlation (Fisher-Z transformed) reflects homotopic BOLD-FC (a), exemplary parameter maps of CTH (b - left), rCBV (b - right) and CBF (c) for a selected slice of an ICAS patient with a right-sided stenosis.
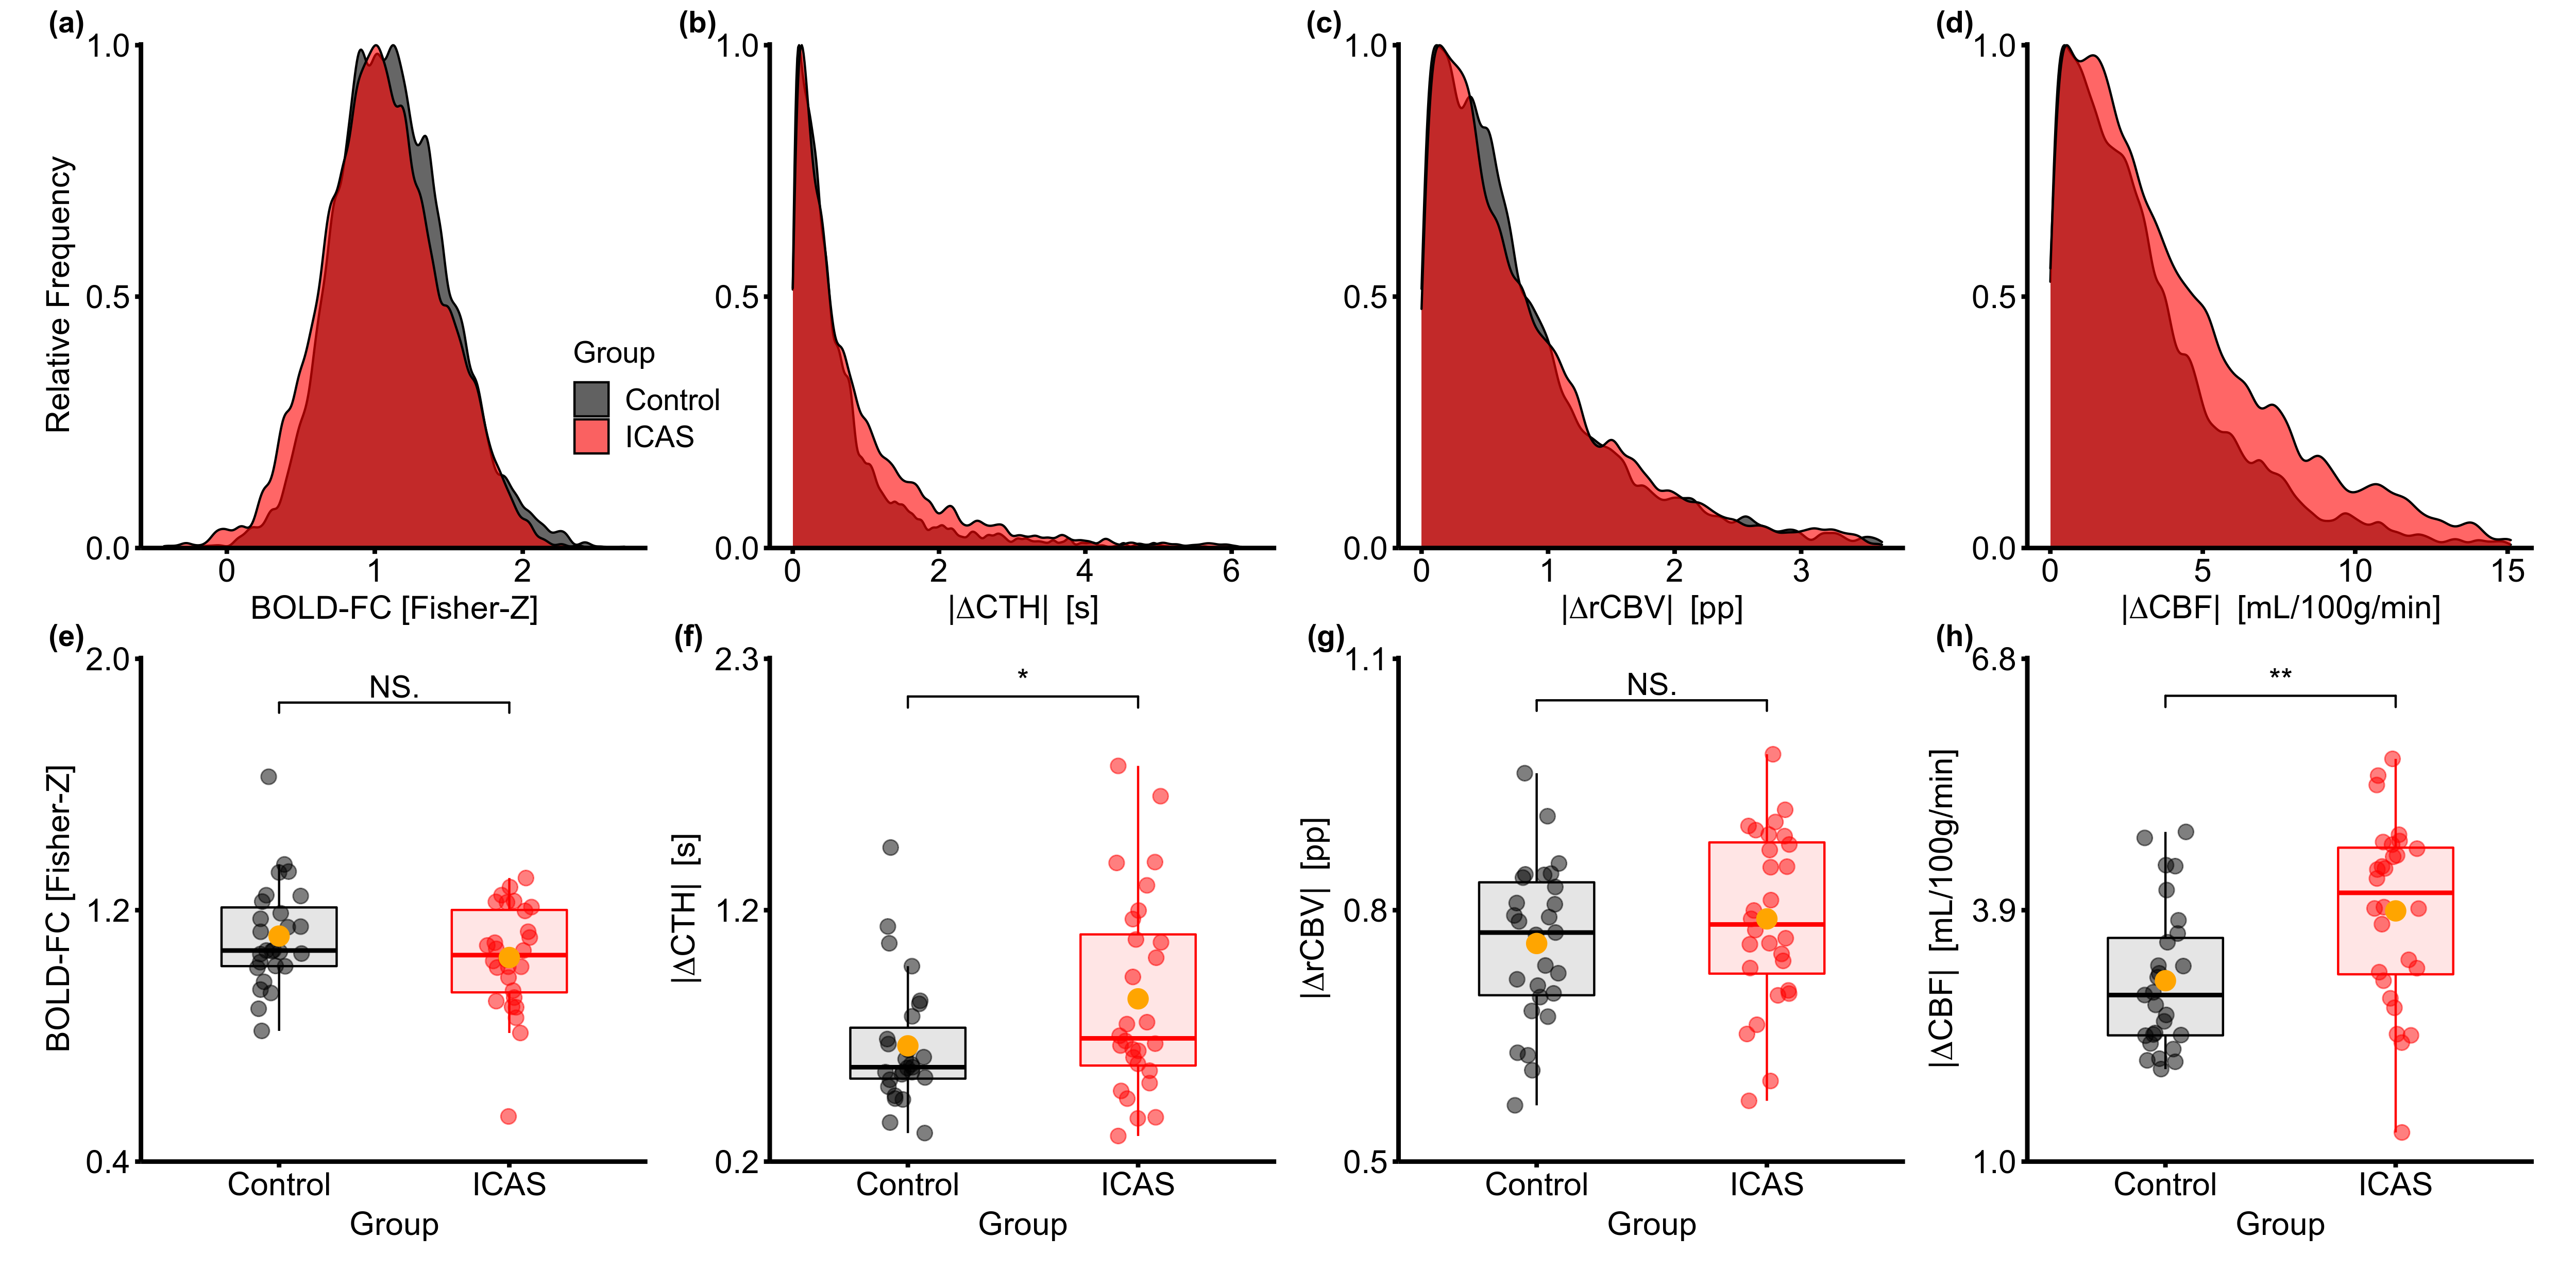
Sample distributions (a-d) and group differences (e-h) in BOLD-FC and NVC parameters. Frequency distributions across all VOI pairs of healthy controls and ICAS patients (a-d). Dots in panels (e) to (f) represent participants’ average values. Thick horizontal bars indicate median values. Orange dots indicate group mean. Differences were examined with Welch’s t-test, significance is indicated with asterisks (* for p < 0.05, ** for p < 0.01), non-significance with NS.
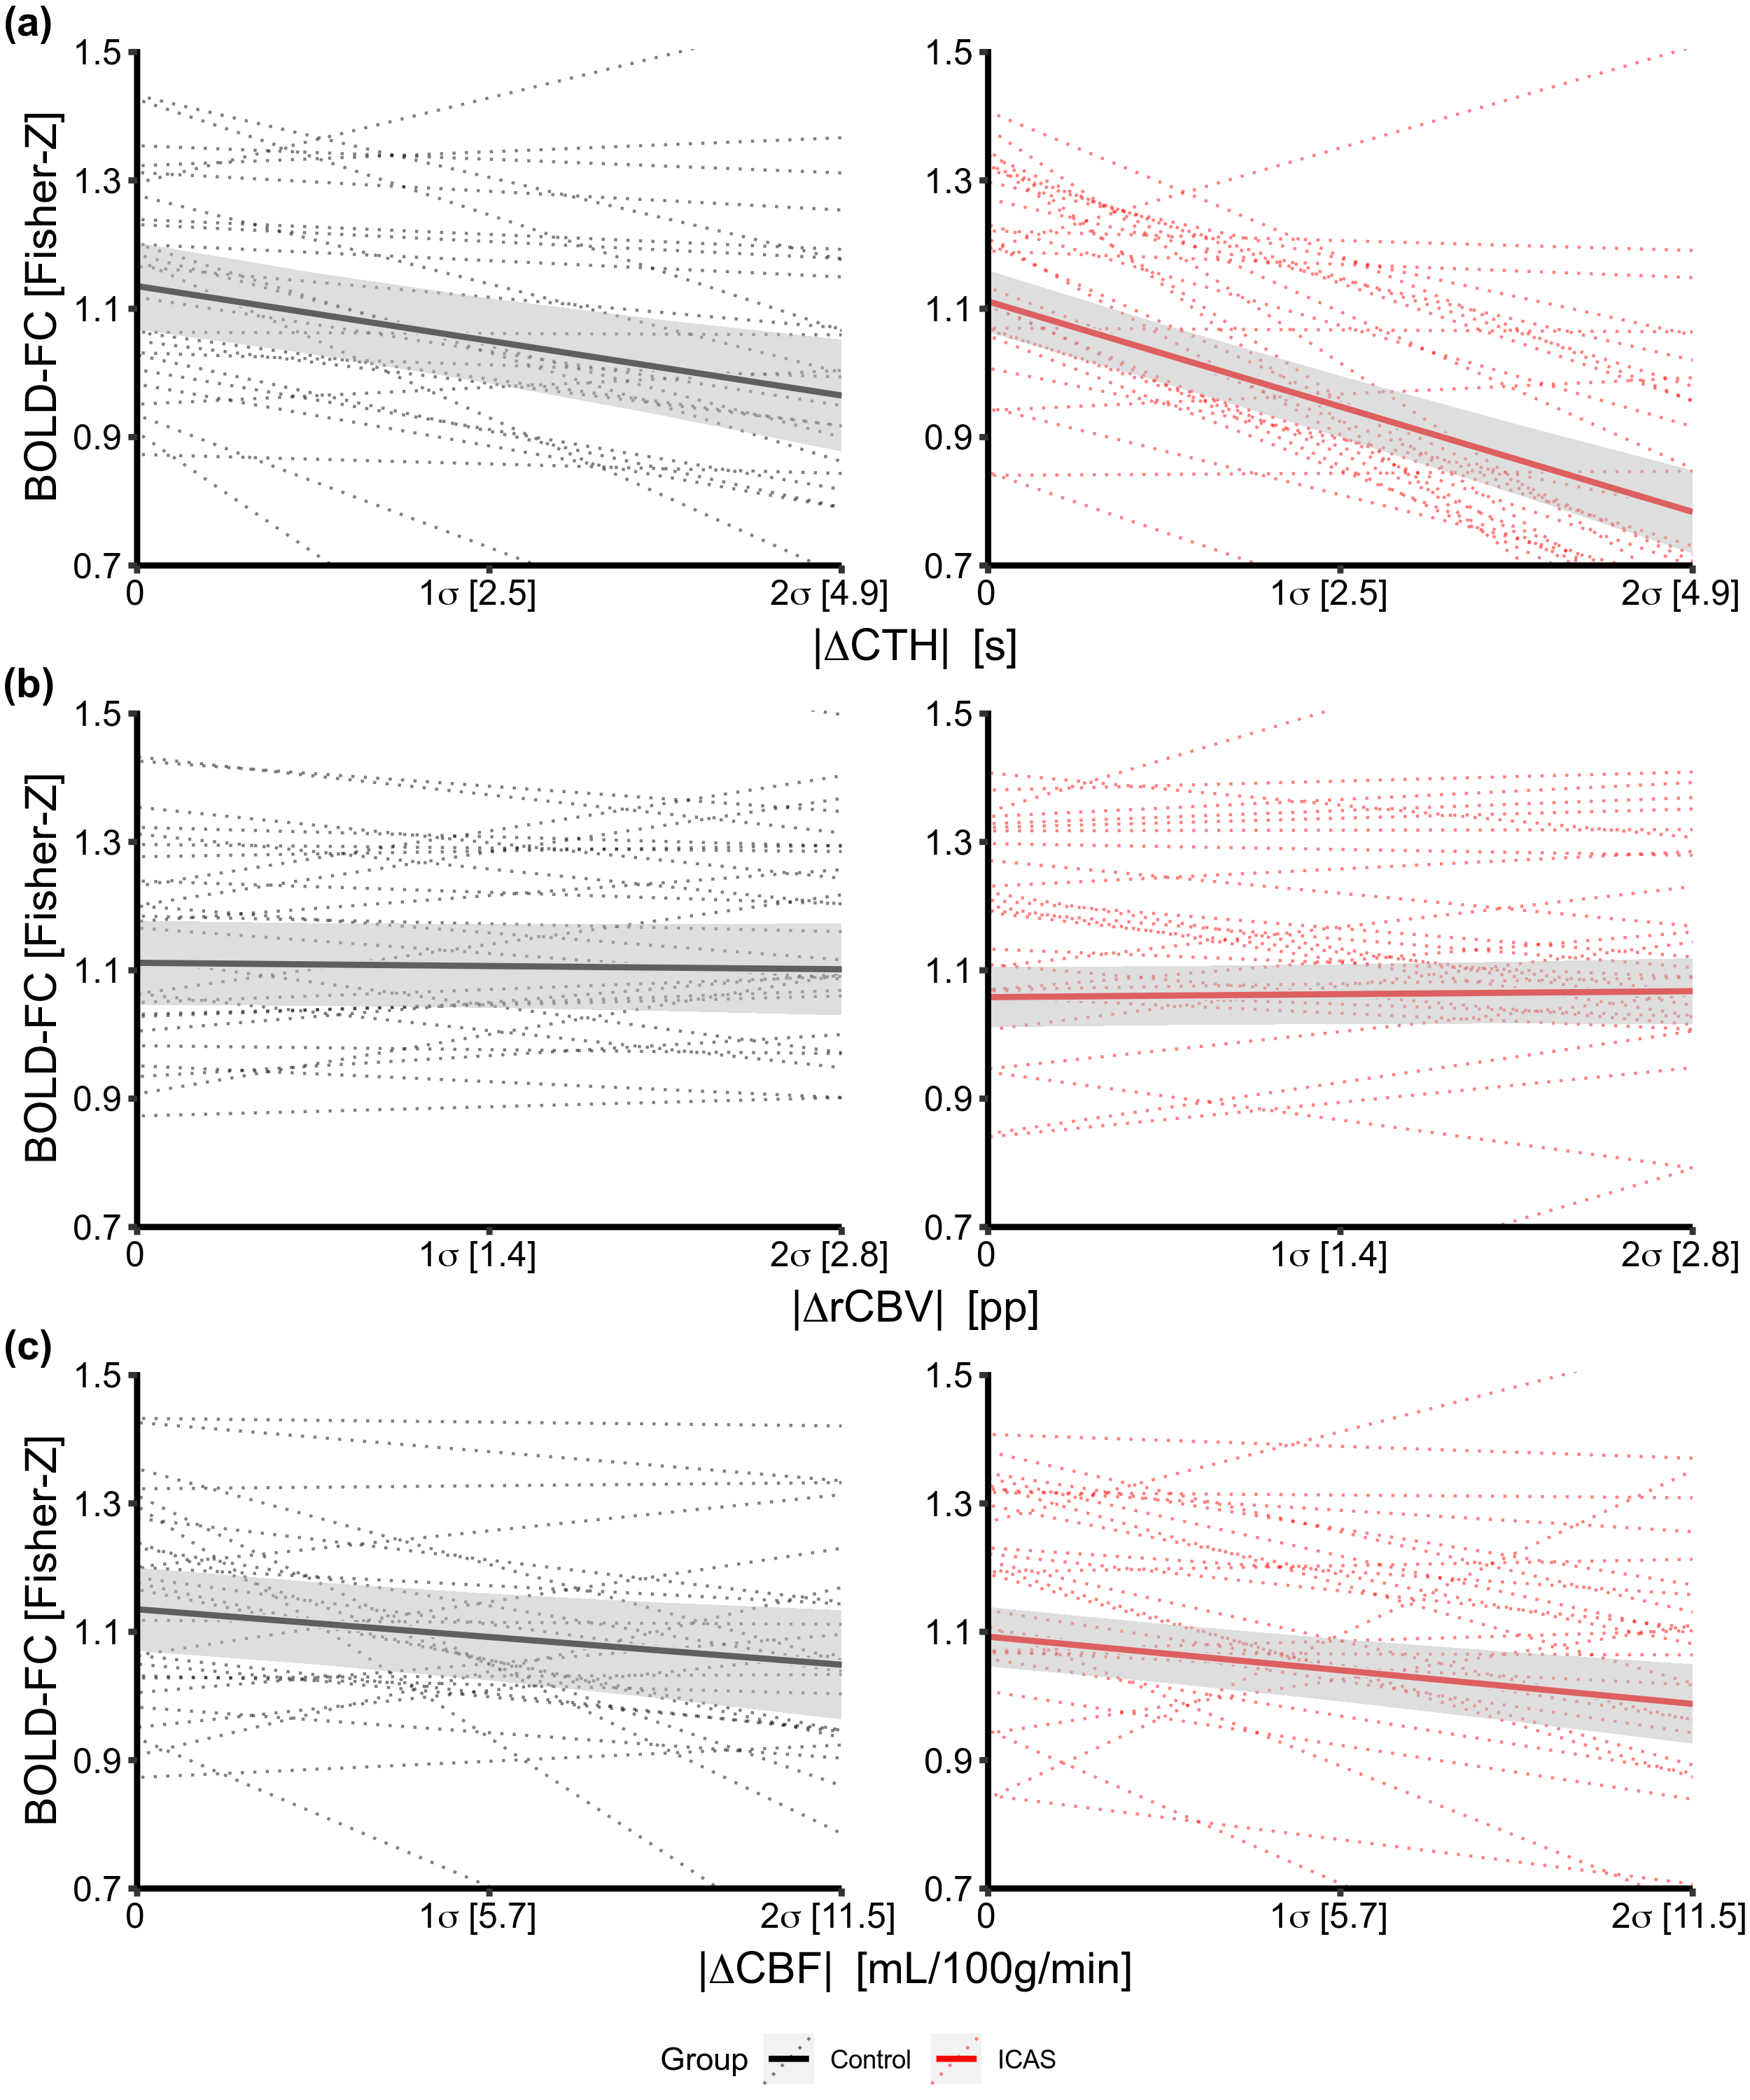
Effects of NVC parameters on BOLD-FC. Slopes indicate predicted changes in BOLD-FC (y-axis) with increasing |ΔCTH| (a), |ΔrCBV| (b) and |ΔCBF| (c) between pairwise VOIs for asymptomatic ICAS patients (red) and controls (black) on group (solid lines) and individual level (dotted lines), respectively. Shaded areas indicate 95% confidence interval of slopes. The x-axis indicates the data range in standard deviations (σ). Two participants with extremely high and low intercepts lie outside the depicted data range.