2552
Variability of the specific absorption rate in the child’s head using a transmit array head coil at 7T: a simulation study
Maya Delbany1, Michel Luong1,2, Laurent Morel3, Jean-Pierre Adam3, Jean-Christophe Joly3, and Vincent Gras1
1Université Paris-Saclay, CEA, CNRS, BAOBAB, NeuroSpin, 91191, Gif sur Yvette, France, 2CEA, DRF, IRFU, Gif sur Yvette, France, 3CEA, DAM, Gramat, France
1Université Paris-Saclay, CEA, CNRS, BAOBAB, NeuroSpin, 91191, Gif sur Yvette, France, 2CEA, DRF, IRFU, Gif sur Yvette, France, 3CEA, DAM, Gramat, France
Synopsis
In this study, a 3T MRI database is used to create numerical children’s head models in order to study the variability of the specific absorption rate in the head of children at 7T using a transmit array head coil. These numerical models are integrated in a homemade multi-transmit RF coil model and then used to simulate SAR maps in the head using a finite difference time domain solver called GORF.
INTRODUCTION:
Due to their smaller body size and a lack of knowledge of their RF exposure, children under 30kg are not allowed to undergo 7T MRI test using commercial RF coils. When using pTX, it is not uncommon that further restriction on patient age (age > 14y) must be observed. To gain knowledge of the risk associated with 7T head scans in pTX, we present a simulation study of the specific absorption rate (SAR) of 7T MRI. A database of 3T T1-weighed images of more than 100 children aged from 4 to 14 years is used for that purpose to construct a collection of anatomical head models able to sample the variability of the head morphology of the entire population. This study uses the so-called Avanti2 TX array model, a home-made transceiver array made of 15 dipoles, arranged in two rows (the inferior row contains only 7 dipoles to leave an aperture in front of the eyes to enable vision), and a “patch” antenna placed on the top of the head. Electromagnetic simulations are performed using the finite difference solver GORF of CEA/DAM.METHOD:
Body model: Based on T1-weighed images, the numerical model (NM) of each child is obtained via semi-automatic tissue classification procedure developed for the purpose of this project, and which defines the 9 compartments provided in Table 1, to which we assigned reference relative and dielectric permittivity values. To present to the head coil a correct load (Wolf et al1) a standard bust was added to the model. This was achieved by connecting the bust of the Thelonius model (full body model of 6 years-old boy) of ITIS2 to our head model (figure 1) using a 5-parameters (rotations + translations + scaling) supervised registration.The obtained NM was finally integrated into the homemade Avanti2 RF coil model by ensuring that the center of the brain was position at the center of the coil.
RF simulation: 16 different SAR simulations were performed, each one corresponding to a new NM of the head (see Table 2). These were performed using GORF (DAM/CEA, Gramat, France) on COBALT, a cluster provided by the CCRT (www-ccrt.cea.fr). The electric field (E) maps normalized to 1W transmitted RF power obtained for each RF resonator (16 complex 3D maps in total) were processed in order to compute 10g-Q matrices3. This way, given a RF excitation vector $$$\mathrm{\mathbf{V}}\in\mathbb{C}^{16{\times}1}$$$, the local SAR average over 10g of contiguous tissue in a given voxel $$$r$$$ is simply given by the matrix product $$$\mathrm{\mathbf{V}}^{\star}\mathbf{Q}_{10g}(r)\mathbf{V}$$$. In each voxel, an eigenvalue decomposition of the 10g-SAR matrix was performed to identify the maximal eigenvalue (the spectral norm of the matrix) and the associated eigenvector. This value corresponds to the maximal local SAR that can be achieved at the considered location for 1W total input power. In this preliminary work, the variability of the SAR was studied in the light of the variability of the worst-case SAR map (SARwc).
RESULTS:
The worst case 10g-SAR distributions in sagittal view of the 16 children and the associated histograms are displayed in Figure 2 and 3. The oldest child (14 year-old) had a maximum SARwc higher than 5 W/kg. A subject of 9 year-old had the minimum SARwc (2.12 W/kg). Figure 4 shows that there is no correlation between Max SARwc and age nor weight.DISCUSSION:
In ref 4, a “reduced” Duke Model was proposed, in which only 4 compartments (fat, soft tissues, internal air, and bone) were distinguished. In this work, it was suggested that this level of detail was sufficient to enable correct SAR map estimations. The number of compartments used in this work thus was deemed sufficient to study the variability of the SAR for children head scans in pTX. On the other hand, the major difficulty encountered was the segmentation process based on the T1 contrast only, as this contrast alone does not allow for a discrimination between bone, internal air and CSF shown without morphological prior. This justified the need for a supervised segmentation of the head.Our results show a variability in distributions of worst-case 10g-SAR in this pediatric population, also a difference among the maximums of worst-case 10g-SAR for the same ages.
The proposed methodology (definition of a database of NMs and extensive simulations) could be considered as a reference to calculate the SAR of different RF coil configurations to allow it to be used in pediatric clinical applications.
CONCLUSION and PERSPECTIVES:
This preliminary result demonstrates the efficiency of “GORF” to calculate SAR of large population with high resolution.Future work will concentrate on extending the database to 100 subjects to enable reliable evaluation of the variability of the SAR. The worst-case SAR metric is interesting as it allows reducing the dimensionality of the problem. However, addressing directly the risk of exceeding a local SAR threshold, given a set of virtual observation points5, and defining a set of suitable VOPs to ensure patient safety is the ultimate goal. Investigating, the influence of the head position or the variability of the tissue electric properties on SAR in the coil, is also an interesting prospect.
Acknowledgements
No acknowledgement found.References
1Wolf, et al., https://doi.org/10.1002/mrm.24329
2Itis REFERENCE., https://itis.swiss/virtual-population/virtual-population/vip2/thelonious/
3Graesslin, et al., https://doi.org/10.1002/mrm.24138
4Milshteyn, et al., https://doi.org/10.1002/mrm.28398
5Eichfelder, et al., https://doi:10.1002/mrm.22927.
6Gabriel, C., https://doi:10.21236/ADA303903.
Figures
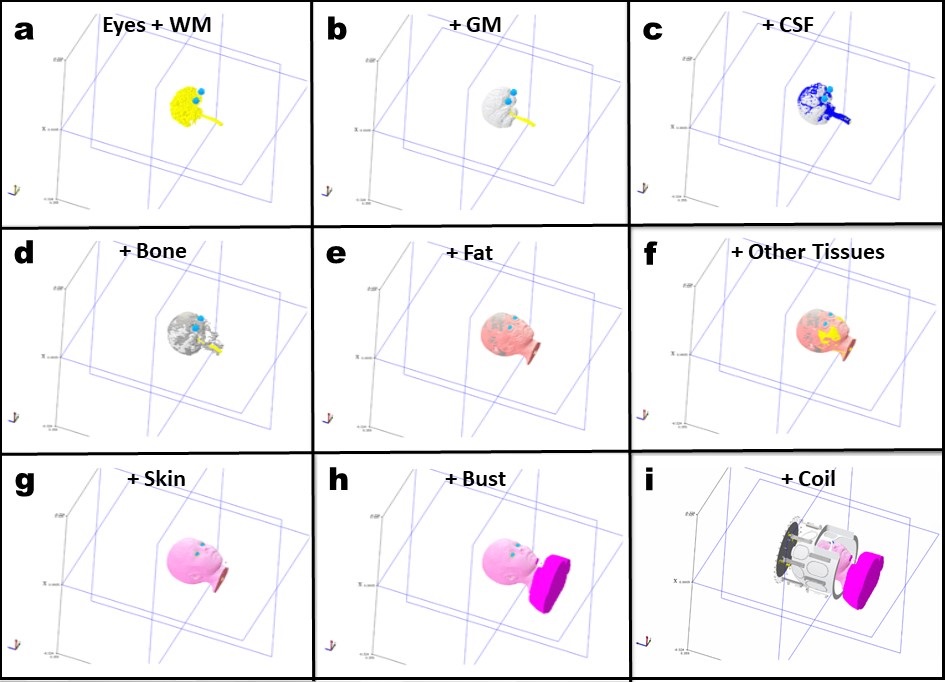
Figure 1: The segmentation of child head
containing 8 compartments a) eyes and white matter (WM), b) grey matter (GM),
c) cerebrospinal (CSF), d) bone, e) fat, f) other tissues containing muscles,
g) skin, h) bust and i) the coil.
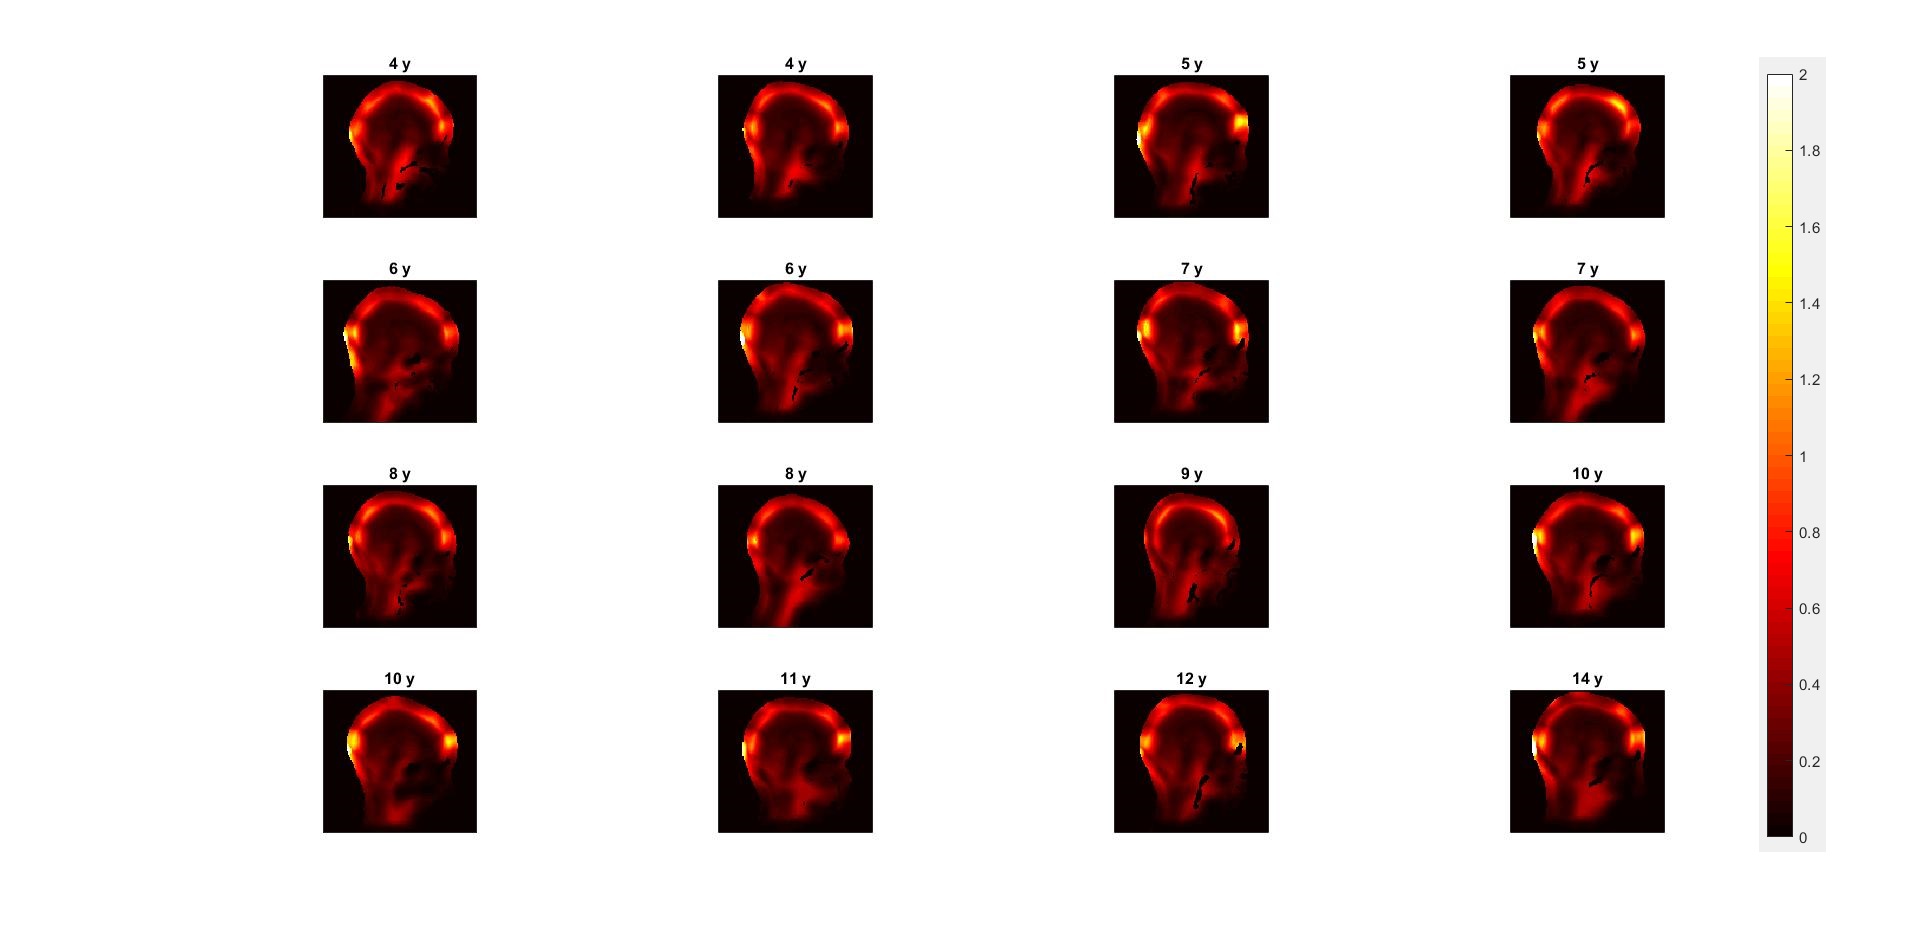
Figure 2: Worst-case 10g-SAR distributions of
16 children with different age in sagittal view.
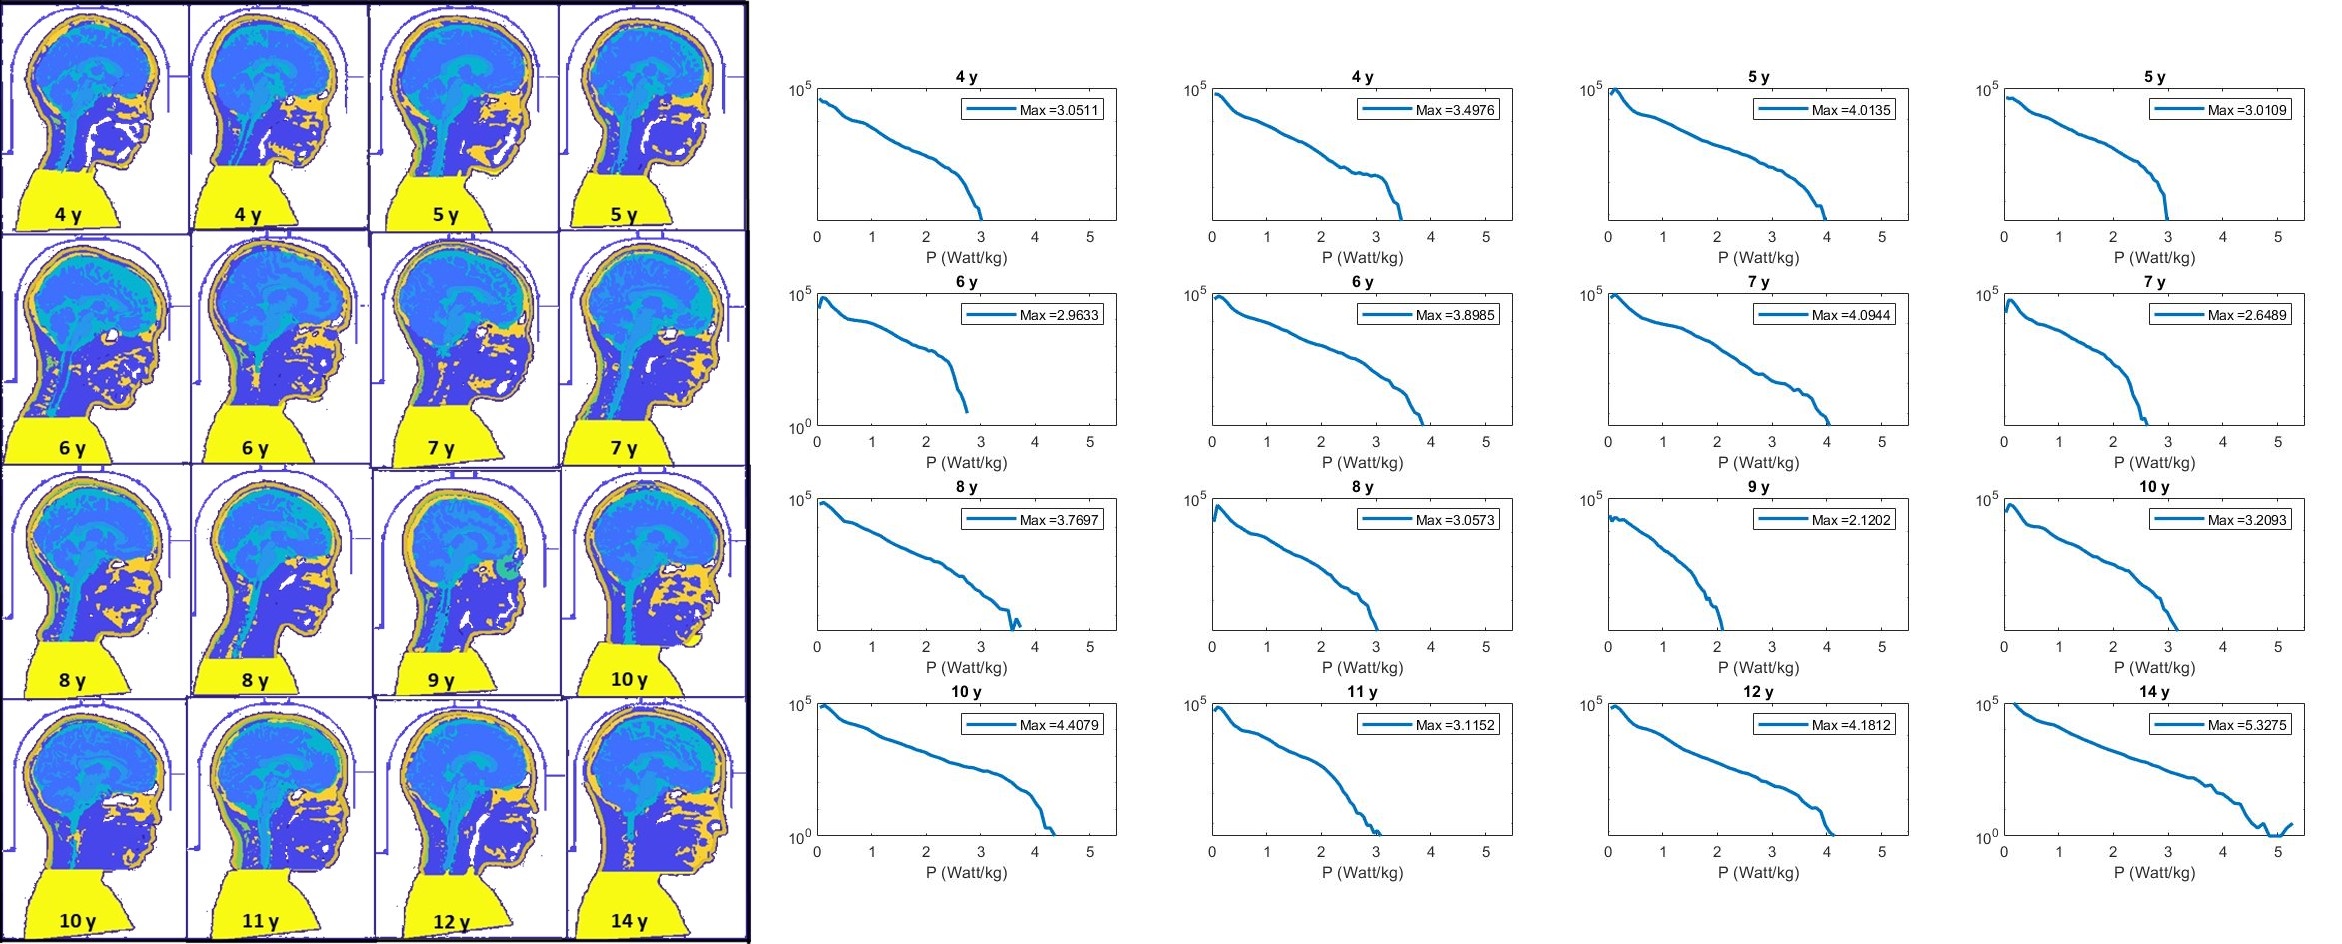
Figure 3: left: head and bust position of each child in
the coil (note the section of the helmet separating the head from the coil’s
conductors), right: and histograms of each child represented in figure 2
indicate the maximum value of worst-case 10g-SAR values.
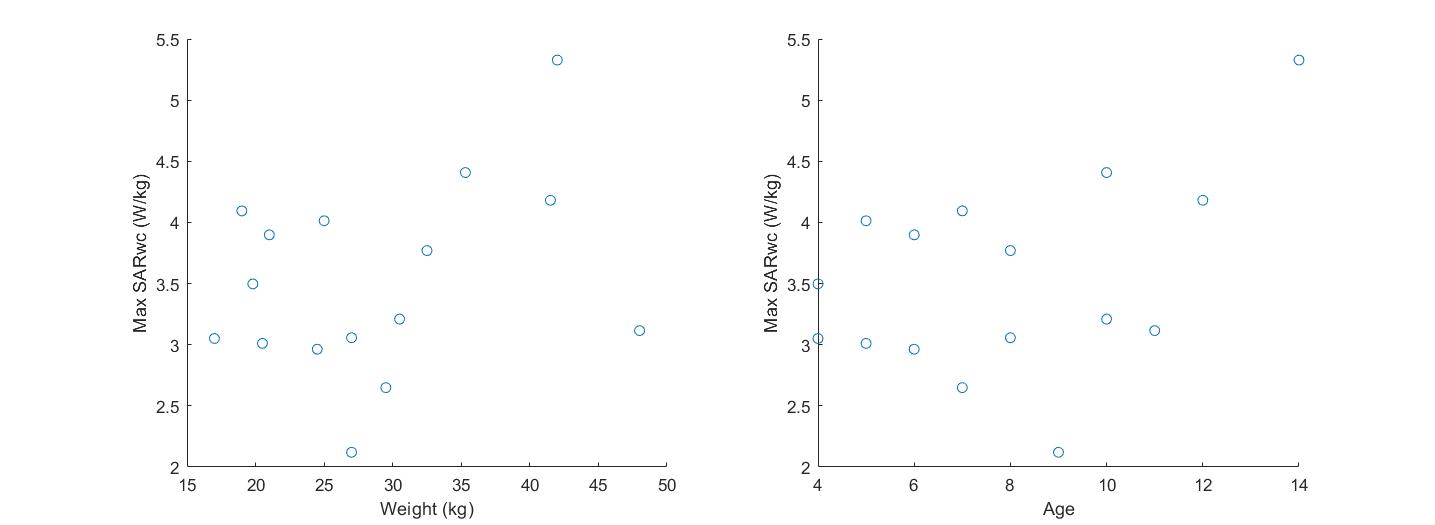
Figure 4: left: variation of Max SARwc depending
on weight, right: variation of Max SARwc depending on age.
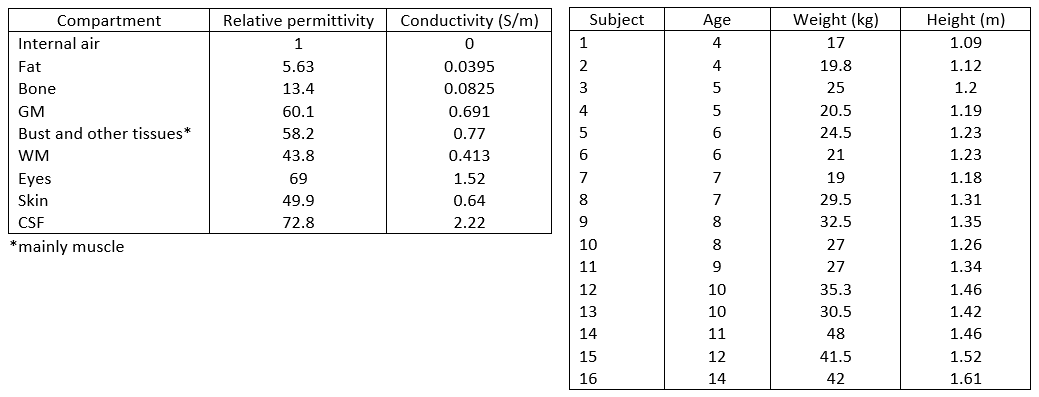
Left:
Table 1. Permittivity value and conductivity for the compartments of the
numerical models. Dielectric properties were obtained from ref 6. Right: Table
2. Age, weight and height of the 16 children of the database.
DOI: https://doi.org/10.58530/2022/2552