2548
Correction Factor for EPT-based Patient-Specific SAR Maps1Advanced Materials Metrology and Life Science, Istituto Nazionale di Ricerca Metrologica, Torino, Italy
Synopsis
Specific absorption rate (SAR) values can be obtained using MRI data to calculate the electrical conductivity via Electric Properties Tomography (EPT) and by indirectly obtaining the electric field by the B1+ field. However, only using B1+ will result in incorrect SAR values. In this work, we propose the calculation of a tissue-specific correction factor to mitigate the inaccuracy of SAR.
Introduction
Magnetic Resonance-based Electric Properties Tomography (EPT) techniques can calculate tissue electric properties, such as electrical conductivity, in vivo [1]. Thus, EPT can be used to estimate the electrical conductivity necessary to calculate the patient’s specific absorption rate (SAR) [2,3]. SAR is used as a reference for estimating energy absorption for monitoring patient safety [4]. SAR depends on the electrical conductivity and to the square of the RF electric field. In MRI, the electric field can be obtained indirectly by measuring the B1 field. However, the MRI scanner can only measure the component of the B1 field that rotates in the same direction as nuclear precession (B1+).Because SAR depends on the whole B1 field (B1+, B1- and Bz), calculated SAR using MRI data only, will differ from simulation-based SAR. Herein, we sought to preliminary evaluate if the data from MRI can be simply corrected to obtain accurate SAR maps. Therefore, the objective of this work is to propose the calculation of a correction factor to compensate for possible SAR differences to simulated values.
Methods
Tissue-specific correction factors were empirically obtained by applying a ratio of reference to estimated SAR maps. Noiseless complex values of the B1+ and the electric field were obtained from whole-head electromagnetic simulations at 128 MHz, performed with homemade software applied on 27 head models with 48 tissue compartments obtained from the ViP [5,6] and the XCAT [7] collections.The reference SAR maps (Ground Truth) were obtained using the whole electric field components and the known electrical conductivity, whereas the estimated SAR maps were calculated from the electric field derived by applying Ampere’s law to the B1 field (assuming as null all the components except the B1+) and the reconstructed electrical properties using the convection-reaction EPT approach implemented in EPTlib [8]. The corrected data were obtained by multiplying the estimated SAR values by their corresponding tissue-specific correction factors.
Correction factors for gray matter, white matter, and cerebrospinal fluid (CSF) were obtained by taking the mean value across the whole head of all models, as summarized in Fig. 1. To analyze maximum SAR values, correction factors for 10-g SAR maps were additionally computed.
Results
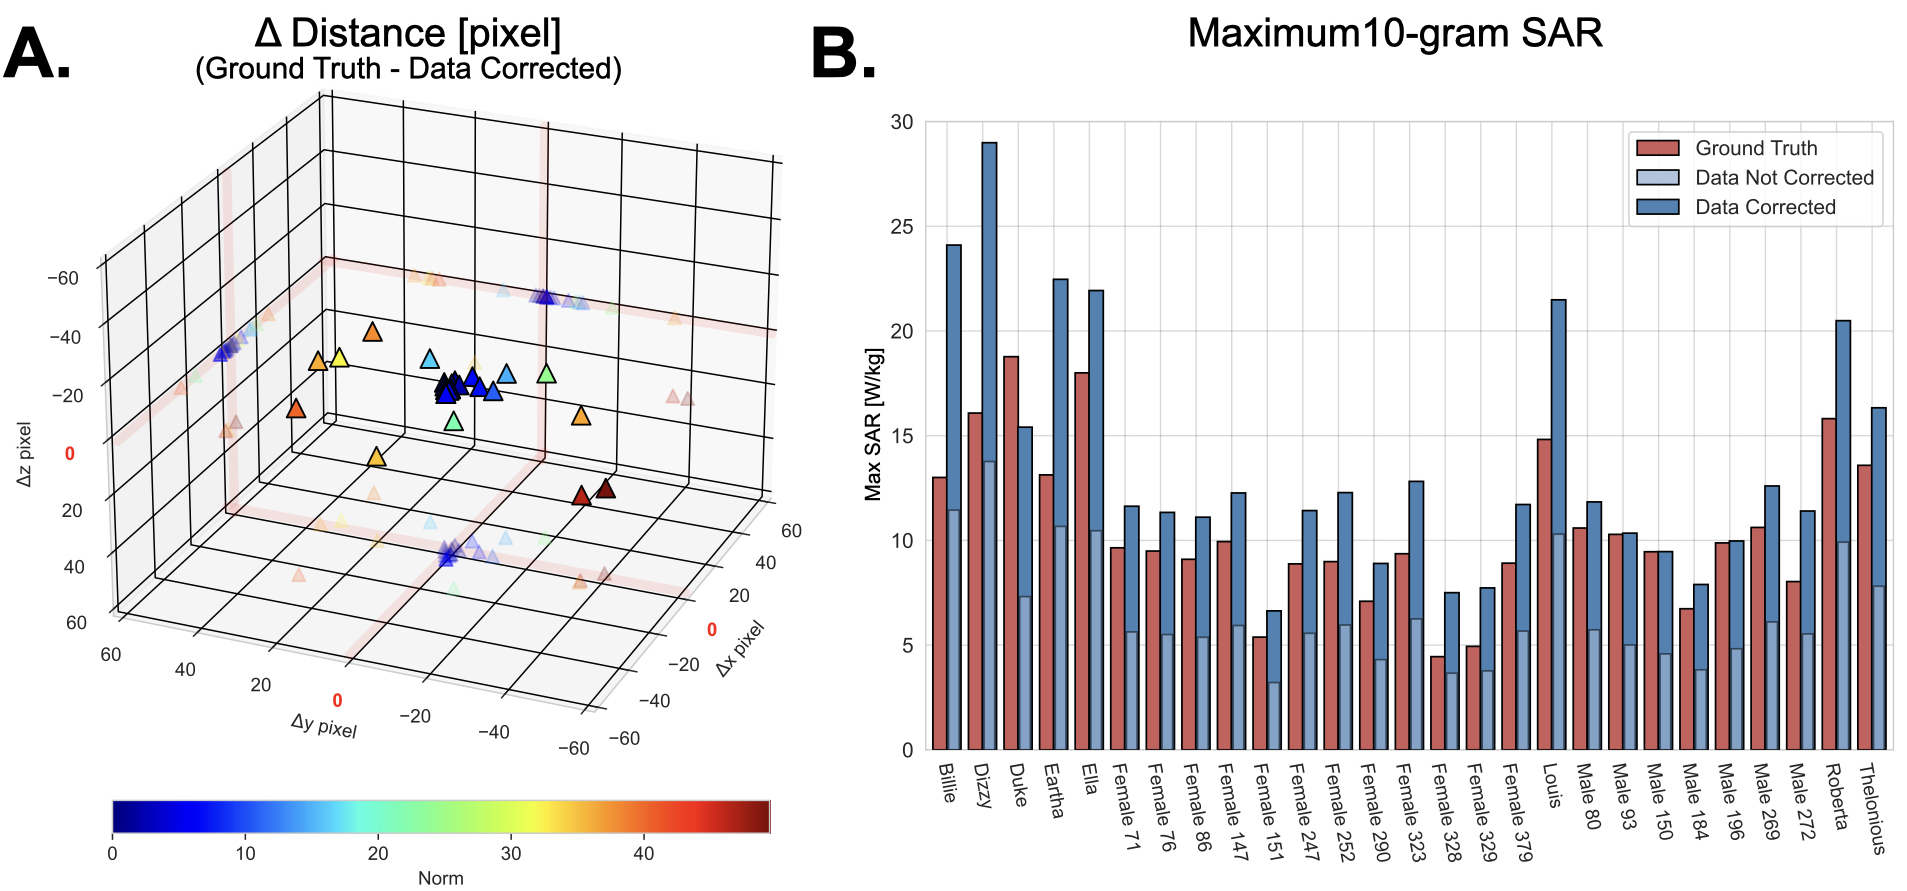
Correction factor values for SAR and 10-g SAR are reported in Table 1. For 10-g SAR, the obtained correction factor was found to be tissue independent, thus only one correction factor was obtained. Simulated SAR and 10-g SAR maps for a single case are shown in Fig. 2. Fig. 3. shows the distributions of the mean SAR values across models for gray matter, white matter, and CSF. The not-corrected data were found to be lower compared to the Ground Truth value (median [IQR]= 1.7 [0.4] W/kg vs. 4.2 [2.2] W/kg). Nonetheless, after correction, SAR values fell within the same range as the Ground Truth (median [IQR]= 4.2 [2.1] W/kg vs. 4.2 [2.2] W/kg).Maximum 10-g SAR results are summarized in Fig. 4. Fig. 4-A shows the position change analysis of the maximum 10-g SAR for the corrected data with respect to the Ground Truth. Compared to the Ground Truth, only three models showed a maximum 10-g SAR value located at a different z-slice (Dizzy, Duke, Ella from ViP). However, for the remaining 24 models, maximum 10-g SAR values were observed to be in the same z-slice (distance from Ground Truth, median [IQR] = 7.1 [29.9] pixels). Fig. 4-B shows maximum 10-g SAR values per model. Overall, 10-g SAR values for the not corrected data were always lower compared to the Ground Truth (median [IQR] = 5.7 [2.6] W/kg vs. 9.6 [4.2] W/kg). On the other hand, after correction 10-g SAR values were found greater than the Ground Truth (median [IQR] = 11.7 [5.7] W/kg vs. 9.6 [4.2] W/kg).
Conclusion
Results presented herein suggest that SAR maps calculated from B1+maps can be corrected by applying a tissue-dependent correction factor. Corrected SAR maps were equivalent to the Ground Truth maps. However, corrected maximum 10-g SAR values resulted in greater values than the Ground Truth. Future work needs to be performed to analyze the applicability in vivo and to find a more accurate method to correct the maximum 10-g SAR.Acknowledgements
The results here presented have been developed in the framework of the 18HLT05 QUIERO project. This project has received funding from the EMPIR programme co-financed by the Participating States and from the European Union’s Horizon 2020 research and innovation programme.References
Liu J, Wang Y, Katscher U, He B. Electrical Properties Tomography Based on $B_{{1}}$ Maps in MRI: Principles, Applications, and Challenges. IEEE Trans Biomed Eng. 2017;64(11):2515-2530. doi:10.1109/TBME.2017.2725140
Katscher U, Voigt T, Findeklee C, Vernickel P, Nehrke K, Dossel O. Determination of Electric Conductivity and Local SAR Via B1 Mapping. IEEE Trans Med Imaging. 2009;28(9):1365-1374. doi:10.1109/TMI.2009.2015757
Zhang X, Schmitter S, Van de Moortele P, Liu J, He B. From Complex ${\rm B}_{1}$ Mapping to Local SAR Estimation for Human Brain MR Imaging Using Multi-Channel Transceiver Coil at 7T. IEEE Trans Med Imaging. 2013;32(6):1058-1067. doi:10.1109/TMI.2013.2251653
Homann H, Börnert P, Eggers H, Nehrke K, Dössel O, Graesslin I. Toward individualized SAR models and in vivo validation: Individualized SAR models. Magn Reson Med. 2011;66(6):1767-1776. doi:10.1002/mrm.22948
Christ A, Kainz W, Hahn EG, et al. The Virtual Family—development of surface-based anatomical models of two adults and two children for dosimetric simulations. Phys Med Biol. 2010;55(2):N23-N38. doi:10.1088/0031-9155/55/2/N01
Gosselin MC, Neufeld E, Moser H, et al. Development of a new generation of high-resolution anatomical models for medical device evaluation: the Virtual Population 3.0. Phys Med Biol. 2014;59(18):5287-5303. doi:10.1088/0031-9155/59/18/5287
Segars WP, Bond J, Frush J, et al. Population of anatomically variable 4D XCAT adult phantoms for imaging research and optimization: Population of anatomically variable 4D XCAT adult phantoms. Med Phys. 2013;40(4):043701. doi:10.1118/1.4794178
Arduino A. EPTlib: An Open-Source Extensible Collection of Electric Properties Tomography Techniques. Applied Sciences. 2021;11(7):3237. doi:10.3390/app11073237
Figures
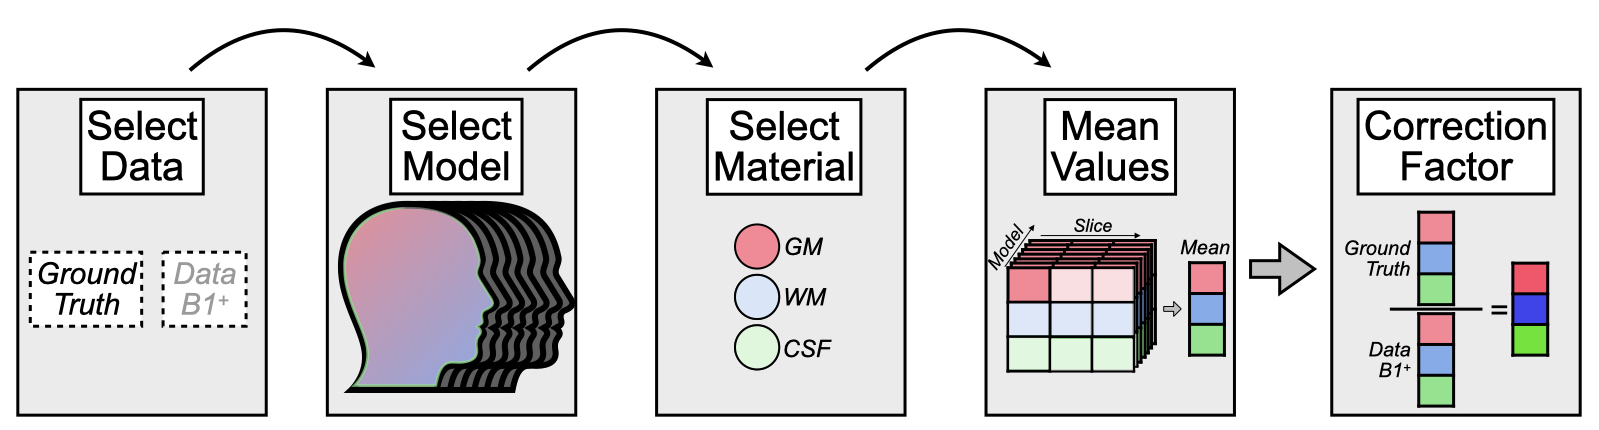
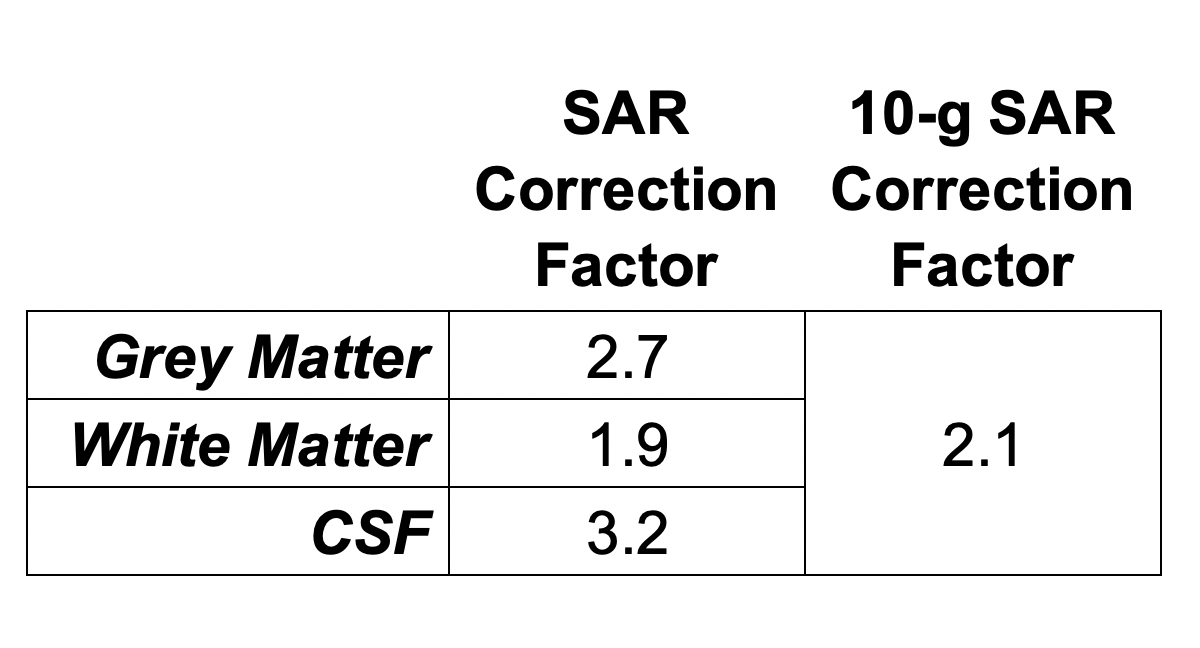
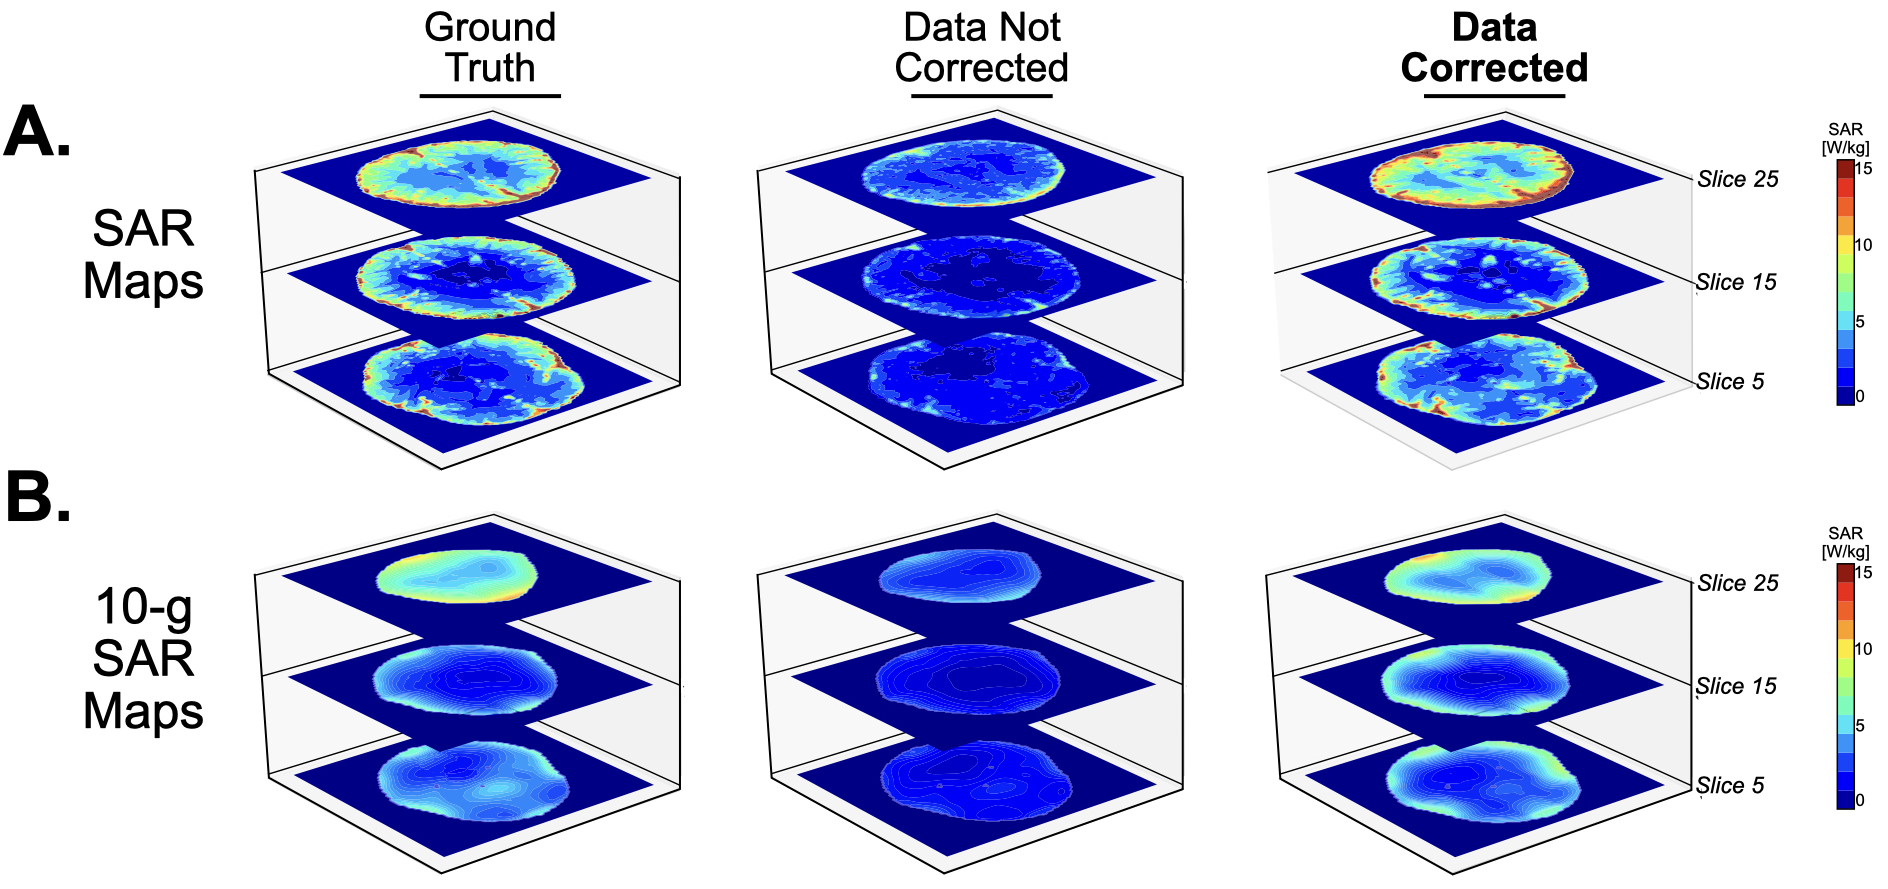
Fig. 2. SAR (A) and 10-g SAR (B) maps for the Thelonious model. Corrected data with the proposed correction factors obtains a similar SAR distribution to the ground truth.
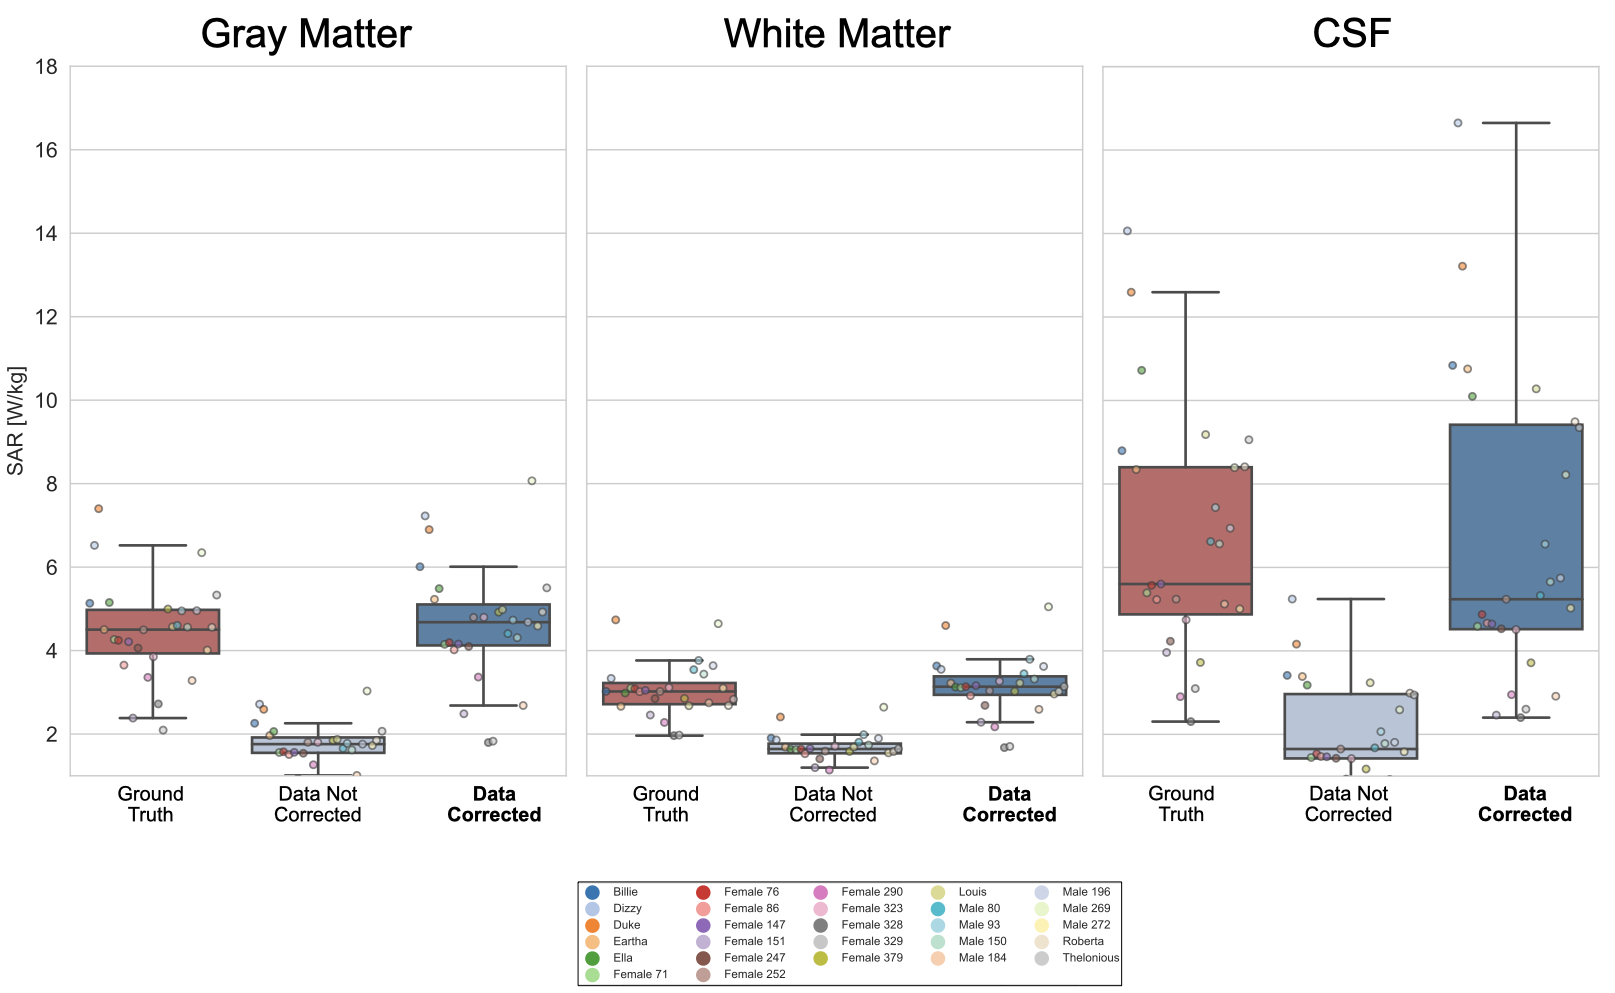
Fig. 3. Boxplot distribution of the mean SAR values across models for Gray Matter, White Matter, and CSF. For the three tissues, data not corrected (light gray) was lower compared to the Ground Truth (red). After correction (dark blue), mean SAR distribution was in the same range as the Ground Truth.