2545
Detection of Samples Out of Training Distribution: Rejection of Potential Erroneous Local SAR Predictions1Department of Radiology, University Medical Center Utrecht, Utrecht, Netherlands, 2Computational Imaging Group for MR diagnostics & therapy, Center for Image Sciences, University Medical Center Utrecht, Utrecht, Netherlands, 3Tesla Dynamic Coils BV, Zaltbommel, Netherlands, 4Biomedical Image Analysis, Dept. Biomedical Engineering, Eindhoven University of Technology, Eindhoven, Netherlands, 5Department of Radiotherapy, Division of Imaging & Oncology, University Medical Center Utrecht, Utrecht, Netherlands
Synopsis
Recognize potential hazardous situations far from the modeled MR examination scenarios is crucial for RF safety applications and especially for deep-learning-based approaches. Last year we presented a Bayesian deep-learning approach for local SAR assessment. This approach allowed accurate local SAR estimations and returned reliable feedbacks on the error/uncertainty of the estimates for the MR examination scenario observed during training. However, it also showed the dangers of using the predicted uncertainty to identify out-of-training MR examination scenarios. In this study, we propose a simple approach to detect/reject potential erroneous local SAR predictions due to out-of-training transmit array and/or anatomical variations.
PURPOSE
Local SAR cannot be measured and is usually evaluated by off-line numerical simulations using generic body models. Software tools to perform on-line simulations1 and deep-learning methods2 are being developed. However, errors/uncertainties will inevitably be present (e.g. due to the finite size of the training). Therefore it is crucial to recognize potential hazardous situations far from the modeled MR examination scenarios.Last year we presented a Bayesian deep-learning approach to map the relation between subject-specific complex B1+-maps and the corresponding 10g-averaged SAR (SAR10g) distribution, and to predict the spatial distribution of uncertainty at the same time3. This approach allowed accurate SAR10g estimations and returned reliable feedbacks on the error/uncertainty of the estimates for the MR examination scenario observed during training.
However, the use of the predicted uncertainty to identify potential erroneous SAR10g predictions due to MR scenarios out-of-training dataset can be very hazardous. Indeed, with Bayesian deep-learning approaches there is no guarantee that predictions on samples out-of-training distribution will be considered uncertain4, and their detection is still a common open problem4,5.
In this work, we present a simple and effective approach which is capable of detecting most out-of-training samples.
METHODS
The proposed approach is based on Cycle Consistency and it is performed after our Bayesian deep-learning approach for SAR10g assessment3. To recognize if a predicted SAR10g distribution is reliable or not, we train an additional convolutional neural network (U-Net6,7) to map the “inverse” relation between SAR10g distribution and the corresponding magnitude B1+-maps. Then, we compare predicted and measured B1+-maps.Importantly, we train both networks with the same synthetic dataset consisting of complex B1+-maps and corresponding SAR10g distributions2,3 in pelvis with 8-fractionated dipole array8,9 at 7T (5750 data samples obtained using 23 subject-specific models with body profile deformation due to the transmit array placement10 and random phase-shimming sets).
The actual ability of the proposed approach to detect out-of-training samples is verified by performing a 3-Fold Cross-Validation (Figure 1.A) and additional tests with two dedicated out-of-training test sets: 1500 data samples obtained for five different MR examination/transmit array setups8,9,11-13 (Figures 6.1B-6.1F); 1000 data samples obtained from the same transmit array in the training set but using four extremely abnormal pelvic models (Figures 6.1H-6.1K).
Out of Training Samples Rejection
The predicted SAR10g distributions by Bayesian deep-learning approach are used as inputs for the second network to predict the corresponding B1+-maps (Figure 2.A).
Then, the SAR10g predictions which produce root-mean-square (RMS) errors of the predicted and measured B1+-maps larger than a threshold THB1 or with RMS SAR10g uncertainty larger than a threshold THU are rejected.
The upper-inner-fence over all 3-fold cross-validation results (samples in training distribution) are used to define the thresholds THB1 and THU (Figure 2.B-2.C).
RESULTS AND DISCUSSION
The defined thresholds for RMS B1+-maps error (THB1=0.15µT) and RMS SAR10g uncertainty (THU=0.226W/kg) are reported in Figure 2.In Figure 3 the predicted peak SAR10g (pSAR10g) and RMS SAR10g uncertainty obtained by our Bayesian deep-learning approach are reported. Accurate pSAR10g predictions and reliable SAR10g uncertainty estimations are provided for samples in training distribution (3-fold cross-validation, Figure 3.A). However, hazardous SAR10g uncertainty underestimations can be observed for samples out-of-training distribution (for prostate and liver imaging with Duke model and for abnormal anatomical body models).
Figure 4 shows the ability to recognize samples in/near the training distribution. The proposed method is able to detect/reject almost all samples from the most “uncertain” model in our dataset (M09), accepting almost all the other samples. Indeed, this model exhibits greater RMS SAR10g errors and uncertainties than the other models (all points in the upper-right corner are generated from it).
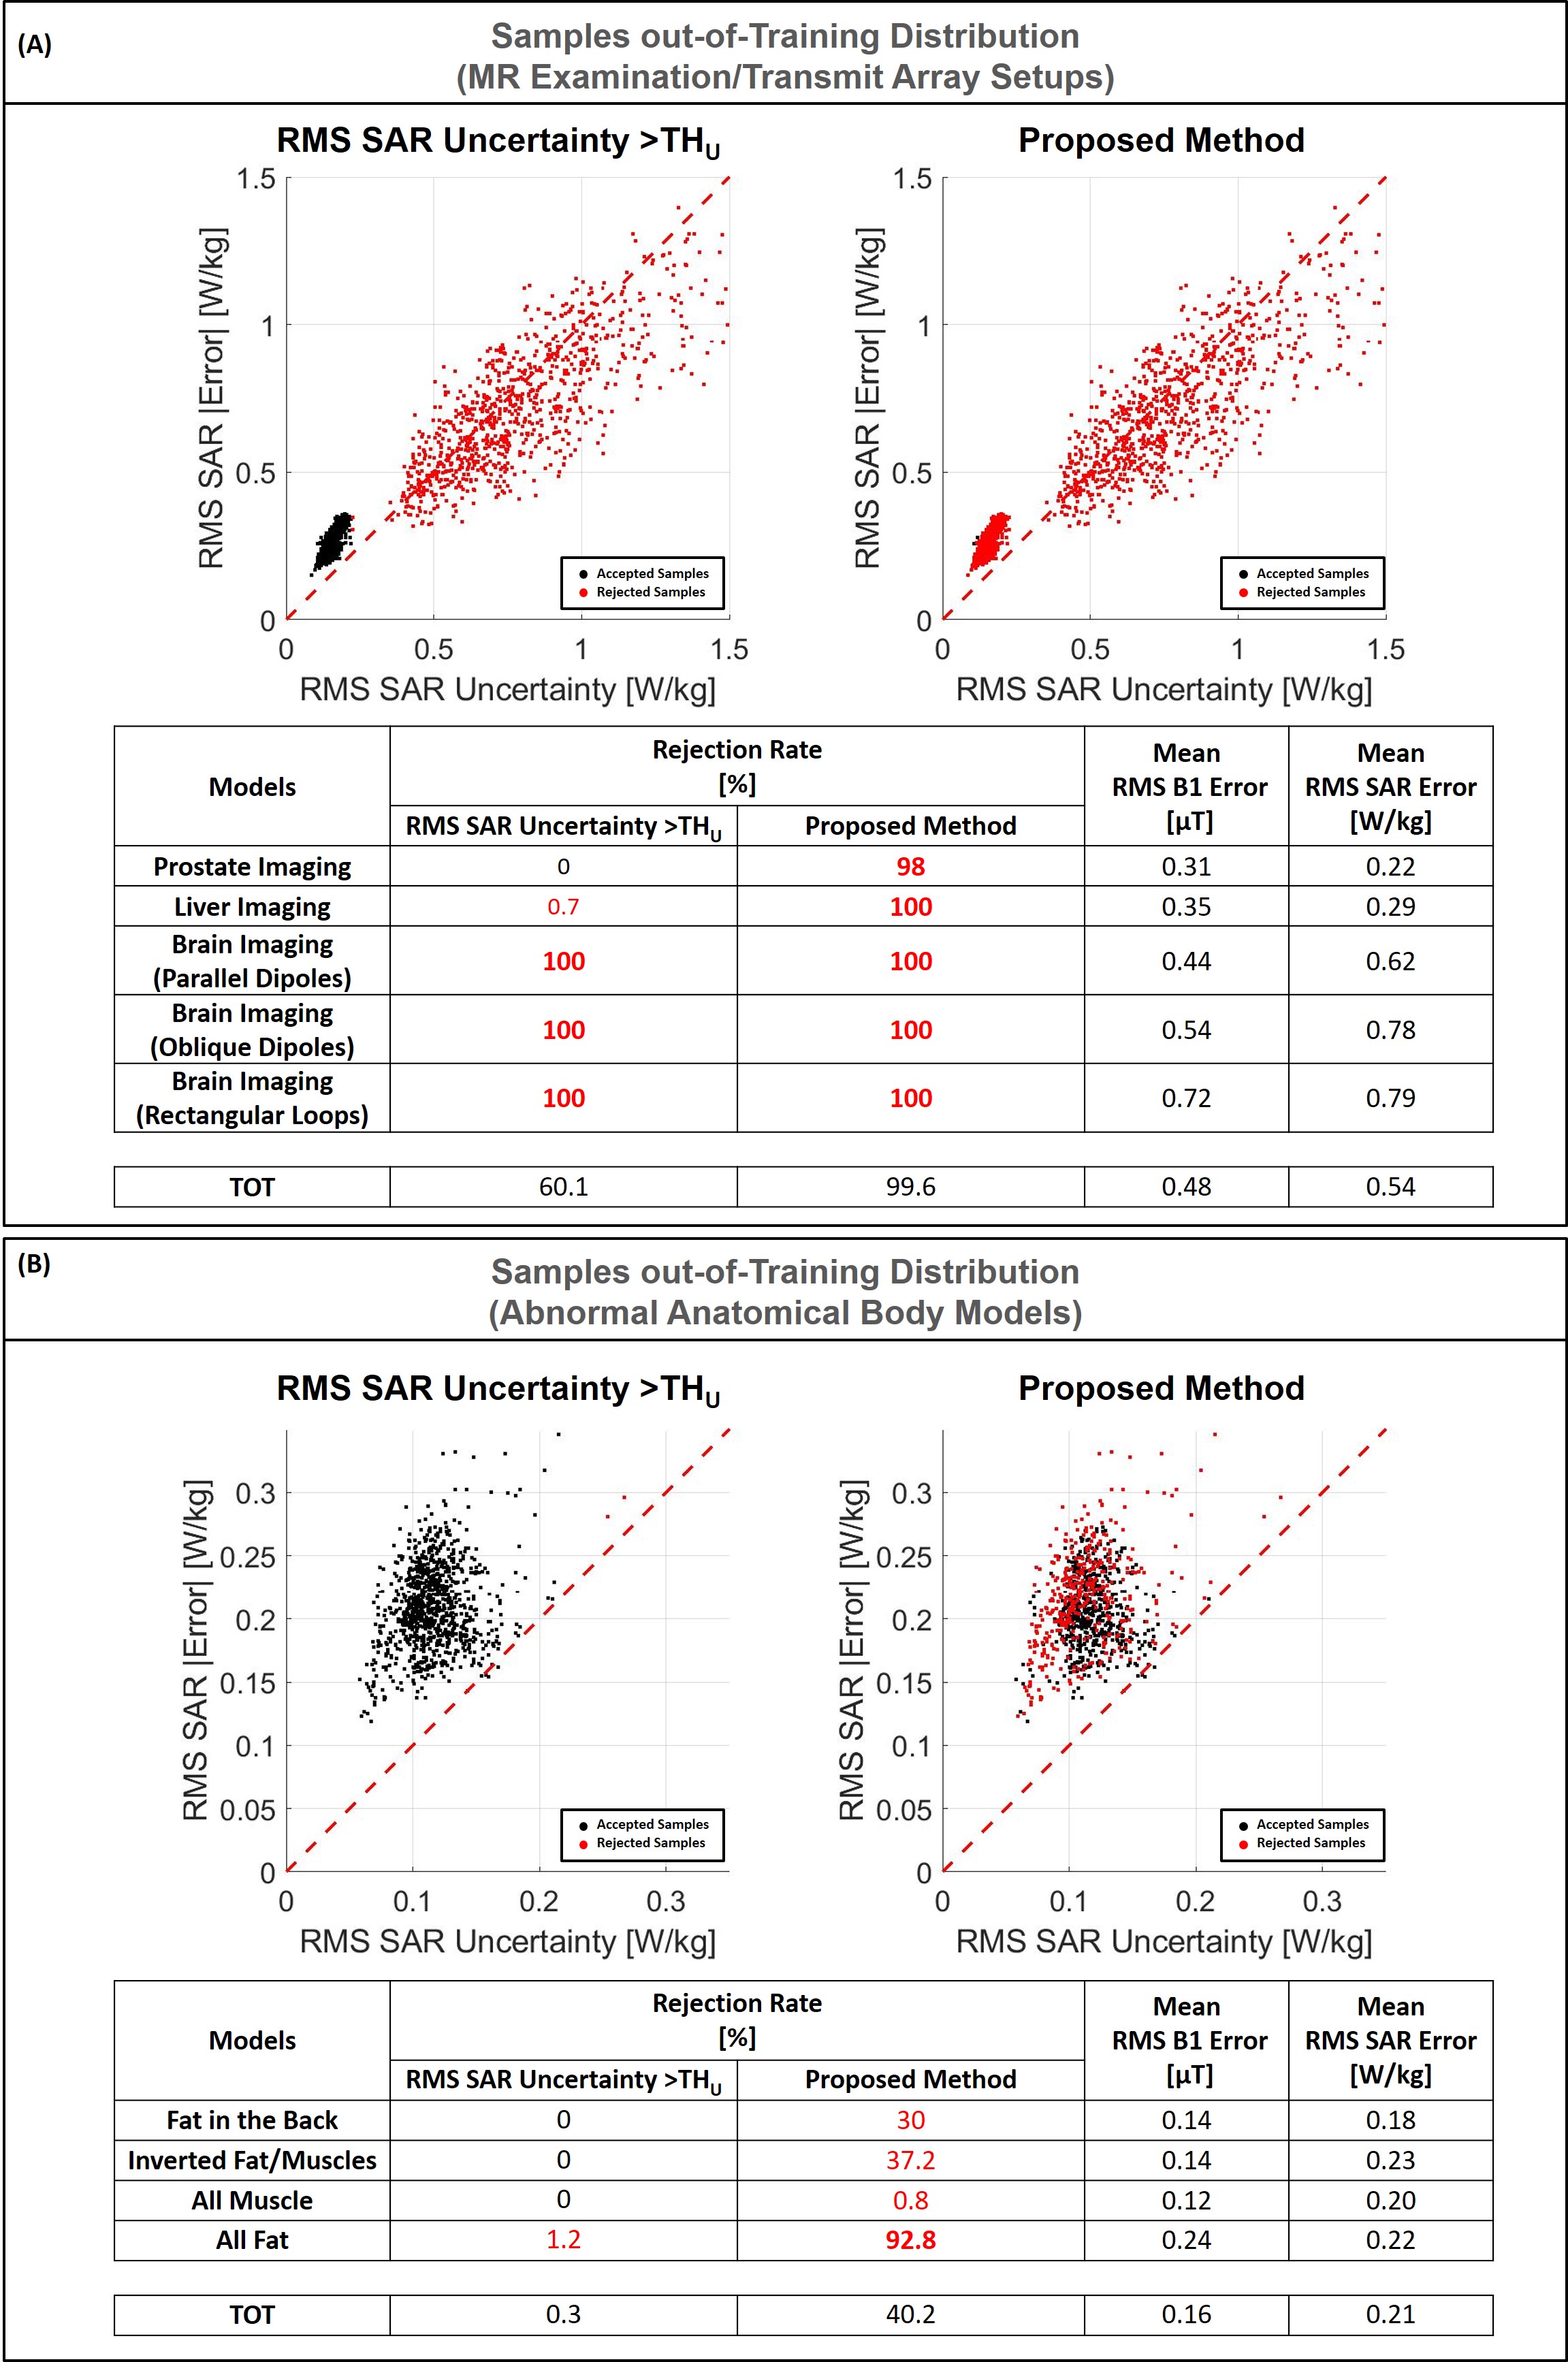
Figure 5 shows the ability to recognize samples out-of-training distribution. In particular, since the second network is able to predict accurate B1+-maps only for the transmit array it was trained, the proposed method seems to be able to detect all out-of-training samples due to transmit array setup variations (Figure 5.A, Rejection rate~100%). Whereas, using only the predicted SAR10g uncertainty, almost no out-of-training samples for prostate and liver imaging with Duke model (not included in the training set and whose body curvature does not fit well with the array elements) are detected.
Similarly, while the ability to detect out-of-training samples due to large anatomical variations using only the predicted SAR10g uncertainty is compromised (Figure 5.B, Rejection rate<1%), with the proposed method more than 90% of samples are detected consisting exclusively of fat tissue, 30% from the model without muscle tissue in the back and 37% from the model with inverted fat and muscle tissues. However, only a few samples from the model consisting exclusively of muscle tissue are detected.
It is worth noting that the RMS SAR10g error for the not detected out-of-training samples is only slightly higher than for the samples in the training set (<0.25W/kg) and lower than for samples from the most “uncertain” model M09 (and also their pSAR10g estimations appear to be quite accurate, Figure 3.C).
CONCLUSION
The proposed approach can detect potentially hazardous situations far from the modeled MR examination scenarios. This will allow us to better exploit our previous Bayesian deep-learning approach which quantifies the inevitable residual uncertainty for “in-training distribution samples” e.g. from the finite size of the training set.Acknowledgements
No acknowledgement found.References
1Villena JF, Polimeridis AG, Eryaman Y, et al. Fast Electromagnetic Analysis of MRI Transmit RF Coils Based on Accelerated Integral Equation Methods. IEEE Trans Biomed Eng. 2016; 63(11):2250-2261.
2Meliadò EF, Raaijmakers AJE, Sbrizzi A, et al. A deep learning method for image‐based subject‐specific local SAR assessment. Magn Reson Med. 2019;00:1–17.
3Meliadò EF, Raaijmakers AJE, Maspero M, et al. Uncertainty Estimation of Subject-Specific Local SAR Assessment by Bayesian Deep Learning. Proceedings of the ISMRM 30th Annual Meeting, 15-20 May 2021. p. 0413.
4Ståhl N., Falkman G., Karlsson A., Mathiason G. (2020) Evaluation of Uncertainty Quantification in Deep Learning. In: Lesot MJ. et al. (eds) Information Processing and Management of Uncertainty in Knowledge-Based Systems. IPMU 2020. Communications in Computer and Information Science, vol 1237. Springer, Cham. https://doi.org/10.1007/978-3-030-50146-4_41.
5Balaji Lakshminarayanan, Alexander Pritzel, and Charles Blundell. Simple and scalable predictive uncertainty estimation using deep ensembles. arXiv preprint arXiv:1612.01474, 2017.
6O. Ronneberger, P. Fischer, T. Brox, U-Net: Convolutional Networks for Biomedical Image Segmentation, Medical Image Computing and Computer-Assisted Intervention – MICCAI 2015 pp 234-241.
7Kendall A, Gal Y. What Uncertainties Do We Need in Bayesian Deep Learning for Computer Vision?. In: Advances in Neural Information Processing Systems. 2017;5580–5590.
8Steensma BR, Luttje M, Voogt IJ, et al. Comparing Signal-to-Noise Ratio for Prostate Imaging at 7T and 3T. J Magn Reson Imaging. 2019;49(5):1446-1455.
9Raaijmakers AJE, Italiaander M, Voogt IJ, Luijten PR, Hoogduin JM, et al. The fractionated dipole antenna: A new antenna for body imaging at 7 Tesla. Magn Reson Med. 2016;75:1366–1374.
10Meliadò EF, van den Berg CAT, Luijten PR, Raaijmakers AJE. Intersubject specific absorption rate variability analysis through construction of 23 realistic body models for prostate imaging at 7T. Magn Reson Med. 2019;81(3):2106-2119.
11Christ A, Kainz W, Hahn EG, et al. The Virtual Family—development of surface‐based anatomical models of two adults and two children for dosimetric simulations. Phys Med Biol. 2010;55:N23–N38.
12Restivo M, Hoogduin H, Haghnejad AA, Gosselink M, Italiaander M, Klomp D, et al. An 8-Ch Transmit Dipole Head and Neck Array for 7T Imaging: Improved SAR levels, Homogeneity, and Z-Coverage over the Standard Birdcage Coil. Proceedings of the ISMRMB 33rd Annual Scientific Meeting, Berlin, 29 September-1 October 2016. p. 331.
13Avdievich NI. Transceiver-Phased Arrays for Human Brain Studies at 7 T. Appl Magn Reson. 2011;41(2-4):483‐506.
Figures
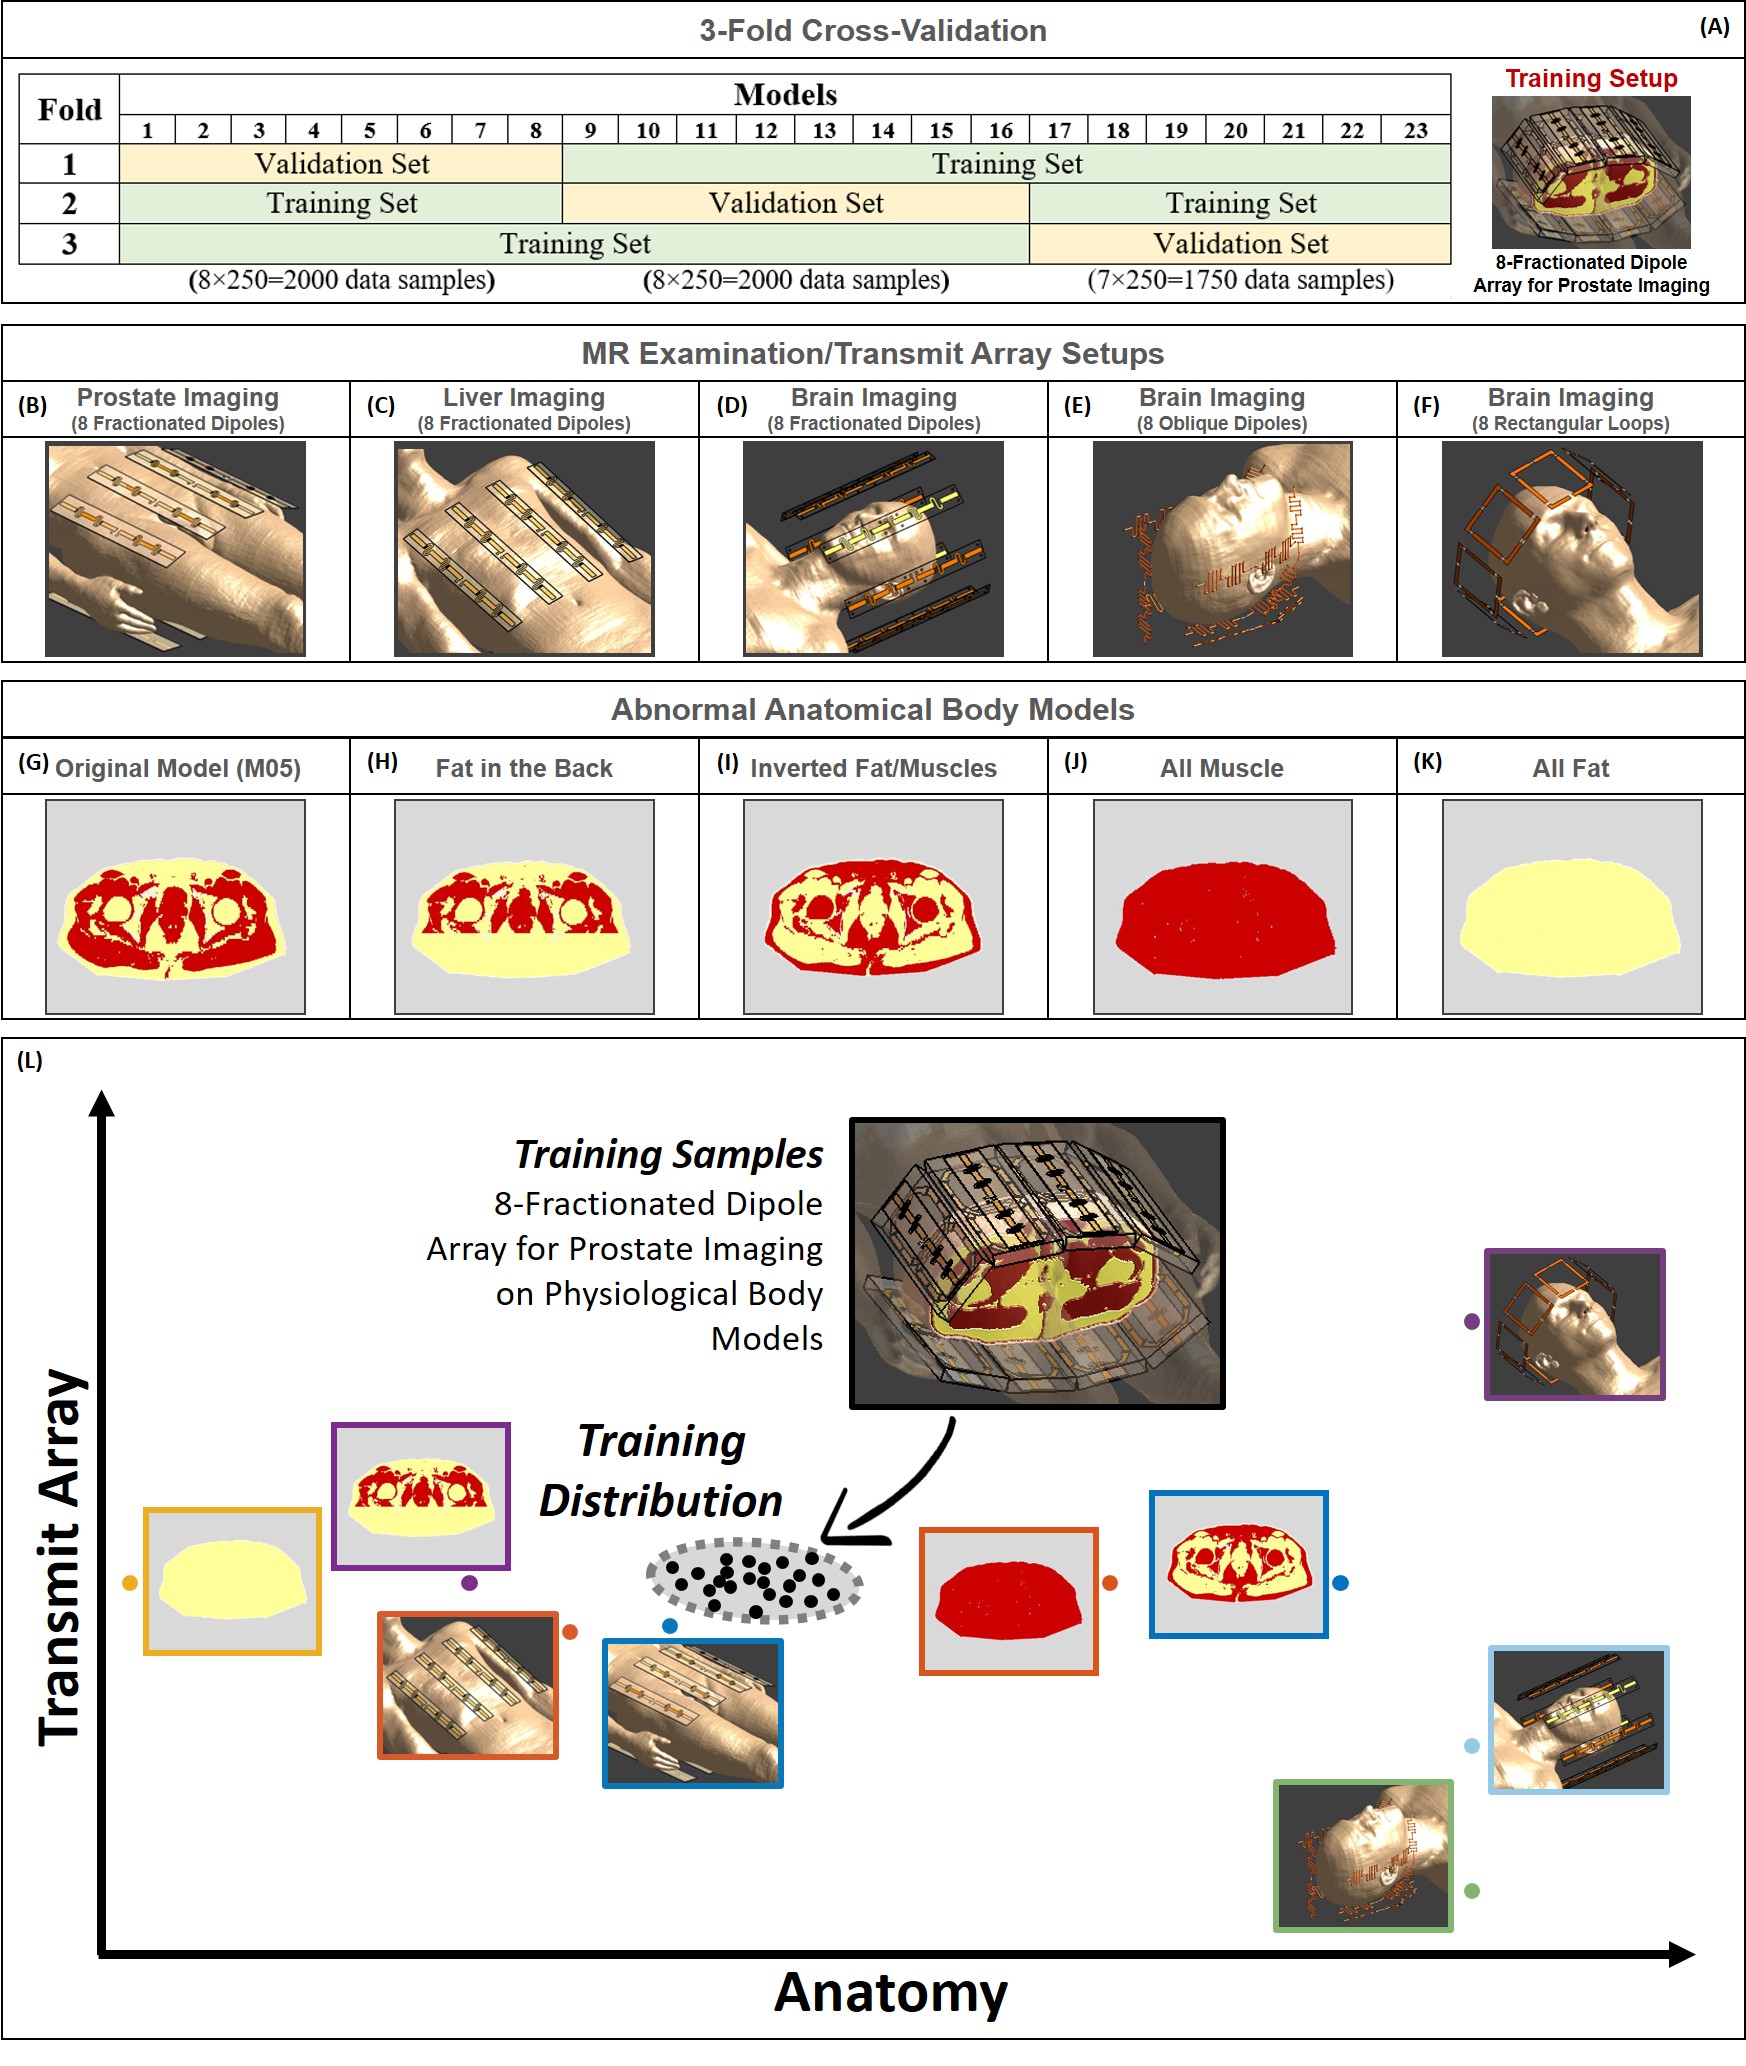
Figure 1: 3-fold cross-validation and training MR examination setup (A). Body array with 8-fractionated dipoles placed on the body model Duke for prostate imaging (B) and liver imaging (C). Head arrays with 8-fractionated dipoles (D), 8 oblique fractionated dipoles (E) and 8 rectangular loops (F). Original body model (G); model without muscle tissue in the back (H); model with inverted fat and muscle tissues (I); model consisting exclusively of muscle tissue (J); model consisting exclusively of fat tissue (K).
Graphic representation of sample in and out of training distribution (L).
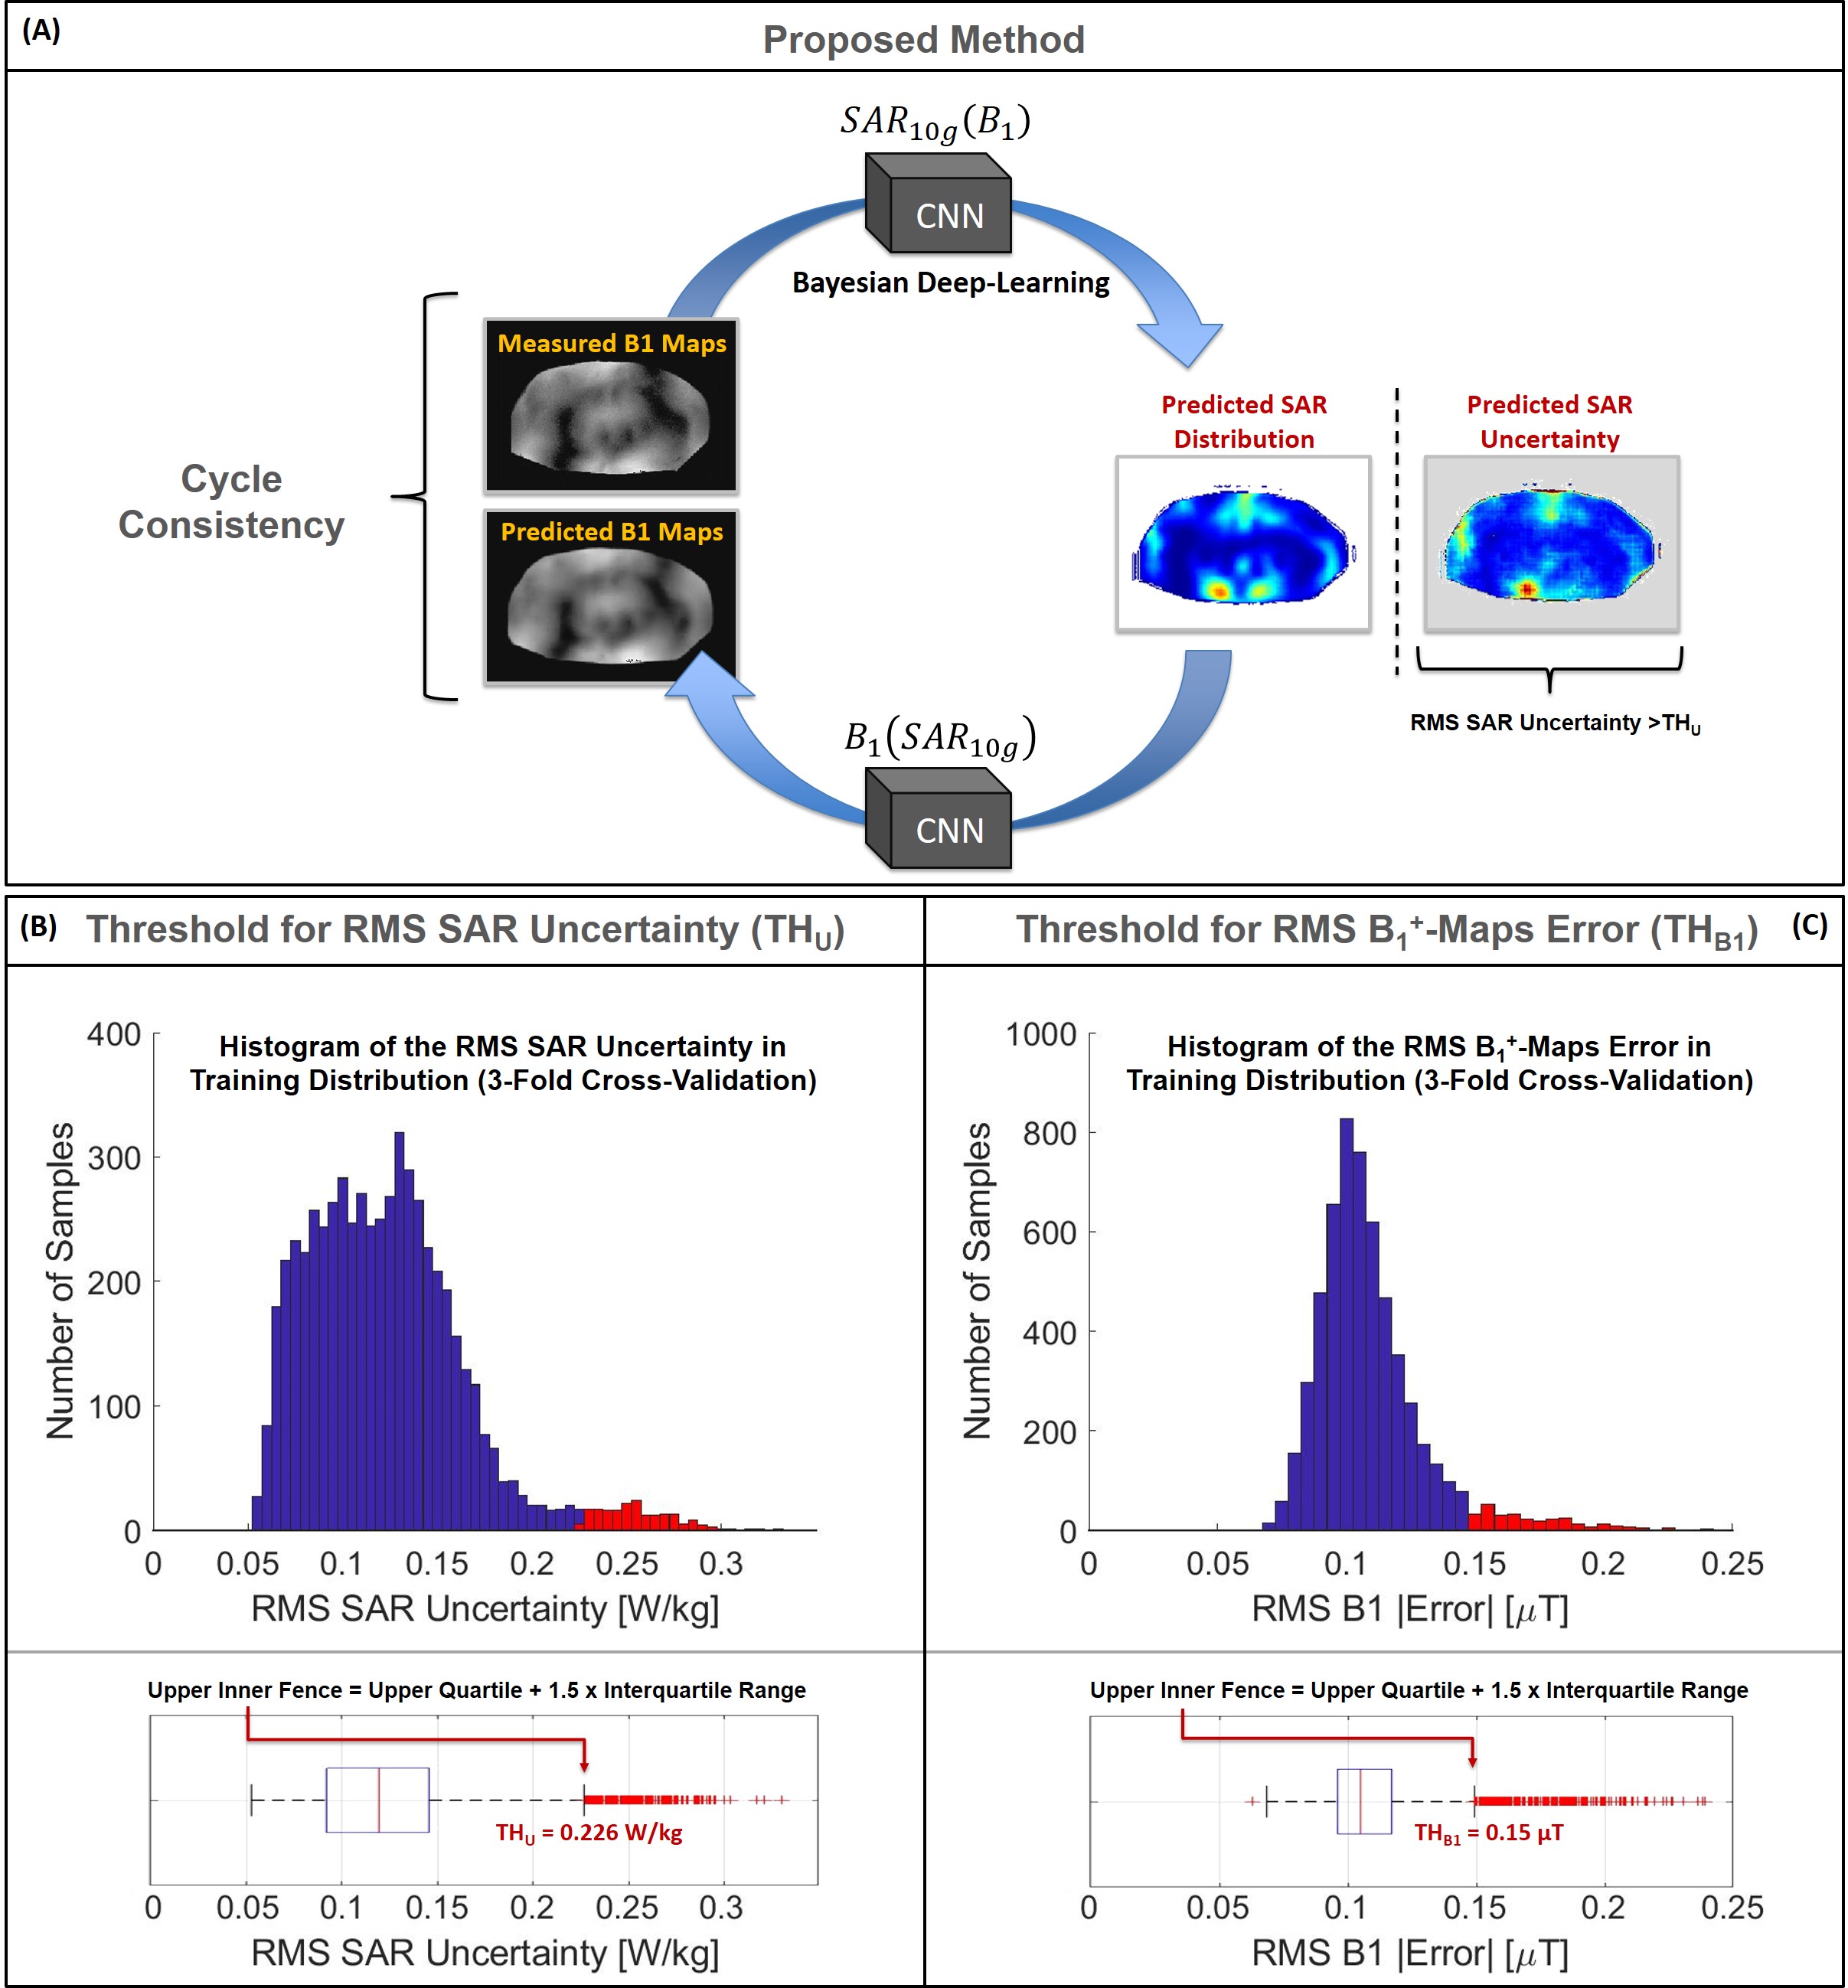
Figure 2: Graphic representation of the proposed method based on Cycle Consistency (A).
Histograms and boxplots of the RMS SAR Uncertainty (B) and RMS B1+-maps Error (C). The red boxes in the histograms and the red marker in the boxplots represent the samples over the thresholds in training distribution.
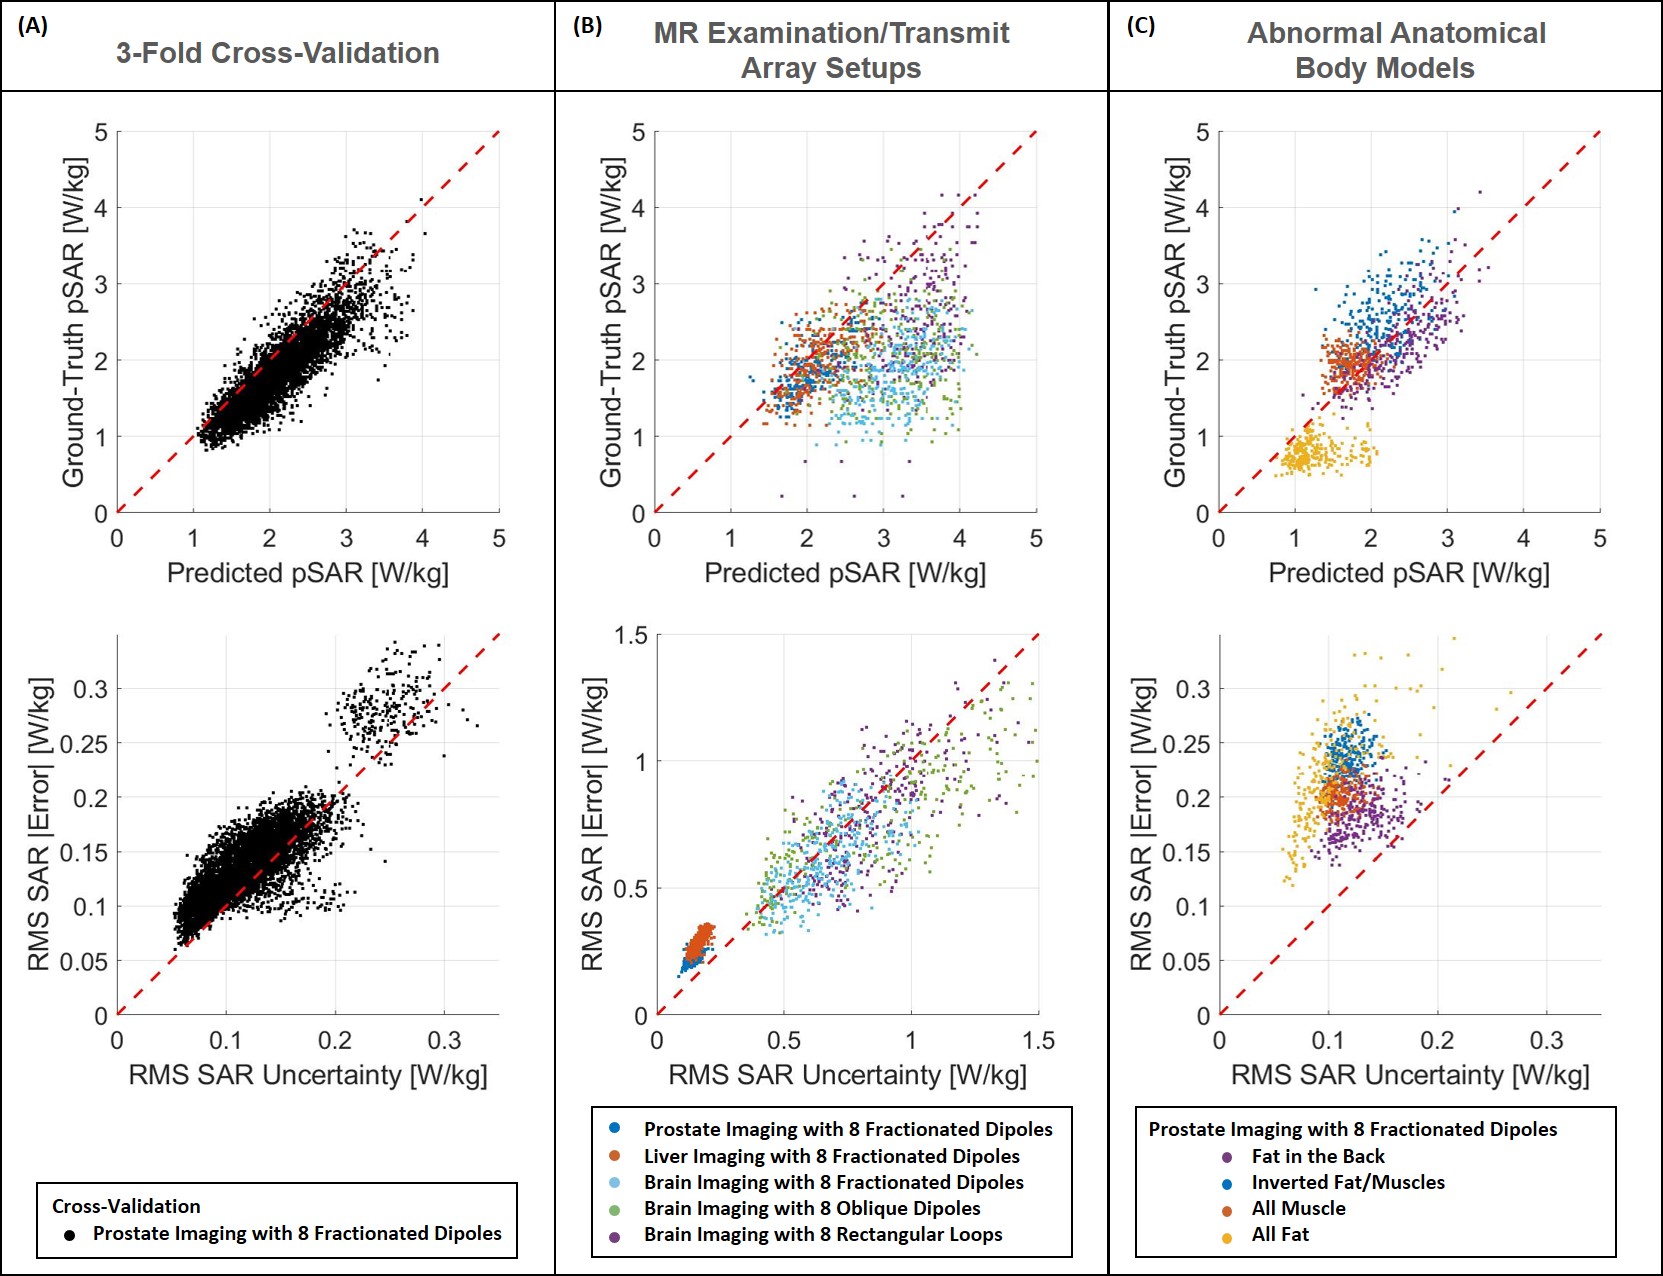
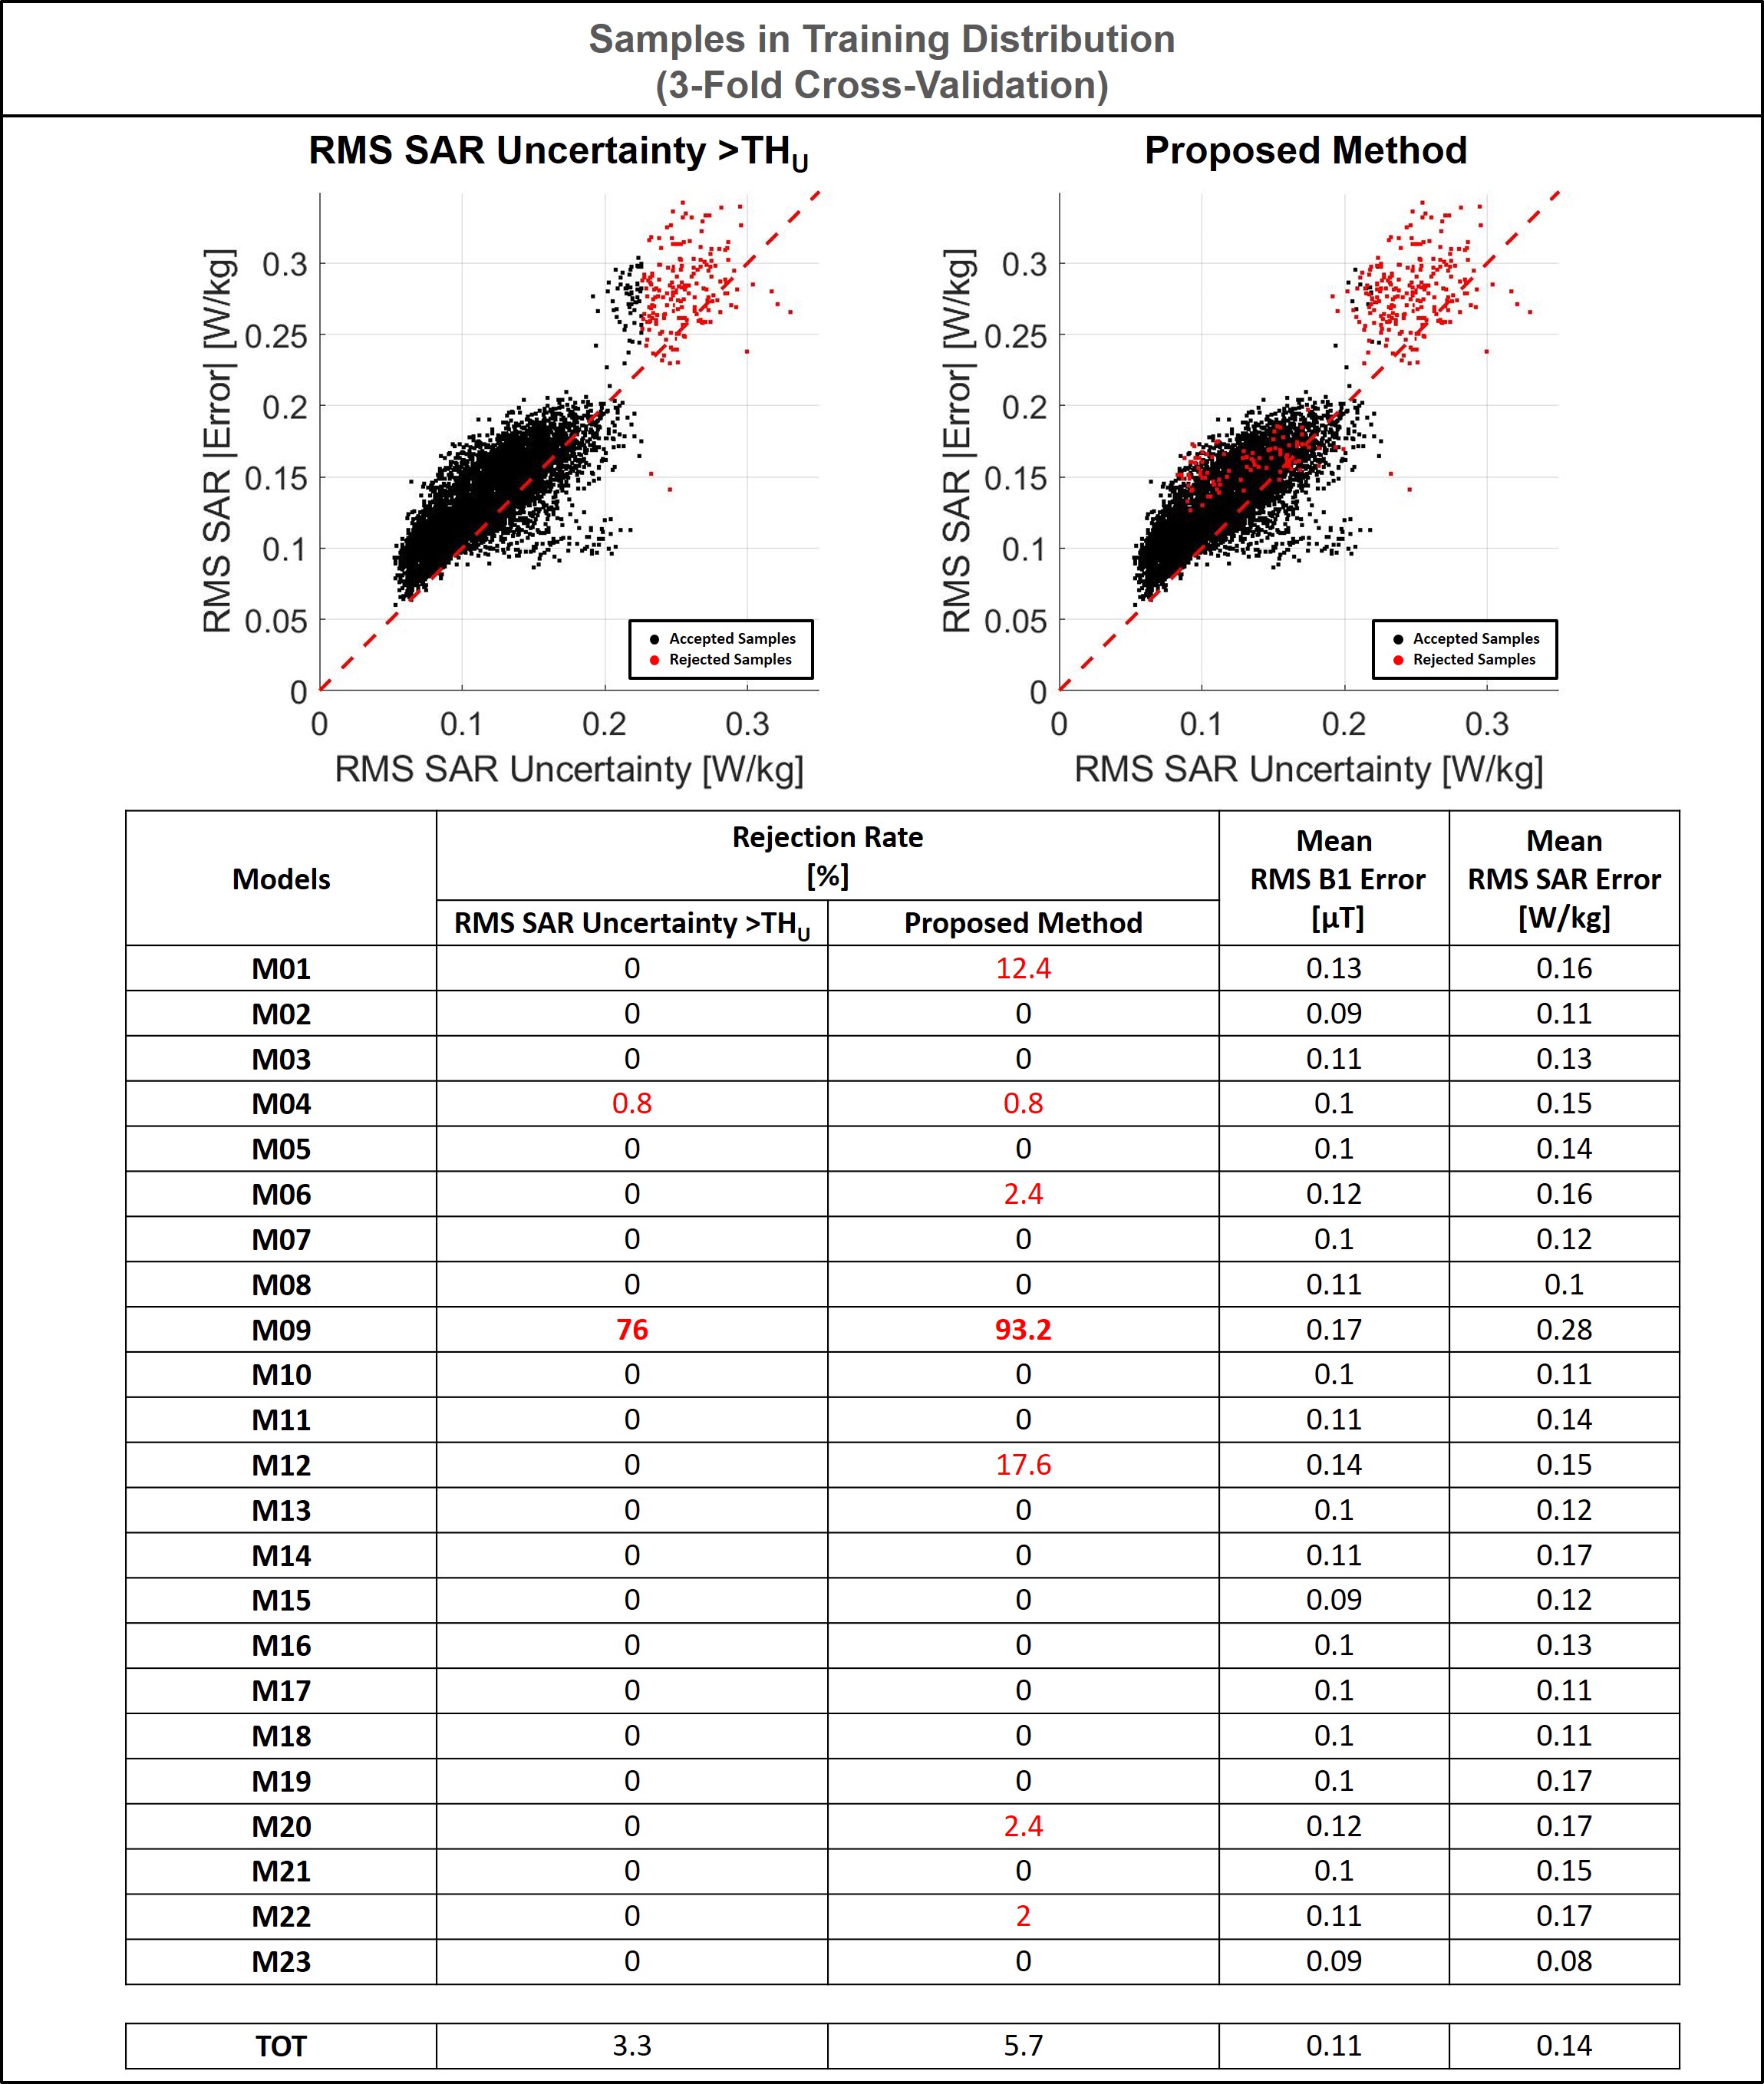
Figure 4: Samples in Training Distribution: Scatter plots RMS SAR uncertainty versus RMS absolute SAR error. The red points on the left-side plot represent the rejected samples based on predicted SAR uncertainty only (RMS SAR Uncertainty<=THU). The red points on the right-side plot represent the rejected samples based on the proposed method (RMS SAR Uncertainty<=THU or RMS B1 Error<=THB1). With the proposed method almost all samples with RMS SAR Error>0.25 are rejected.
In the table are reported the rejection rates, the mean RMS B1 error, and the mean RMS SAR error for each model.