2543
Frequency and Phase Drift Correction of Rosette MRSI Data using Spectral Registration1Integrated Program in Neuroscience, McGill University, Montreal, QC, Canada, 2Hurvitz Brain Sciences Program, Sunnybrook Research Institute, Toronto, ON, Canada, 3Medical Biophysics Department, Sunnybrook Research Institute, Toronto, ON, Canada
Synopsis
MRSI is a non-invasive in-vivo technique for mapping tissue concentrations in clinical and neuro-scientific research. Although, in vivo MRSI has made progress with respect to spatial resolution, acquisition time and the number of detectable metabolites; frequency and phase drifts in the acquired data are still a persisting problem, resulting in SNR losses, broadening of spectral peaks and deformities in line spectra of metabolites. In this abstract, we show how rosette MRSI sampling trajectories offer the possibility to perform frequency and phase drift correction which is otherwise not possible to do in most other commonly used cartesian and non-cartesian sampling trajectories.
Introduction
Magnetic resonance spectroscopic imaging (MRSI) involves the collection of temporally resolved k-space data over the course of several minutes to generate spatially and spectrally encoded imaging data1. A stable scanner frequency is required to properly reconstruct the acquired data. However, in practice, temporal fluctuations in the B0 field are inevitable due to heating of gradient coils, passive shimming2,3 and subject motion. This causes frequency and phase drifts between each repetition to accumulate over time thereby causing line broadening, lineshape distortion, spectral misalignment and reduced SNR thus impacting the subsequent processing and quantification of metabolites.In single-voxel MRS, different methods have been proposed to correct these drifts, like spectral registration(SR), residual water peak correction and Lorentzian line shape fitting4. SR uses the early portion of the FID for spectral alignment. This is advantageous because the signal is bound to be strongest here and no prior information about frequencies containing stronger signals is required.
However, drift correction of MRSI data is more challenging as the multiple repetitions often do not share any common k-space points that can be used for estimating drifts. Hence separately acquired navigator echoes are needed in commonly used cartesian and non-cartesian k-space trajectories like EPSI, concentric rings and conventional MRSI. A Rosette MRSI acquisition overcomes these shortcomings by capturing the center of k-space during each repetition thus acting as a self-navigator for estimating the drifts at each scan. The purpose of this study is to demonstrate the feasibility of frequency and phase drift correction in rosette MRSI sampling trajectories.
Methodology
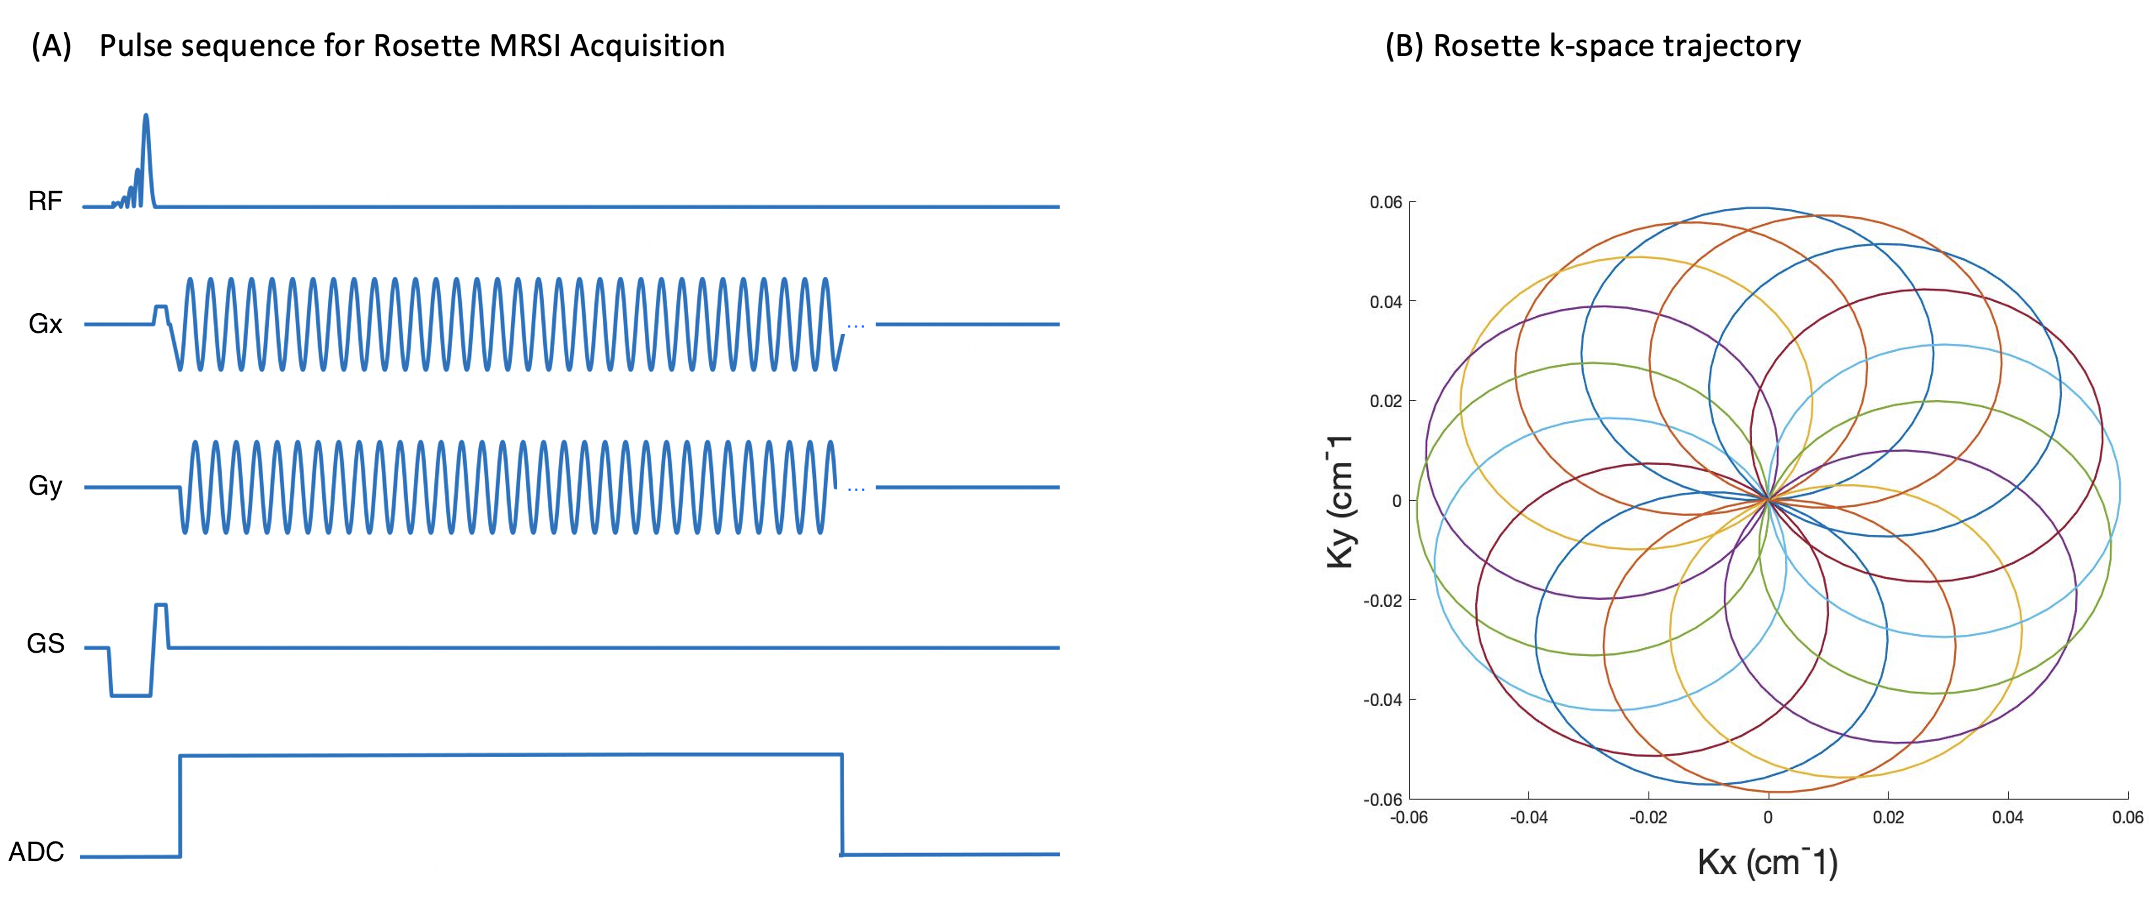
An FID-MRSI sequence with a rosette k-space trajectory (Figure 1(A)) was implemented on a 3T Prisma MR scanner(Siemens, Erlangen, Germany). Each repetition consists of a circular trajectory originating at the k-space center, with diameter kmax. The circles are rotated about the origin during each repetition until full k-space coverage is achieved. The rosette k-space trajectory can be defined as a complex function given by: $$ k(t) = k_{max}{sin(w_1t)}{e^{iw_2t}} $$ where w1 and w2 represent the oscillation and rotational frequencies, and kx and ky correspond to the real and imaginary components of k respectively. We set w1=w2 to achieve circular rosette trajectories (Figure 1(B)).Data Acquisition: Phantom experiments were performed using a GE “Braino” phantom, which contains realistic relative concentrations of typical human brain metabolites. Diffusion Tensor Imaging (DTI) was acquired for 15 minutes prior to the MRS scan to induce gradient heating and subsequent frequency drift. Rosette MRSI was implemented using the following parameters: 300 mm² field of view; 21 x 21 matrix size, 32 shots, 9 averages, TR/TE=1200/1.6 ms, FA=90°, 1190Hz spectral width, 84 ADC points per k-space loop, and a total scan time of 6 minutes. Data were extracted from the scanner console in TWIX format that contains individual raw FIDs for each RF channel and repetition.
Data Processing and Frequency Correction: Data processing and reconstruction were performed in MATLAB using the FID-A Toolkit5. First, k-space density compensation was performed using the Voronoi method6,7. Next, FIDs from the centre of k-space were isolated from each repetition by extracting the first and each subsequent 84th point of each ADC readout. Using the first k=0 FID as a reference, frequency and phase offsets for each subsequent repetition were estimated using time-domain spectral registration, which uses non-linear least-squares minimization to estimate the frequency and phase shift required to optimally align each FID signal to the reference spectrum. This minimization was implemented in MATLAB (MathWorks, MA, USA).
Once the frequency and phase offsets were estimated for each k=0 FID, the corresponding corrections were applied to the full ADC signals (not only the k=0 extracted FIDs), to achieve a frequency and phase drift correction across the whole of k-space. Estimation and correction of drifts were performed individually for each RF channel.
Results and Discussion
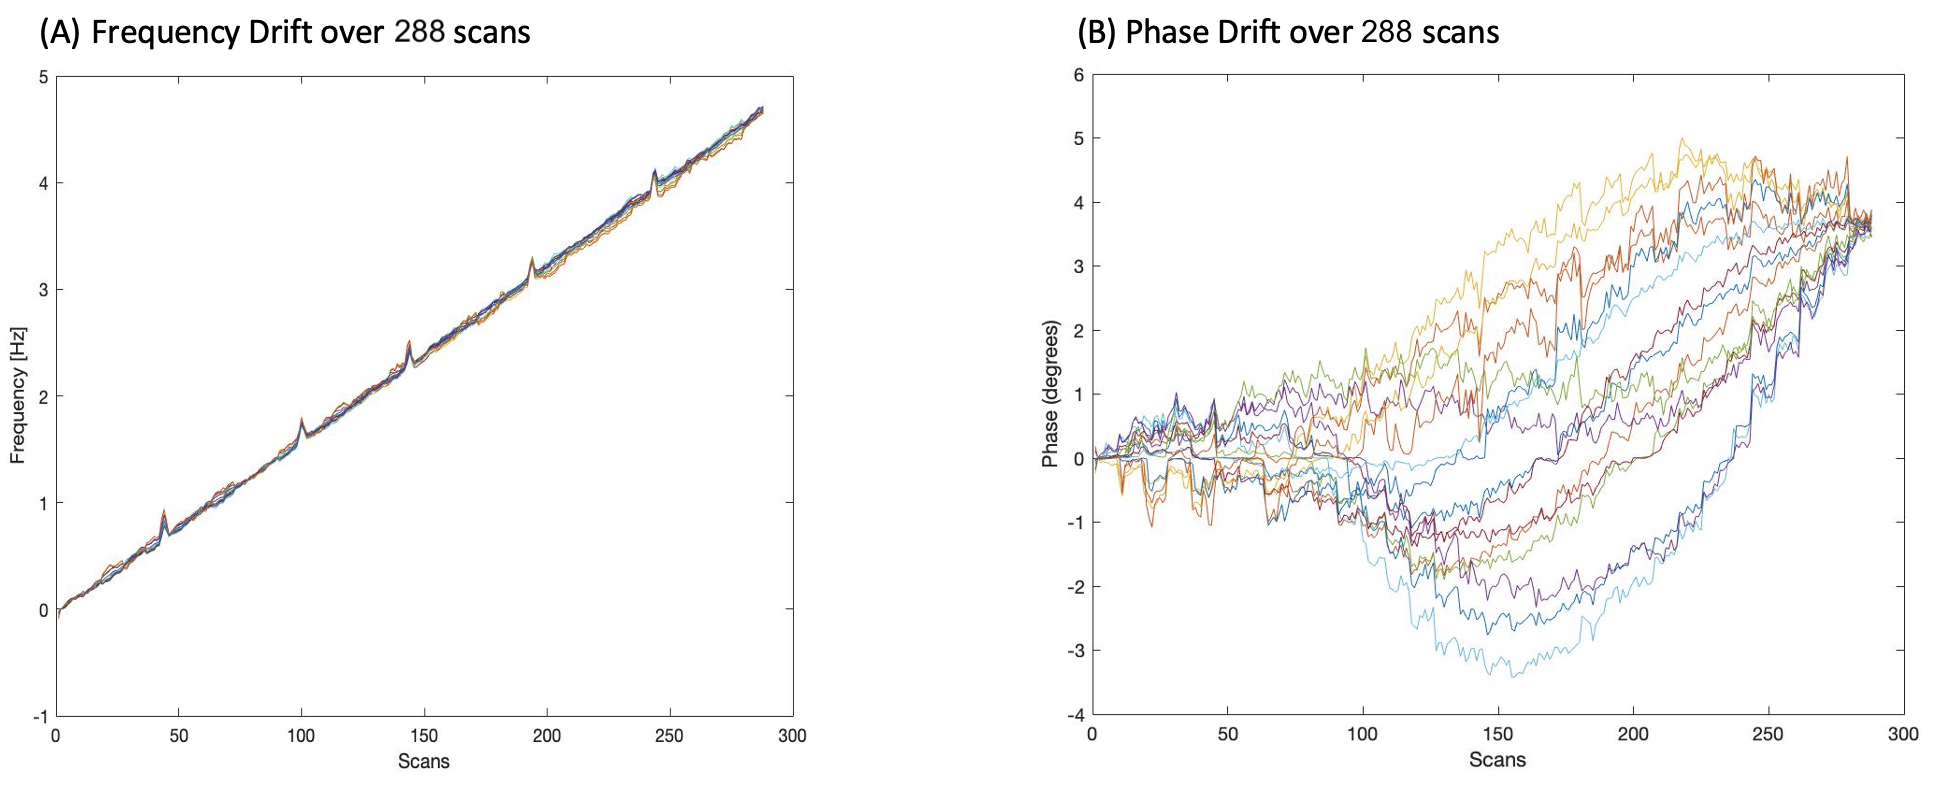
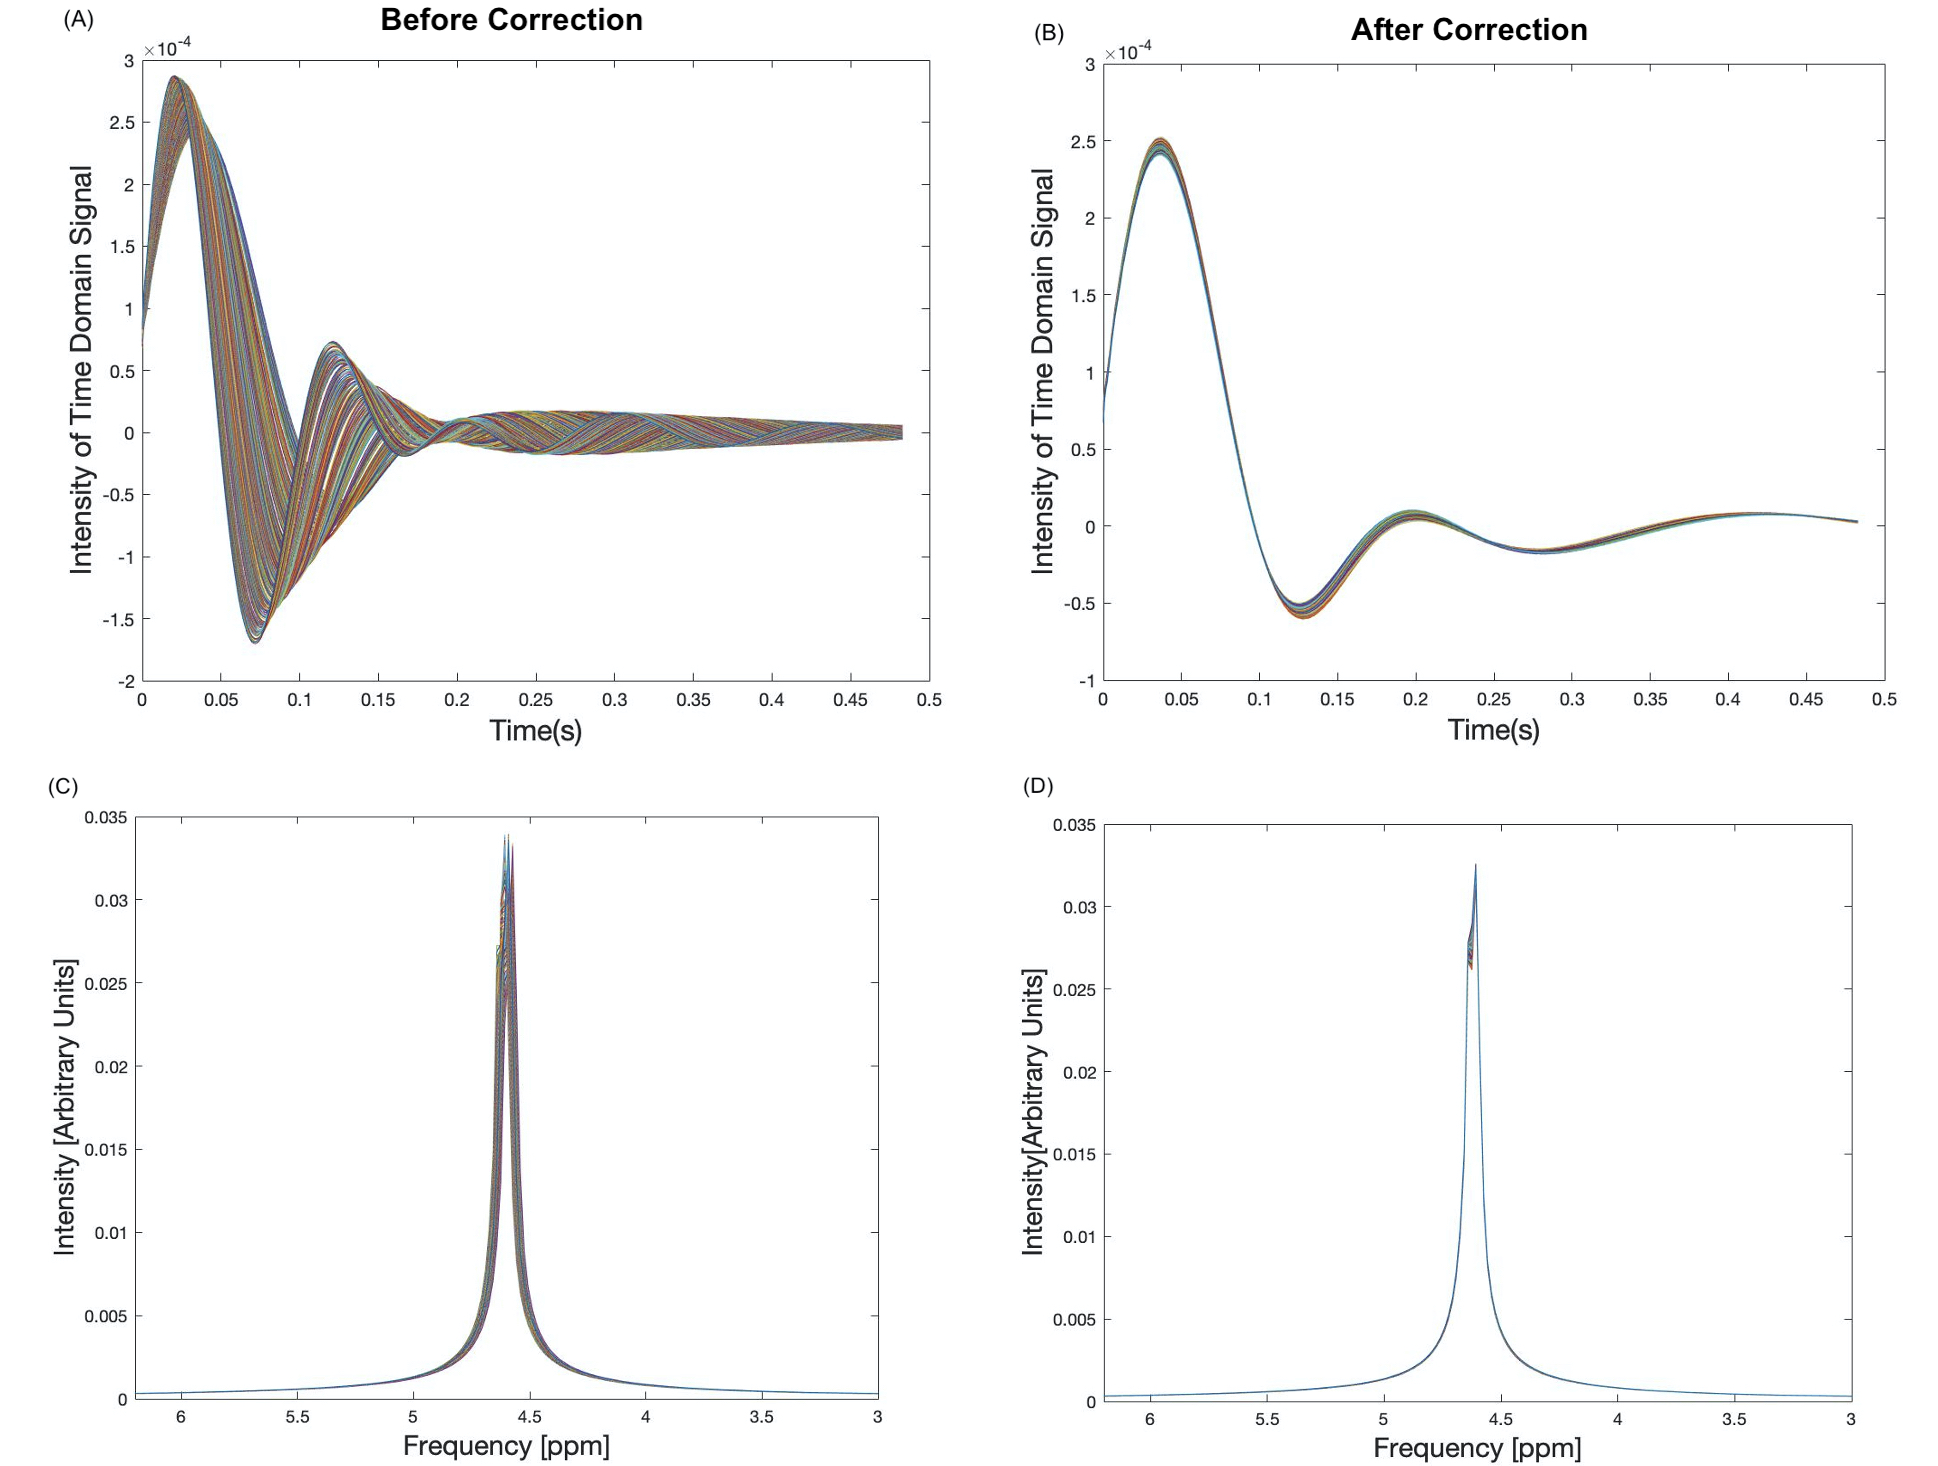
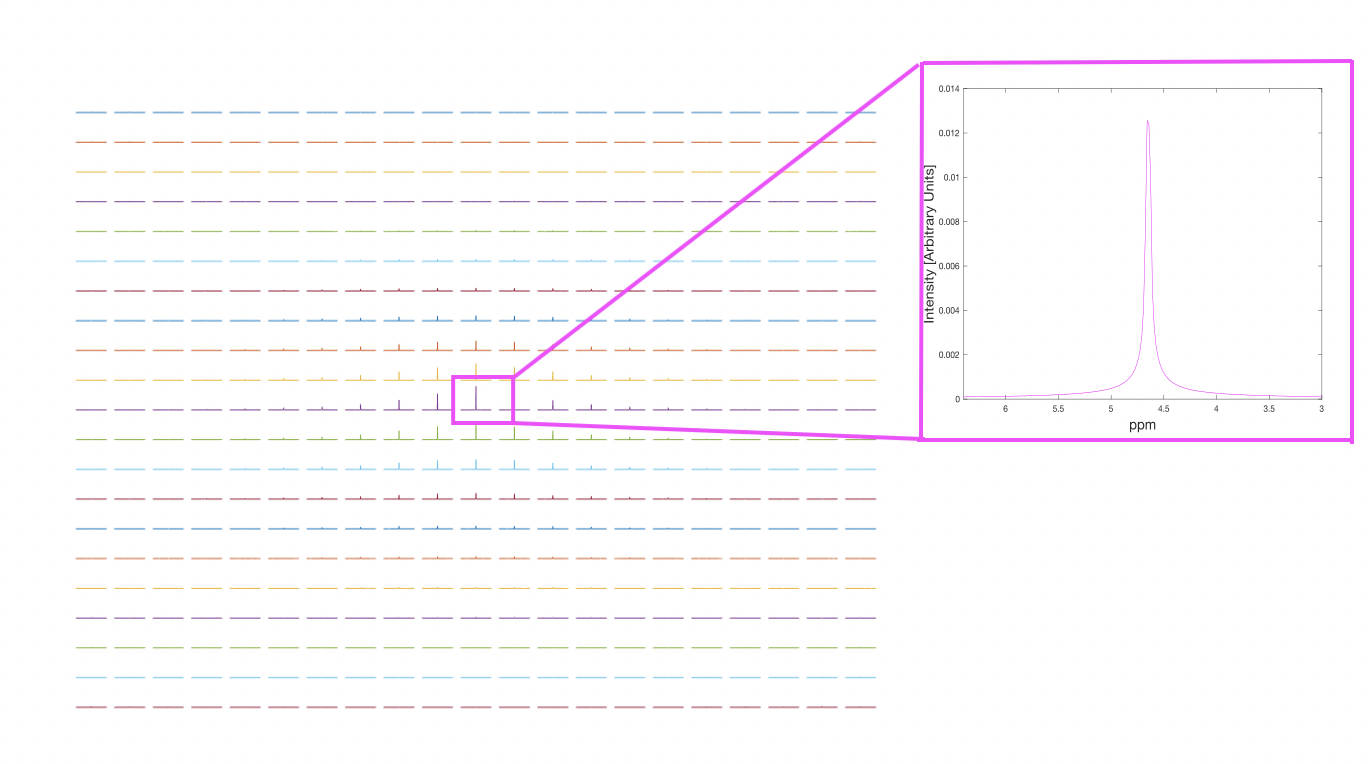
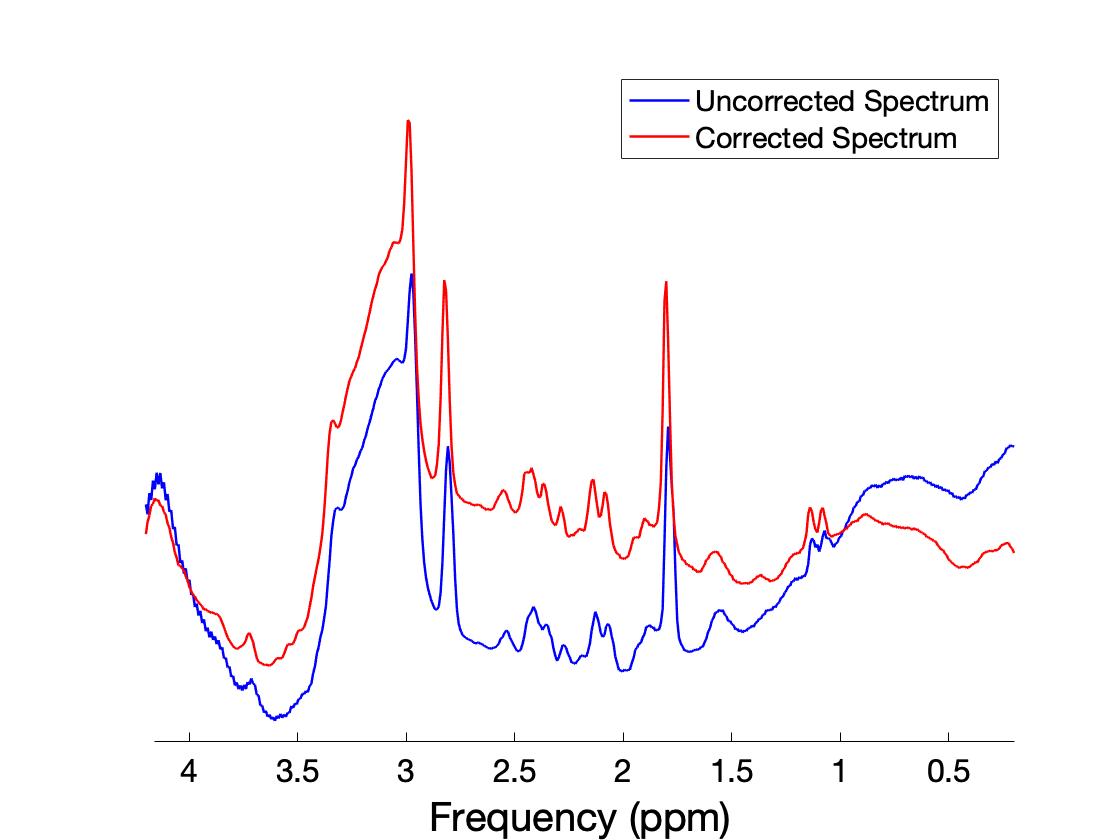
Results of the whole phantom frequency and phase drift measurement are shown in Figure 2. The resonant frequency drifted approximately linearly by 4.6Hz and the phase drift ranged from -3° to 4.8° across all scans during the 6-minute acquisition duration. All 288 k=0 FIDs (32 shots x 9 averages) and their corresponding spectra before and after drift correction are shown in Figure 3. Spectral registration resulted in a noticeable improvement in the alignment of k=0 FIDs and spectral peaks. Figure 4 shows a reconstructed map of water unsuppressed spectra throughout the MRSI grid, as well as an enlarged view from a selected region of interest. Figure 5 shows spectra from the same region of interest as in Figure 4, both with and without frequency and phase drift correction, and following HLSVD water removal. These corrections resulted in a visual improvement in the lineshape of glutamate, NAA and lactate peaks. Future work will include implementing water suppression and drift correction in acquired in-vivo data to capture the additional motion-related frequency and phase variations that are not seen in phantom results.Conclusion
Frequency drift induced by heating of gradient coils and passive shimming can unfavourably affect the processing of acquired MRS data. This study demonstrated the implementation of a rosette MRSI sequence, and the application of time-domain spectral registration to estimate and correct frequency and phase drifts in acquired rosette MRSI data.Acknowledgements
This study was funded by CIHR and NSERC (Dr. Jamie Near), and a Healthy Brains for Healthy Lives graduate student fellowship (Sneha Vaishali Senthil).References
1. Bogner W, Otazo R, Henning A. Accelerated MR spectroscopic imaging-a review of current and emerging techniques. NMR Biomed. 2021;34(5):e4314.
2. Near J, Edden R, Evans CJ, Paquin R, Harris A, Jezzard P. Frequency and phase drift correction of magnetic resonance spectroscopy data by spectral registration in the time domain. Magn Reson Med. 2015;73(1):44-50.
3. Foerster BU, Tomasi D, Caparelli EC. Magnetic field shift due to mechanical vibration in functional magnetic resonance imaging. Magn Reson Med 2005;54:1261-7.
4. Rowland BC, Liao H, Adan F, Mariano L, Irvine J, Lin AP. Correcting for Frequency Drift in Clinical Brain MR Spectroscopy. J Neuroimaging. 2017;27(1):23-28.
5. Simpson R, Devenyi GA, Jezzard P, Hennessy TJ, Near J. Advanced processing and simulation of MRS data using the FID appliance (FID-A)-An open source, MATLAB-based toolkit. Magn Reson Med. 2017;77(1):23-33.
6. Bagchi S, Mitra SK. The nonuniform discrete Fourier transform and its applications in filter design. I. 1-D. IEEE Trans Circuits Syst II Analog Digital Signal Process 1996;43(6):422-433.
7. Rasche V, Proksa R, Sinkus R, Bornert P, Eggers H. Resampling of data between arbitrary grids using convolution interpolation. IEEE Trans Med Imaging 1999;18(5):385-392.
Figures