2542
Measurement of gastric emptying with dynamic 3D DMI using a deuterium body array at 7 T1Department of Radiology, University Medical Center Utrecht, Utrecht, Netherlands
Synopsis
Gastric emptying abnormalities are frequently observed in diabetes patients. Here we explored whether dynamic 3D DMI could be a radiation-free alternative for scintigraphy to measure the gastric emptying rate. One volunteer was scanned after oral intake of deuterated glucose and proximal and distal gastric emptying was monitored. The distribution of the glucose load in the proximal and distal parts of the stomach and the rate of gastric emptying agreed well with scintigraphy results. DMI has potential to investigate gastric emptying abnormalities in patients with diabetes, while at the same time providing information on glucose uptake and metabolism in the liver.
Introduction
Gastric emptying is the process of nutrients moving from the stomach into the duodenum at a regulated rate1. Gastric emptying abnormalities are frequently observed in diabetes and include both slow/delayed and fast gastric emptying2. While delayed gastric emptying can cause hypoglycemia in diabetes patients using exogenous insulin, rapid gastric emptying is emerging as major determinant of postprandial hyperglycemia2. The current gold standard for the assessment of gastric emptying is scintigraphy3. Deuterium metabolic imaging (DMI)4–10 with deuterated glucose could potentially be used as a radiation-free alternative to assess gastric emptying, while at the same time providing information on glucose uptake and metabolism in surrounding tissues, such as the liver.Previously, we have demonstrated the feasibility of monitoring liver glucose uptake and metabolism with DMI using a dedicated 4-channel deuterium body array at 7T. In the current study, we measured gastric emptying with dynamic 3D DMI using the same setup.
Methods
The study was approved by the local medical ethics committee. DMI measurements were performed at a 7T whole-body MRI system (Philips Healthcare, Best, Netherlands), with a dedicated setup consisting of 4 deuterium (2H) transmit/receive loop coils and 4 proton (1H) transmit/receive dipole antennas. Image-based B0 shimming and acquisition of coronal and axial T1w reference images for DMI planning were performed with the 1H antennas. DMI measurements were performed with a pulse-acquire sequence using a 1 ms block pulse, followed by phase encoding gradients for 3D spatial encoding, and TE/TR=1.95/333 ms, nominal voxel size=30x30x30 mm3, matrix size=8(AP)x10(LR)x9(FH), NSA=4, and temporal resolution=5:08 min. DMI acquisitions were made using a Hamming-weighted k-space acquisition pattern. No respiratory gating was applied.One healthy volunteer was scanned after an overnight fast. A load of 50 grams of [6,6’-2H2]glucose was dissolved in 200 ml water and administered orally through a tube while the subject was laying in the scanner. Two baseline scans at natural abundance were acquired before deuterated glucose intake and DMI scans were continued up to 130 min after intake.
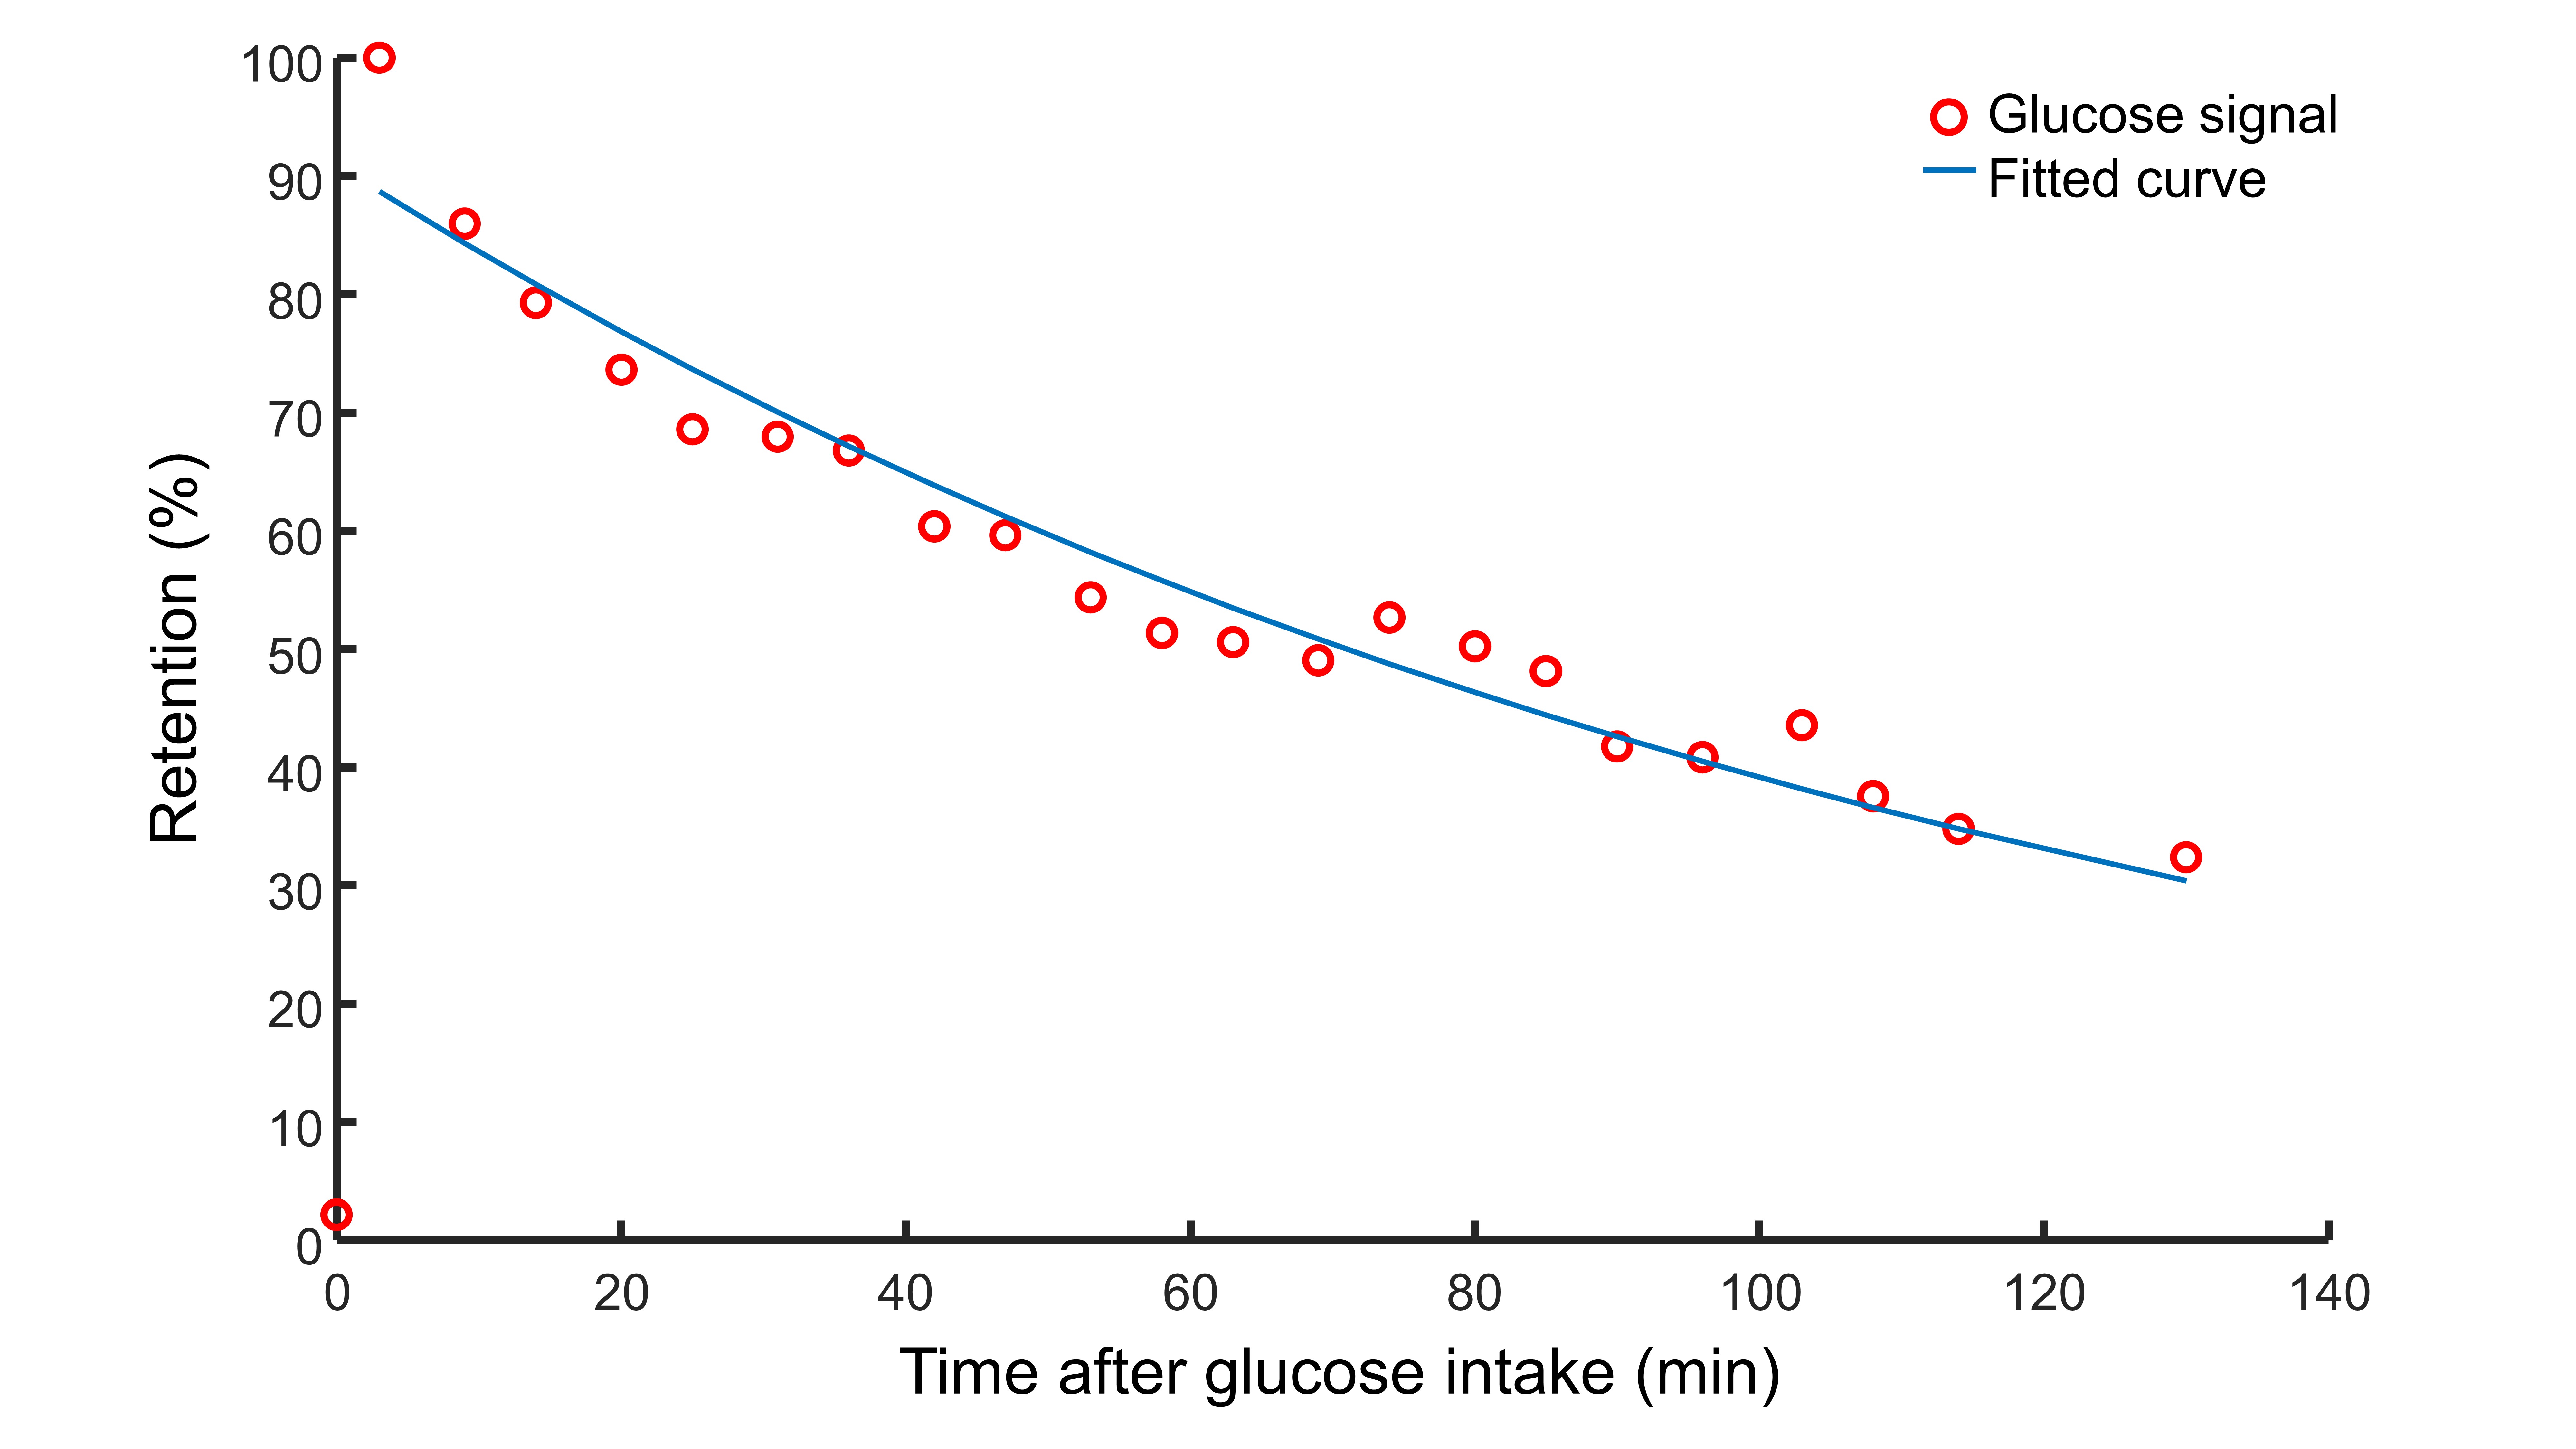
Reconstruction and processing of the raw DMI data was performed with an in-house written MATLAB script (MathWorks, Natick, MA, USA). Channel combination was performed using the Roemer equal noise algorithm11. The deuterated glucose signal (3.8 ppm) was fitted using AMARES12. Glucose maps were created using the amplitude of the fitted glucose signals. Axial T1w images were used to draw ROI’s for proximal and distal parts of the stomach and the sum of the two ROI’s was used as total stomach ROI. Glucose signal amplitudes were added within each ROI, and the glucose signal in the first measurement after glucose intake in the total stomach ROI was set to 100%. For the total stomach ROI, the time course of glucose signal amplitudes was fitted to a mono-exponential function to determine the emptying half time (T50).
Results
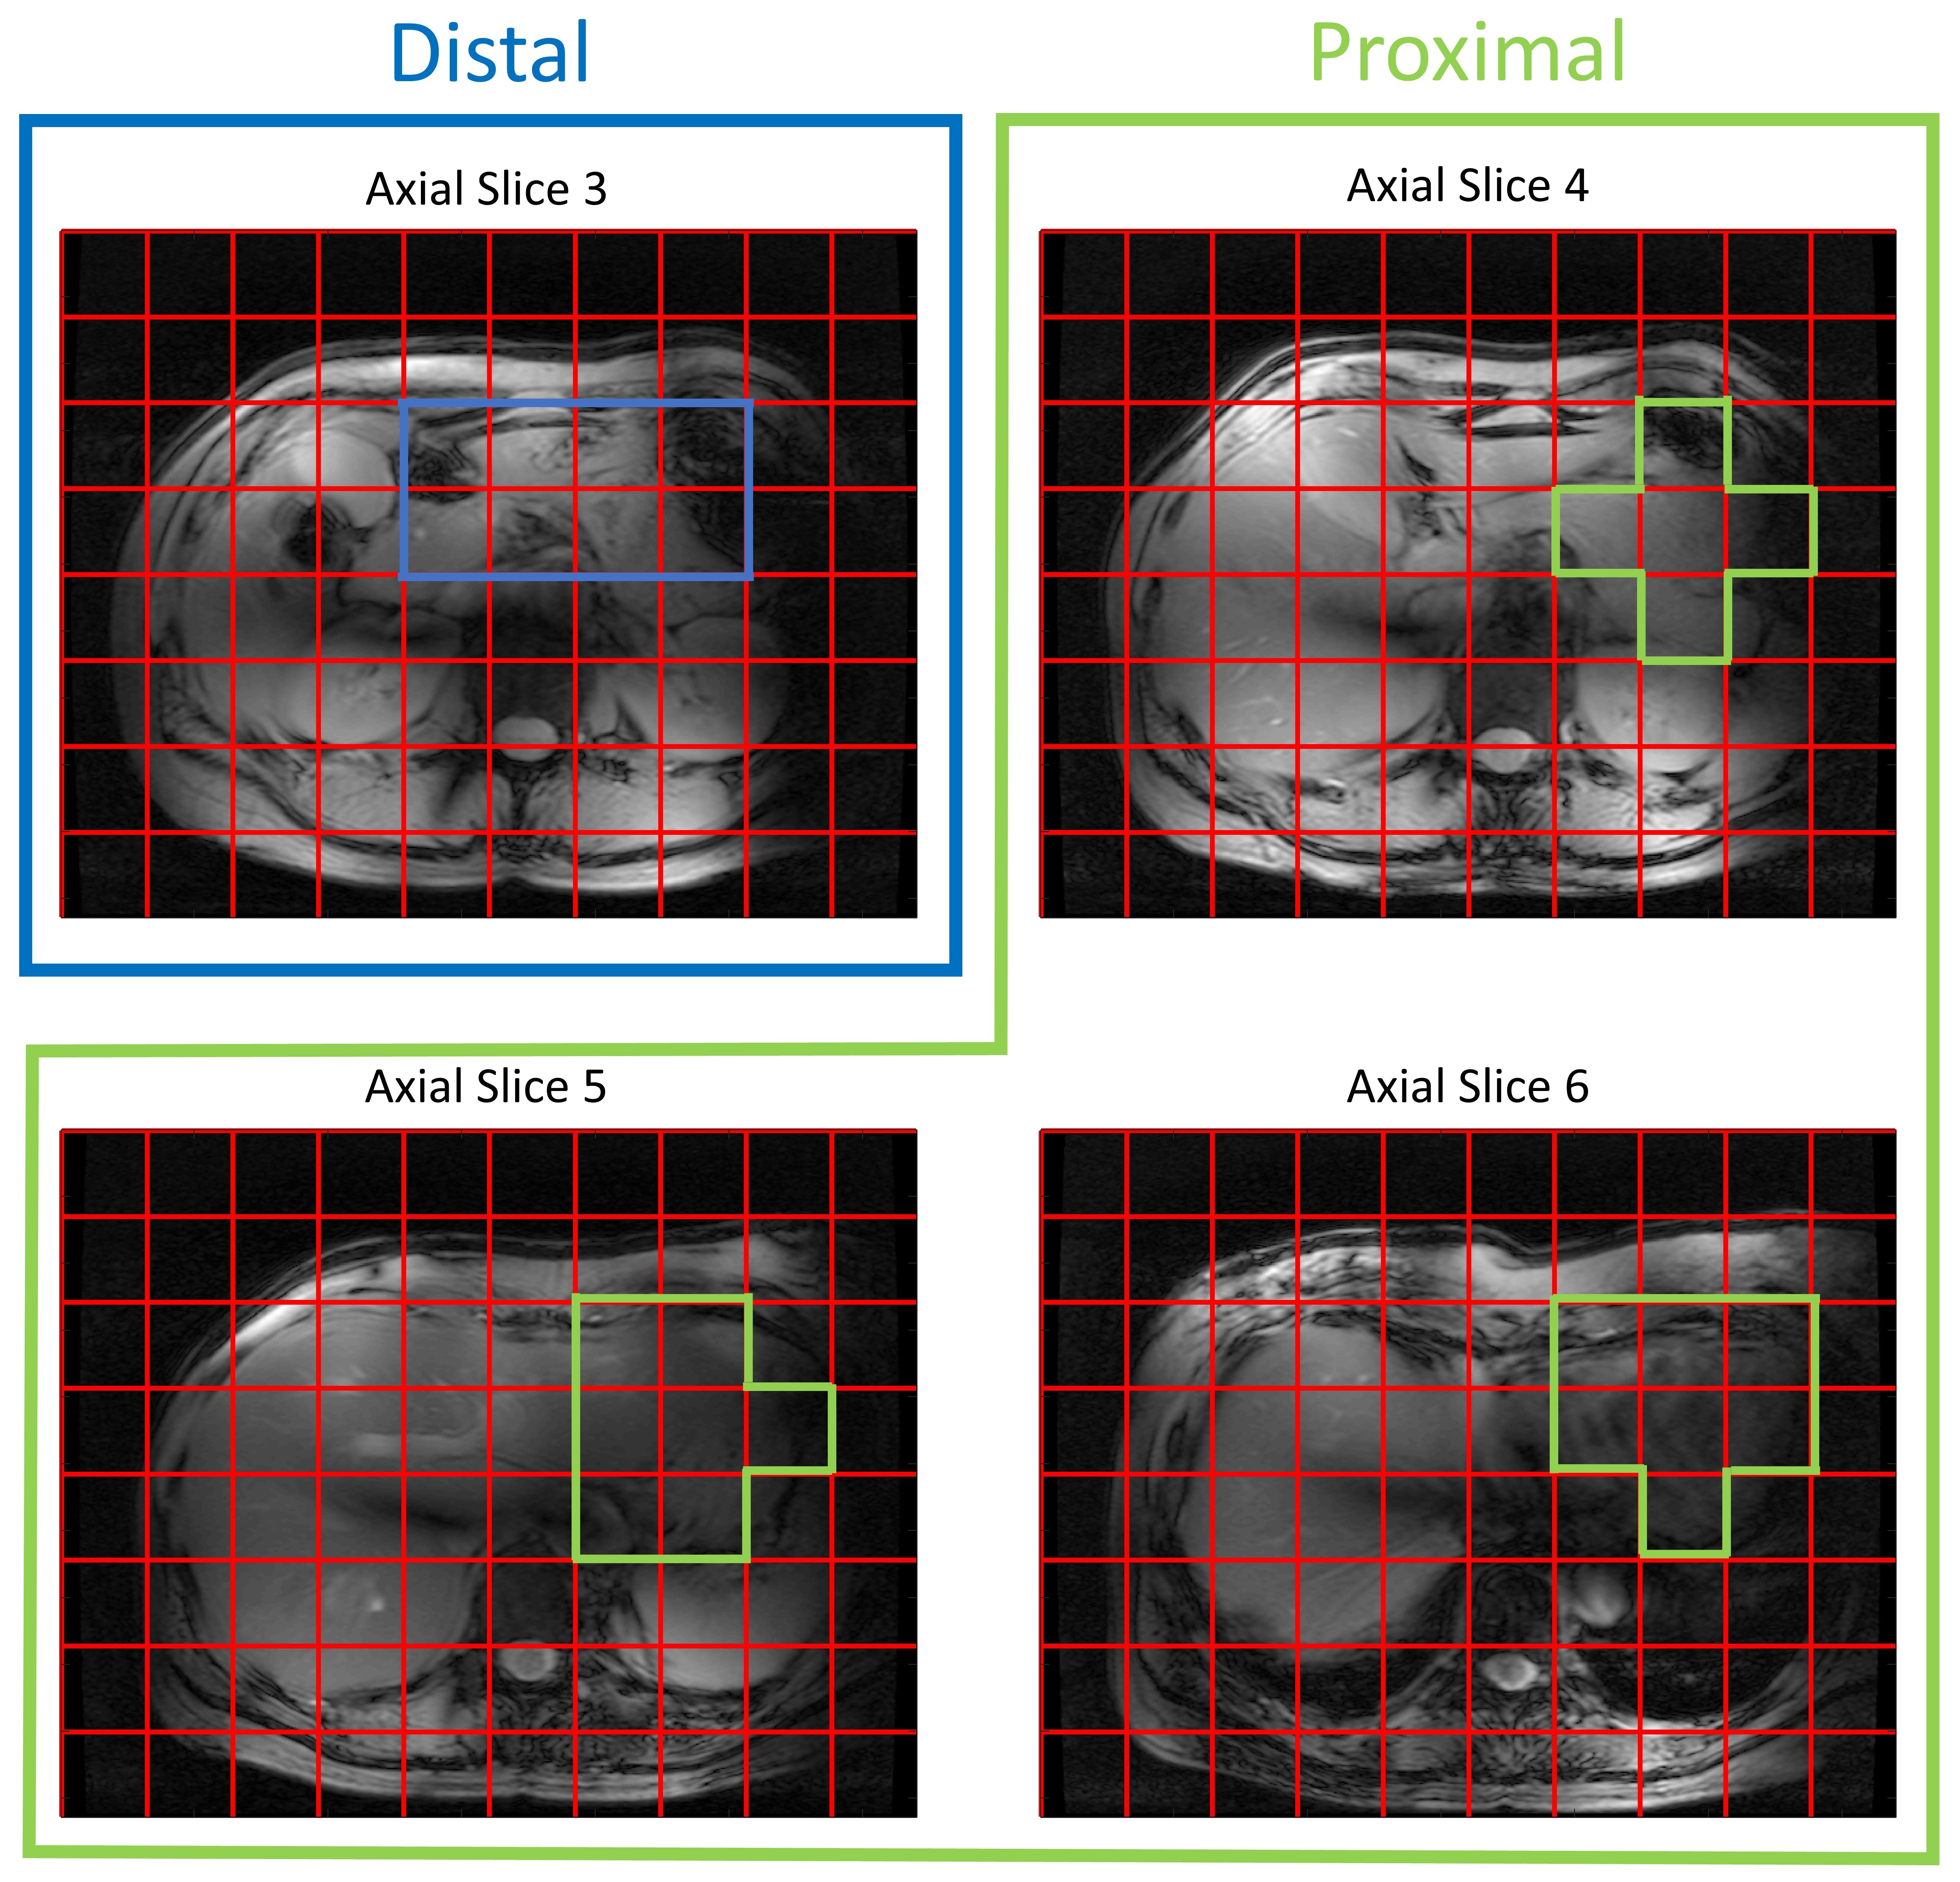
A very strong deuterated glucose signal was observed in the proximal part of the stomach immediately after administration of deuterated glucose and, although it was slowly decreasing thereafter, the glucose signal stayed high until the last measurement at 130 min after glucose intake (Figures 1 and 2). In contrast, in the distal stomach the glucose signal disappeared almost completely 20 min after intake (Figure 2). Figure 3 shows the ROI’s for the proximal and distal parts of the stomach on the T1w axial images. Figure 4 shows the distribution and time courses of glucose signal in the proximal and distal parts of the stomach, relative to the total stomach glucose signal. About 80% of the glucose signal was initially observed in the proximal stomach, which then decreased more or less linearly over time. In the distal stomach, the glucose signal decayed rapidly during the first 20 min and then remained at a constant low value (~7%) up to 130 min. For the total stomach glucose signal, the fitted T50 was 80 min (Figure 5).Discussion and Conclusion
We demonstrated the measurement of gastric emptying with dynamic 3D DMI. Using scintigraphy, it has been shown that both the nutrient load and the volume of the load affects the gastric emptying rate, as the regulation is dependent on the amount of calories entering the duodenum13,14. Moreover, intragastric distribution of a labeled glucose drink is different between seated and lying positions, and especially the distal gastric emptying rate is affected by posture15. However, it was shown that the overall gastric emptying rate is not significantly different for seated and lying positions15. Compared to a scintigraphy study in seated subjects using a similar glucose load and volume as in our study, we observed a slightly shorter T50 for the whole stomach (80 vs 103 min)16. The intragastric distribution of the glucose load and the different patterns for proximal and distal gastric emptying agree well with scintigraphy results of subjects in a lying position15.In conclusion, dynamic 3D DMI allows monitoring of proximal and distal gastric emptying without radiation burden. This technique could be applied to investigate gastric emptying abnormalities in patients with diabetes, and results can be linked directly to hepatic glucose uptake and metabolism, through simultaneous measurement with a deuterium body array setup.
Acknowledgements
This work was funded by a HTSM grant from NWO TTW (project number 17134) and by a FET Innovation Launchpad grant from the EU (grant number 850488).References
1.Hellström PM, Grybäck P, Jacobsson H. The physiology of gastric emptying. Best Pract Res Clin Anaesthesiol. 2006;20(3):397-407. doi:10.1016/j.bpa.2006.02.002
2.Goyal RK. Gastric Emptying Abnormalities in Diabetes Mellitus. Longo DL, ed. N Engl J Med. 2021;384(18):1742-1751. doi:10.1056/nejmra2020927
3.Griffith GH, Owen GM, Kirkman S, Shields R. Measurement of rate of gastric emptying using chromium-51. Lancet. 1966;287(7449):1244-1245. doi:10.1016/s0140-6736(66)90247-9
4.De Feyter HM, Behar KL, Corbin ZA, et al. Deuterium metabolic imaging (DMI) for MRI-based 3D mapping of metabolism in vivo. Sci Adv. 2018;4(8):1-12. doi:10.1126/sciadv.aat7314
5.Lu M, Zhu XH, Zhang Y, Mateescu G, Chen W. Quantitative assessment of brain glucose metabolic rates using in vivo deuterium magnetic resonance spectroscopy. J Cereb Blood Flow Metab. 2017;37(11):3518-3530. doi:10.1177/0271678X17706444
6.Kreis F, Wright AJ, Hesse F, Fala M, Hu DE, Brindle KM. Measuring tumor glycolytic flux in vivo by using fast deuterium MRI. Radiology. 2020;294(2):289-296. doi:10.1148/radiol.2019191242
7.Riis-Vestergaard MJ, Laustsen C, Mariager CØ, Schulte RF, Pedersen SB, Richelsen B. Glucose metabolism in brown adipose tissue determined by deuterium metabolic imaging in rats. Int J Obes. 2020;44(6):1417-1427. doi:10.1038/s41366-020-0533-7
8.De Feyter HM, Thomas MA, Behar KL, de Graaf RA. NMR visibility of deuterium-labeled liver glycogen in vivo. Magn Reson Med. 2021;86(1):62-68. doi:10.1002/mrm.28717
9.Hesse F, Somai V, Kreis F, Bulat F, Wright AJ, Brindle KM. Monitoring tumor cell death in murine tumor models using deuterium magnetic resonance spectroscopy and spectroscopic imaging. Proc Natl Acad Sci U S A. 2021;118(12):e2014631118. doi:10.1073/pnas.2014631118
10.von Morze C, Engelbach JA, Blazey T, et al. Comparison of hyperpolarized 13C and non-hyperpolarized deuterium MRI approaches for imaging cerebral glucose metabolism at 4.7 T. Magn Reson Med. 2021;85(4):1795-1804. doi:10.1002/mrm.28612
11.Roemer PB, Edelstein WA, Hayes CE, Souza SP, Mueller OM. The NMR phased array. Magn Reson Med. 1990;16(2):192-225. doi:10.1002/mrm.1910160203
12.Vanhamme L, Van Den Boogaart A, Van Huffel S. Improved Method for Accurate and Efficient Quantification of MRS Data with Use of Prior Knowledge. J Magn Reson. 1997;129(1):35-43. doi:10.1006/jmre.1997.1244
13.Gentilcore D, Hausken T, Horowitz M, Jones KL. Measurements of gastric emptying of low- and high-nutrient liquids using 3D ultrasonography and scintigraphy in healthy subjects. Neurogastroenterol Motil. 2006;18(12):1062-1068. doi:10.1111/j.1365-2982.2006.00830.x
14.Jones KL, O’Donovan D, Russo A, et al. Effects of drink volume and glucose load on gastric emptying and postprandial blood pressure in healthy older subjects. Am J Physiol - Gastrointest Liver Physiol. 2005;289(2):G240-G248. doi:10.1152/ajpgi.00030.2005
15.Jones KL, O’Donovan D, Horowitz M, Russo A, Lei Y, Hausken T. Effects of posture on gastric emptying, transpyloric flow, and hunger after a glucose drink in healthy humans. Dig Dis Sci. 2006;51(8):1331-1338. doi:10.1007/s10620-005-9010-3
16.Frank JW, Saslow SB, Camilleri M, Thomforde GM, Dinneen S, Rizza RA. Mechanism of accelerated gastric emptying of liquids and hyperglycemia in patients with type II diabetes mellitus. Gastroenterology. 1995;109(3):755-765. doi:10.1016/0016-5085(95)90382-8
Figures