2538
Does Magnetic Resonance Spectroscopy Show Changes in Brain Metabolites At 3-Months Post Concussion in Pediatric Patients?1University of Calgary, Calgary, AB, Canada, 2Radiology, University of Calgary, Calgary, AB, Canada, 3Psychology, University of Montreal, Montreal, QC, Canada, 4Psychology, Ste Justine Hospital, Montreal, QC, Canada, 5Pediatrics, University of Alberta, Edmonton, AB, Canada, 6Pediatrics, Stollery Children's Hospital, Edmonton, AB, Canada, 7Pediatrics, University of British Columbia, Vancouver, BC, Canada, 8Pediatrics, BC Children's Hospital, Vancouver, AB, Canada, 9Pediatrics and Emergency Medicine, University of Ottawa, Ottawa, ON, Canada, 10Pediatrics and Emergency Medicine, Children's Hospital of Eastern Ontario, Ottawa, ON, Canada, 11Psychology, University of Calgary, Calgary, AB, Canada
Synopsis
This study uses 1H magnetic resonance spectroscopy (MRS) to determine metabolite differences in the chronic phase (~3-month) of pediatric concussion compared to orthopedic injury (OI) controls. In the first analysis, significant differences in N-acetylaspartate (NAA), choline (Cho) and inositol (Ins) were seen between concussion and OI controls. Secondly, in a series of 3-way ANCOVAs across OI, symptomatic and asymptomatic concussion groups showed group differences in NAA, Cho and Ins depending on the symptom scale. When metabolites were different in this analysis by symptoms, it was generally driven by the asymptomatic group.
Introduction
Incidence of concussion is rising and 20% of youth have been diagnosed with concussion [1]. To better understand concussion and its recovery, this study examines MRS data collected at 3-months post-injury. It first compares concussion with orthopedic injury (OI) controls and secondly divides the concussion group into symptomatic and asymptomatic groups.Methods
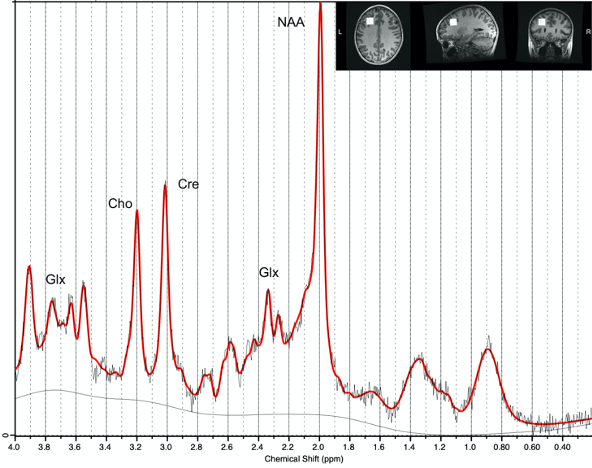
Data were collected as part of the Advancing Concussion Assessment in Pediatrics study that collected data at five sites and included children ages 8-16.99 years with concussion or OI [2]. Data in the current analysis was collected at 3 months post-injury.MRS data were acquired at 3T (3 GE, 3 Siemens scanners) using a short-echo PRESS sequence (TR/TE=2s/30 ms, 96 averages, voxel size 222cm3) in a single-voxel in the left dorsolateral prefrontal cortex. Data were pre-processed using FID-A [3], though minimal processing was possible on the Siemens data as transients had previously been averaged [4]. Data were fit using LCModel [5] using customized basis sets for each scanner vendor. Data were then tissue corrected to quantify total N-acetylaspartate (NAA), total creatine (Cr), total choline (Cho), Glx (glutamate+glutamine) and inositol (Ins).
The first analysis compared concussion and OI controls using ANCOVA models for each metabolite with age, sex, and scanner (6 levels) as covariates.
For the second analysis, the concussion group was divided into asymptomatic and symptomatic based on the reliable change index (RCI) of the Health and Behaviour Inventory scores (HBI) [6]. The HBI assesses cognitive and somatic symptoms using child and parental reports and has four metrics (child-cognitive, child-somatic, parent-cognitive and parent-somatic). The RCI is a psychometric criterion to evaluate whether a change over time of an individual score relative to a retrospective pre-injury rating is statistically significant and can be used to indicate recovery or persistence of symptoms. To detect differences between OI, concussion-asymptomatic, and concussion-symptomatic groups, 3-way ANCOVA models were used including age, sex and scanner as covariates and follow-up paired comparisons. Models were run on each metabolite and each symptom assessment independently.
Results
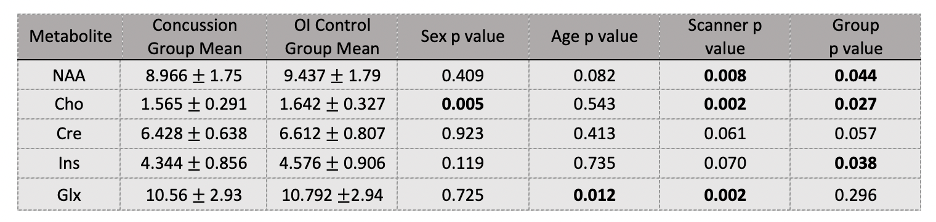
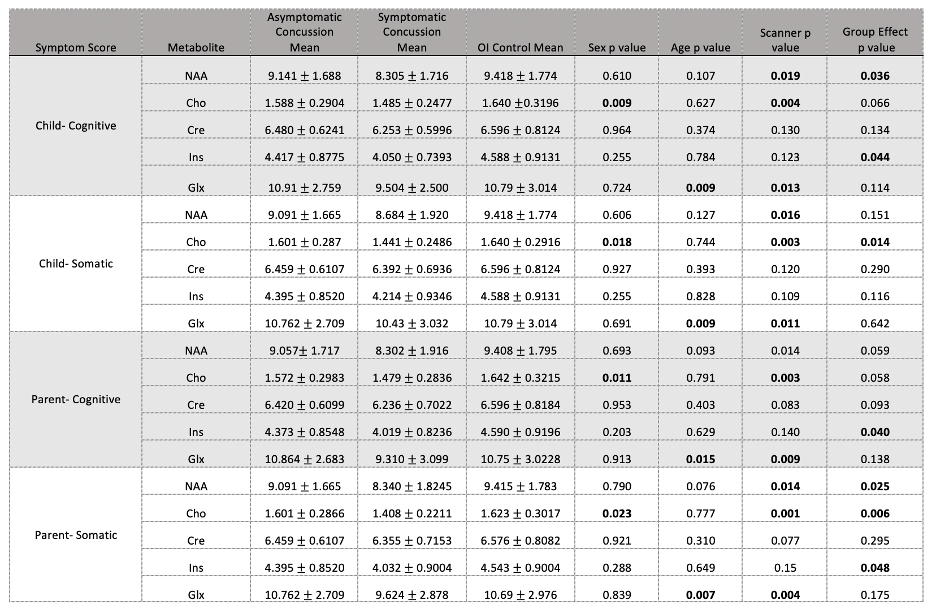
In the first analysis (Table 1), 145 concussion and 71 OI controls were included. Significant group differences were found for NAA (F(1,4)=4.019, p=0.044), Cho (F(1,4)=4.985, p=0.027) and Ins (F(1,4)=4.344, p=0.038); all metabolites were lower in the concussion group. There was a trend of lower Cr in concussion (F(1,4)=3.671, p=0.057). The second series of analyses are reported by each symptom assessment (Tables 2 and 3).1. Child-Cognitive
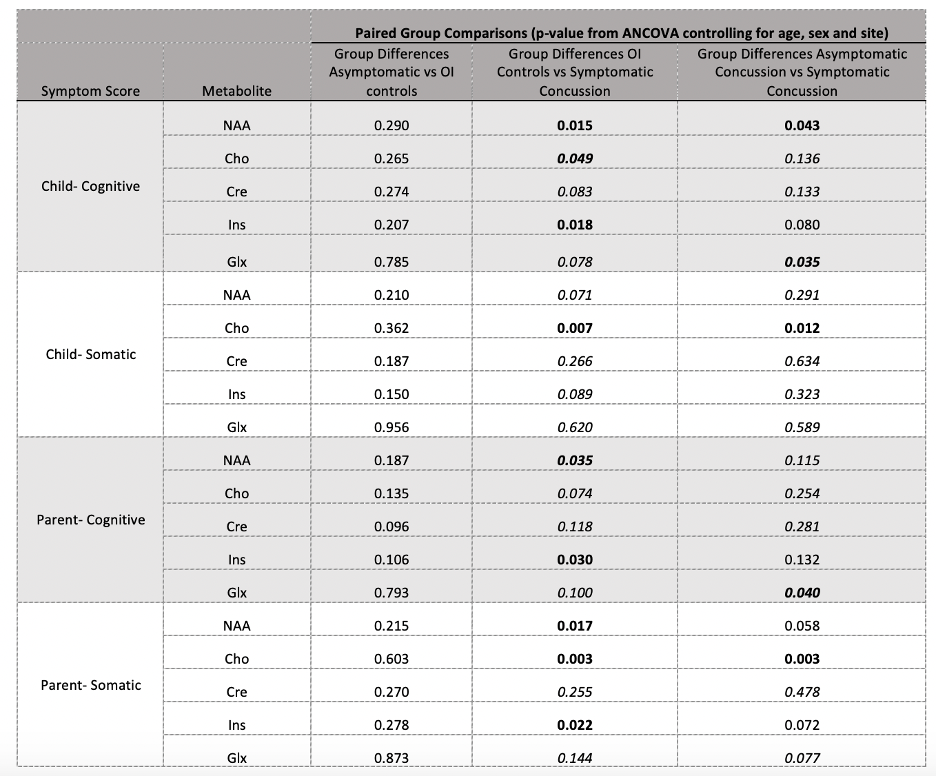
Data from 119 asymptomatic concussion, 20 symptomatic concussion and 69 OI controls were included. There were significant group differences for NAA (F(2,5)=3.367, p=0.036) and Ins (F(2,5)=3.172, p=0.044). Follow-up paired comparisons showed significant differences between OI and symptomatic concussion for Ins (F1,1)=5.806, p=0.018) and NAA (F(1,1)=6.190, p=0.015), and for NAA between symptomatic and asymptomatic concussion (F(1,1)=4.186, p=0.043). Given the group differences in the first analysis, as an exploratory investigation, paired comparisons were performed for Cho and Glx and showed differences between the symptomatic concussion and the OI for Cho (F(1,1)=3.987, p=0.049) and Glx (F(1,1)=4.534, p=0.035).
2. Child-Somatic
Data from 120 asymptomatic concussion, 15 symptomatic concussion and 68 OI controls were included. There were significant group differences for Cho (F(2,5)=4.349, p=0.014). Follow-up paired comparisons showed significant differences between OI and symptomatic concussion (F(1,1)=6.477, p=0.007), and between symptomatic and asymptomatic concussion (F(1,1)=4.186, p=0.012).
3. Parent-Cognitive
Data from 115 asymptomatic concussion, 24 symptomatic concussion and 69 OI controls were included. There were significant group differences for Ins (F(2,5)=3.260, p=0.040). Follow-up paired comparisons showed a significant difference between OI and symptomatic concussion F(1,1)=4.898, p=0.030). Exploratory comparisons also showed NAA differences between the symptomatic concussion group and the OI group (F(1,1)=4.598, p=0.035) and Glx differences between the symptomatic and asymptomatic concussion groups (F(1,1)=4.318, p=0.040).
4. Parent-Somatic
Data from 119 asymptomatic concussion, 22 symptomatic concussion and 68 OI controls were included. There were significant group differences for NAA (F(2,5)=3.758, p=0.025), Cho (F(2,5)=5.299, p=0.006), and Ins (F(2,5)=3.075, p=0.048). Paired comparisons for NAA showed significant differences between OI and symptomatic concussion (F(1,1)=5.971, p=0.017) and trend level differences between symptomatic and asymptomatic concussion (F(1,1)=3.643, p=0.058). Ins (F(1,1)=4.434, p=0.022) and Cho (F (1,1)=9.529, p=0.003) showed group differences between OI and symptomatic concussion and Cho showed significant differences between symptomatic and asymptomatic concussion (F(1,1)=8.944, p=0.003).
In all cases of group differences for each symptom assessment, metabolites were lower in symptomatic concussion group.
Discussion
This study includes the largest spectroscopy data set collected in pediatric concussion. At 3-months following injury, group differences were seen between concussion and OI groups in NAA, Cho and Ins with trend level differences in Cr. These group differences appear to be driven by those with persistent concussion symptoms though there is heterogeneity between the different symptom metrics. Examining metabolite differences in symptomatic and asymptomatic pediatric concussion in the chronic phase (>3months) post-injury contributes to our understanding of concussion and the pathophysiology of those whose symptoms resolve and those with persistent symptoms.Acknowledgements
Pediatric Emergency Research Canada (PERC)References
1. Concussion.org. (2020, February 27). Concussion Resources & Facts. Retrieved November 2, 2021, from https://www.concussion.org/concussion-resources/
2. Yeates et al. Advancing Concussion Assessment in Pediatrics (A-CAP): a prospective, concurrent cohort, longitudinal study of mild traumatic brain injury in children: protocol study BMJ Open 2017; 7(7): e017012.
3. Simpson et al. Advanced processing and simulation of MRS data using the FID appliance (FID-A)-An open source, MATLAB-based toolkit Magn Reson Med. 2017; 77(1):23-33.
4. Near et al. Preprocessing, analysis and quantification in single-voxel magnetic resonance spectroscopy: experts' consensus recommendations NMR Biomed. 2021; 34(5): e4257.
5. Provencher. Estimation of metabolite concentrations from localized in vivo proton NMR spectra Magn Reson Med. 1993;30(6):672-9.
6. Iverson G.L. (2017) Reliable Change Index. In: Kreutzer J., DeLuca J., Caplan B. (eds) Encyclopedia of Clinical Neuropsychology. Springer, Cham. https://doi.org/10.1007/978-3-319-56782-2_1242-2
Figures