2537
GABA and Glutamate response to social processing; a functional MRS study
Duanghathai Pasanta1,2, David J. White3, Jason L. He1, Nicolaas A. Puts1,4, and Talitha Ford3,5
1Department of Forensic and Neurodevelopmental Sciences, Sackler Institute for Translational Neurodevelopment, Institute of Psychiatry, Psychology, and Neuroscience, King's College London, London, United Kingdom, 2Department of Radiologic Technology, Faculty of Associated Medical Sciences, Chiang Mai University, Chiang Mai, Thailand, 3Centre for Human Psychopharmacology & Swinburne Neuroimaging, School of Health Sciences, Swinburne University of Technology, Melbourne, Australia, 4MRC Centre for Neurodevelopmental Disorders, King’s College London, London, United Kingdom, 5Cognitive Neuroscience Unit, Faculty of Health, Deakin University, Geelong, Australia
1Department of Forensic and Neurodevelopmental Sciences, Sackler Institute for Translational Neurodevelopment, Institute of Psychiatry, Psychology, and Neuroscience, King's College London, London, United Kingdom, 2Department of Radiologic Technology, Faculty of Associated Medical Sciences, Chiang Mai University, Chiang Mai, Thailand, 3Centre for Human Psychopharmacology & Swinburne Neuroimaging, School of Health Sciences, Swinburne University of Technology, Melbourne, Australia, 4MRC Centre for Neurodevelopmental Disorders, King’s College London, London, United Kingdom, 5Cognitive Neuroscience Unit, Faculty of Health, Deakin University, Geelong, Australia
Synopsis
We performed functional magnetic resonance spectroscopy (fMRS) to measure the dynamic response of GABA and Glutamate in the superior temporal sulcus (STS) and visual cortex (V1) while viewing social stimuli. MEGA-PRESS fMRS spectra were analyzed in both block and event-related design. Sliding window analyses were used to investigate GABA and Glutamate dynamics at higher temporal resolution. A small decrease in GABA level was observed during stimulus presentation in V1, but no change was observed in STS. We highlight the feasibility of using fMRS to assess changes in metabolite response during social processing in health and disease.
INTRODUCTION
Several studies have suggested that abnormal social processing in multiple psychiatric conditions (e.g. autism) is associated with a decrease in GABA and Glutamate1–3. This has so far only been studied in associative paradigms (metabolites at rest). While resting-state associations can be insightful, the neurometabolic response of GABA and glutamate is altered in these conditions during social processing may inform altered neurochemical responses in more depth. Thus far, there have been no attempts to determine whether changes in metabolite levels are detectable using fMRS during social processing. Here, we performed Functional Magnetic Resonance Spectroscopy (fMRS) in healthy individuals to assess the temporal GABA+ (GABA + macromolecules) and Glx (Glutamate + Glutamine) response during social processing in-vivo, with a paradigm allowing for assessment in both block and event-related responses.METHODS
MRS acquisitionData were acquired from 13 healthy adults aged 18-40 years. fMRS was performed on a Siemens Trio 3T MRI scanner using the MEGA-PRESS sequence (TE/TR 68/2000 ms). Voxels were placed in the right superior temporal sulcus (STS) (4x3x2 cm3), and visual cortex (V1) (3x3x3 cm3). During fMRS, participants viewed four stimulus blocks (fixation cross, social, fixation cross, non-social), which was repeated for both STS and V1 voxels (Fig.1). The first (256 transients) and third block (200 transients) were rest blocks. Within each functional block (second and fourth blocks, 200 transients each), social stimuli were presented as sub-blocks (24 s stimulus-ON, 16 s stimulus-OFF), making these data a combined block and event-related design.
Data analysis
Using an in-house modified version of Gannet5, data were pre-processed and fit using standard frequency and phase-correction and fitting approaches within-block and expressed relative to creatine6. Static window analysis: Data were analysed in blocks of rest (REST1 and REST2) and functional (FUNC1 and FUNC2). Because each functional block contains both stimulus-ON and stimulus-OFF blocks, we further analysed differences within-block by comparing TR periods corresponding to stimulus-ON and stimulus-OFF, allowing for event-related analysis7. Sliding window analysis: Metabolite levels were calculated by averaging the signal over a window width of 50 transients irrespective of stimulus condition with a step size of 5 transients. Statistics: Data were analyzed in R (Version 4.1.1). Data between block (static) and between each time-point and rest (sliding window, Bonferroni-corrected for multiple comparisons) were compared using Wilcoxon signed-rank analysis. Change from zero was assessed by estimating difference from the 95% confidence interval of the rest data. A changepoint analysis (R mcp8 package) was performed on sliding window data to assess fluctuations in metabolite levels.
RESULTS
Static window analysisBased on MRS block, we estimated GABA+/tCr and Glx/tCr and found no change between functional and rest blocks (Fig.2, p > 0.1) We further investigated transients corresponding to stimulus-ON and stimulus-OFF TRs regardless of stimulus type. GABA+/tCr appeared to increase in STS during stimulus-OFF throughout the experiment, but this did not reach statistical significance (Fig.3A, p = 0.12). However, GABA+/tCr in V1 decreased weakly significantly (R -0.28, p = 0.05) during stimulus-ON TRs (Fig.3B).
Sliding window analysis
Overall, we observed a fluctuation of metabolite level with time, and we note when the 95% confidence interval did not overlap with zero (GABA or Glx at REST1). GABA+/tCr was reduced in the second functional block when compared to other blocks in V1 (Fig.4). V1 Glx appeared to fluctuate but not consistently. We found no statistically significant change after Bonferroni correction. We saw a slight increase in GABA+/tCr and Glx/tCr during the second rest and functional block for STS (Fig.5), but observed no statistically significant change. Based on changepoint analysis GABA appeared to reduce in V1, consistent with block design analysis, GABA+ and Glx changed in the latter end of block two in STS. We did not observe any differences in face versus object stimulation in any of the analyses.
DISCUSSION AND CONCLUSION
An observed reduction in GABA in V1 was shown using both block analysis in stimulus-ON TRs and in the second functional block as analysed with sliding window analysis; this reduction could reflect deactivation of GABA production or increased re-uptake of GABA with repeated stimulation allowing for induction of plasticity after repeated visual stimulation (irrespective of social context)9,10 and is consistent with recent animal work11. The response in STS was not particularly strong and no change was observed for Glx.We did not observe differences between faces or objects and thus, our findings likely reflect neurochemical responses to ‘basic’ visual processing rather than social processing per se. Our findings additionally suggest a “lag” in the metabolite response to stimulation, and differences in the timing of the responses between regions12,13. Another likely explanation for the lack of the response (especially for Glx) is that stimuli are simply not salient enough to elicit a metabolite response in STS with sufficient SNR to be measured with MRS.
We believe this is the first fMRS study to investigate regional changes in GABA and glutamate levels during a social processing task. In future work, we aim to use more sophisticated analytical approaches, such as incorporating metabolite-lag as a function of time. Rather than simple fitting, linear combination and single-average approach may also be more sensitive to changes in metabolite.
Acknowledgements
Functional MRS data were previously acquired from a collaborator site (Centre for Human Psychopharmacology, Swinburne University of Technology, Australia). This study was funded by a Swinburne Neuroimaging Access Grant.References
1. Horder J, Petrinovic MM, Mendez MA, et al. Glutamate and GABA in autism spectrum disorder—a translational magnetic resonance spectroscopy study in man and rodent models. Transl Psychiatry. 2018;8(1):1-11.2. Ford TC, Nibbs R, Crewther DP. Increased glutamate/GABA+ ratio in a shared autistic and schizotypal trait phenotype termed Social Disorganisation. NeuroImage Clin. 2017;16:125-131. doi:10.1016/j.nicl.2017.07.009
3. Ford TC, Nibbs R, Crewther DP. Glutamate/GABA+ ratio is associated with the psychosocial domain of autistic and schizotypal traits. PloS One. 2017;12(7):e0181961.
4. Pitcher D, Dilks DD, Saxe RR, Triantafyllou C, Kanwisher N. Differential selectivity for dynamic versus static information in face-selective cortical regions. NeuroImage. 2011;56(4):2356-2363. doi:10.1016/j.neuroimage.2011.03.067
5. Edden RAE, Puts NAJ, Harris AD, Barker PB, Evans CJ. Gannet: A batch-processing tool for the quantitative analysis of gamma-aminobutyric acid–edited MR spectroscopy spectra. J Magn Reson Imaging. 2014;40(6):1445-1452.
6. Near J, Edden R, Evans CJ, Paquin R, Harris A, Jezzard P. Frequency and phase drift correction of magnetic resonance spectroscopy data by spectral registration in the time domain. Magn Reson Med. 2015;73(1):44-50.
7. Apšvalka D, Gadie A, Clemence M, Mullins PG. Event-related dynamics of glutamate and BOLD effects measured using functional magnetic resonance spectroscopy (fMRS) at 3T in a repetition suppression paradigm. NeuroImage. 2015;118:292-300.
8. Lindeløv JK. mcp: An R package for regression with multiple change points. Published online 2020.
9. Boillat Y, Xin L, van der Zwaag W, Gruetter R. Metabolite concentration changes associated with positive and negative BOLD responses in the human visual cortex: A functional MRS study at 7 Tesla. J Cereb Blood Flow Metab Off J Int Soc Cereb Blood Flow Metab. 2020;40(3):488-500.
10. Chen C, Sigurdsson HP, Pépés SE, et al. Activation induced changes in GABA: Functional MRS at 7T with MEGA-sLASER. NeuroImage. 2017;156:207-213.
11. Takado Y, Takuwa H, Sampei K, et al. MRS-measured glutamate versus GABA reflects excitatory versus inhibitory neural activities in awake mice. J Cereb Blood Flow Metab. Published online September 13, 2021:0271678X211045449.
12. Betina Ip I, Berrington A, Hess AT, Parker AJ, Emir UE, Bridge H. Combined fMRI-MRS acquires simultaneous glutamate and BOLD-fMRI signals in the human brain. Neuroimage. 2017;155:113-119.
13. Mullins PG. Towards a theory of functional magnetic resonance spectroscopy (fMRS): A meta-analysis and discussion of using MRS to measure changes in neurotransmitters in real time. Scand J Psychol. 2018;59(1):91-103.
Figures
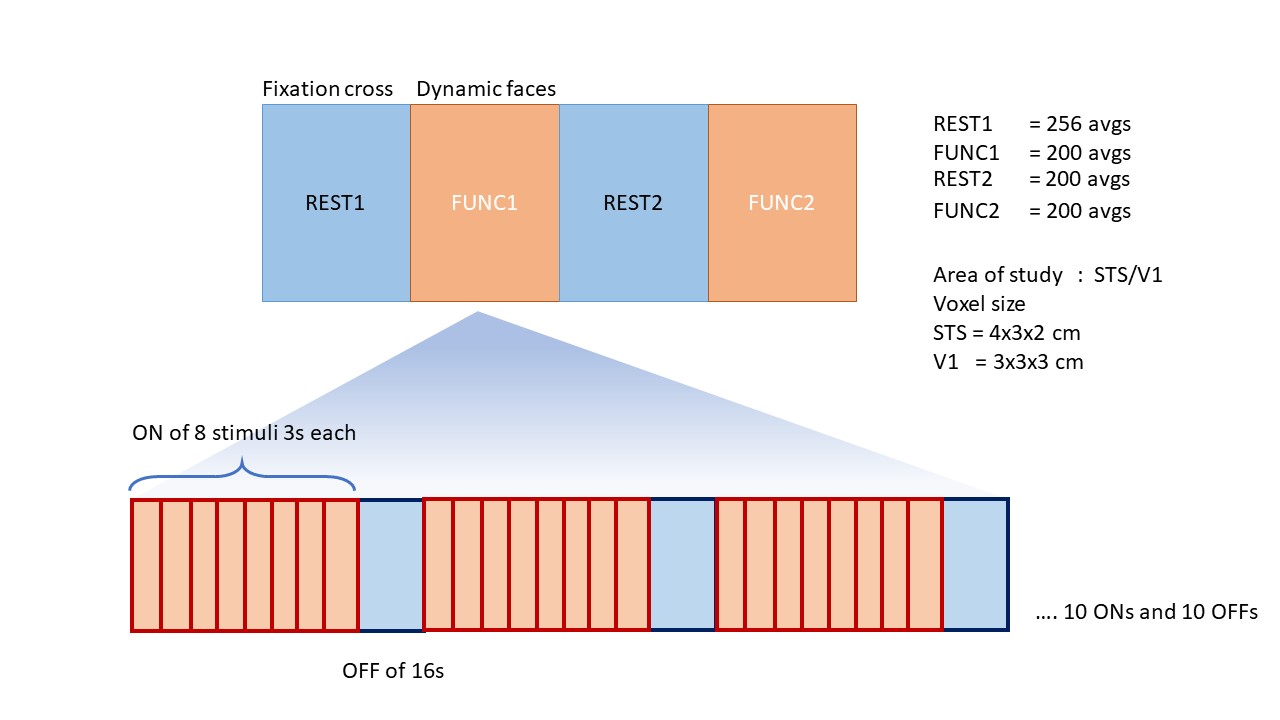
Figure 1: fMRS experimental design. A total of four MRS acquisition blocks were performed. During functional blocks (FUNC1 and FUNC2), participants were asked to passively watch 3s movie clips of dynamic faces or dynamic objects (24 s stimulus-ON, 16 s stimulus OFF) (order counterbalanced)4.
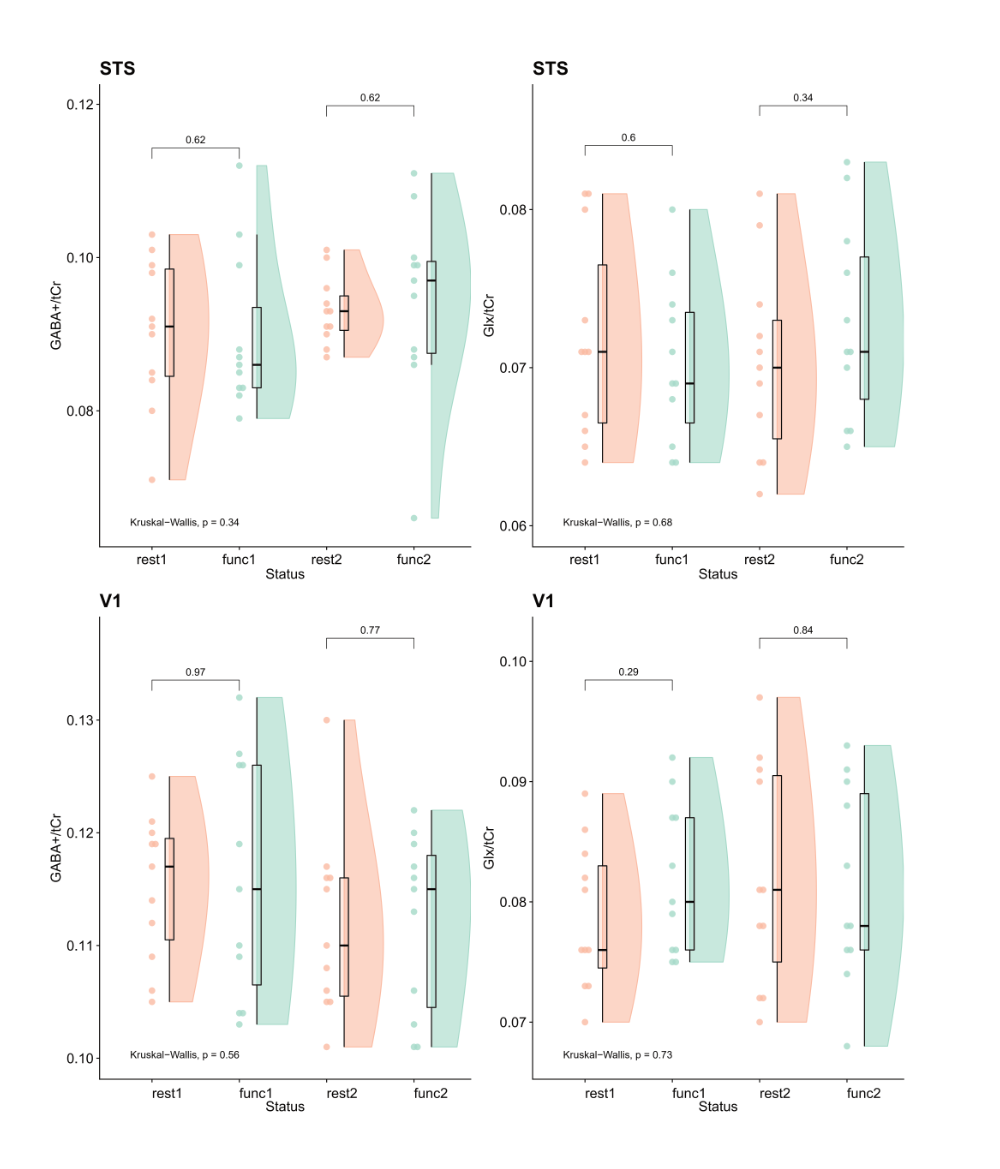
Figure 2: GABA+/tCr and Glx/tCr levels in STS and V1 based on fMRS blocks across both stimulus types. FUNC1, FUNC2: participants passively viewed social stimuli; rest1, rest2: participants passively viewed fixation cross.
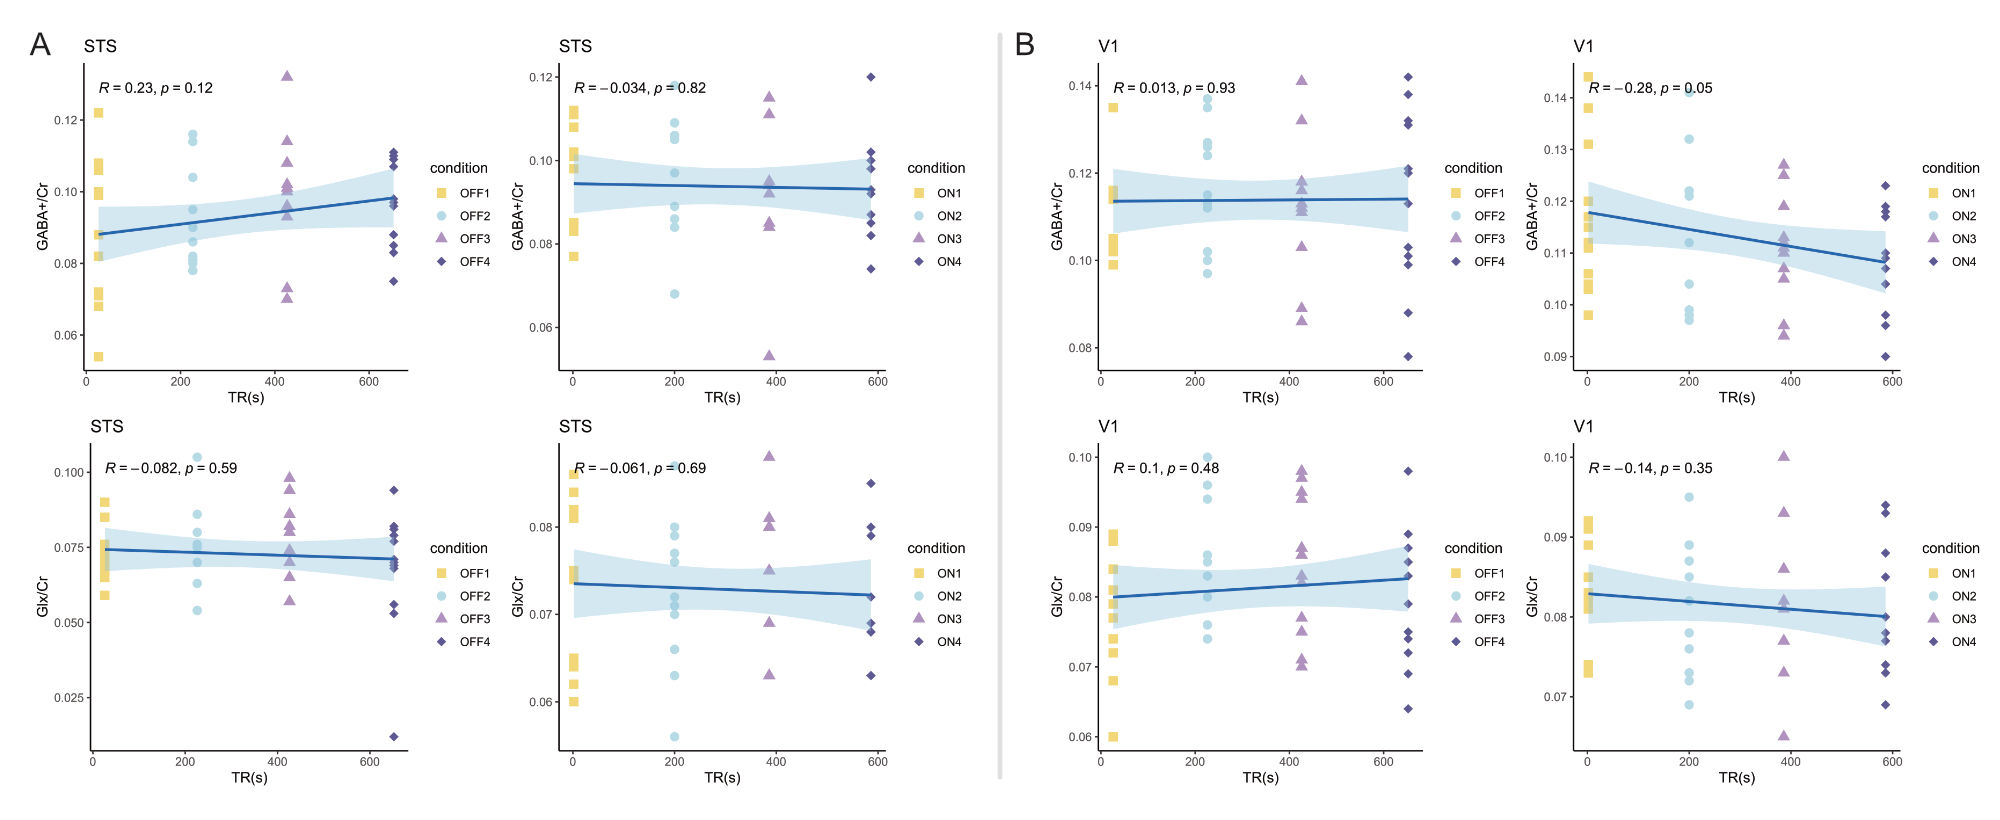
Figure 3: Pearson’s correlation of GABA+/tCr and Glx/tCr in (A) STS and (B) V1 during stimulus-ONs (24 s stimulus-ONs of 3 s movie clips of dynamic faces or dynamic objects) or stimulus-OFFs (16 s rest).
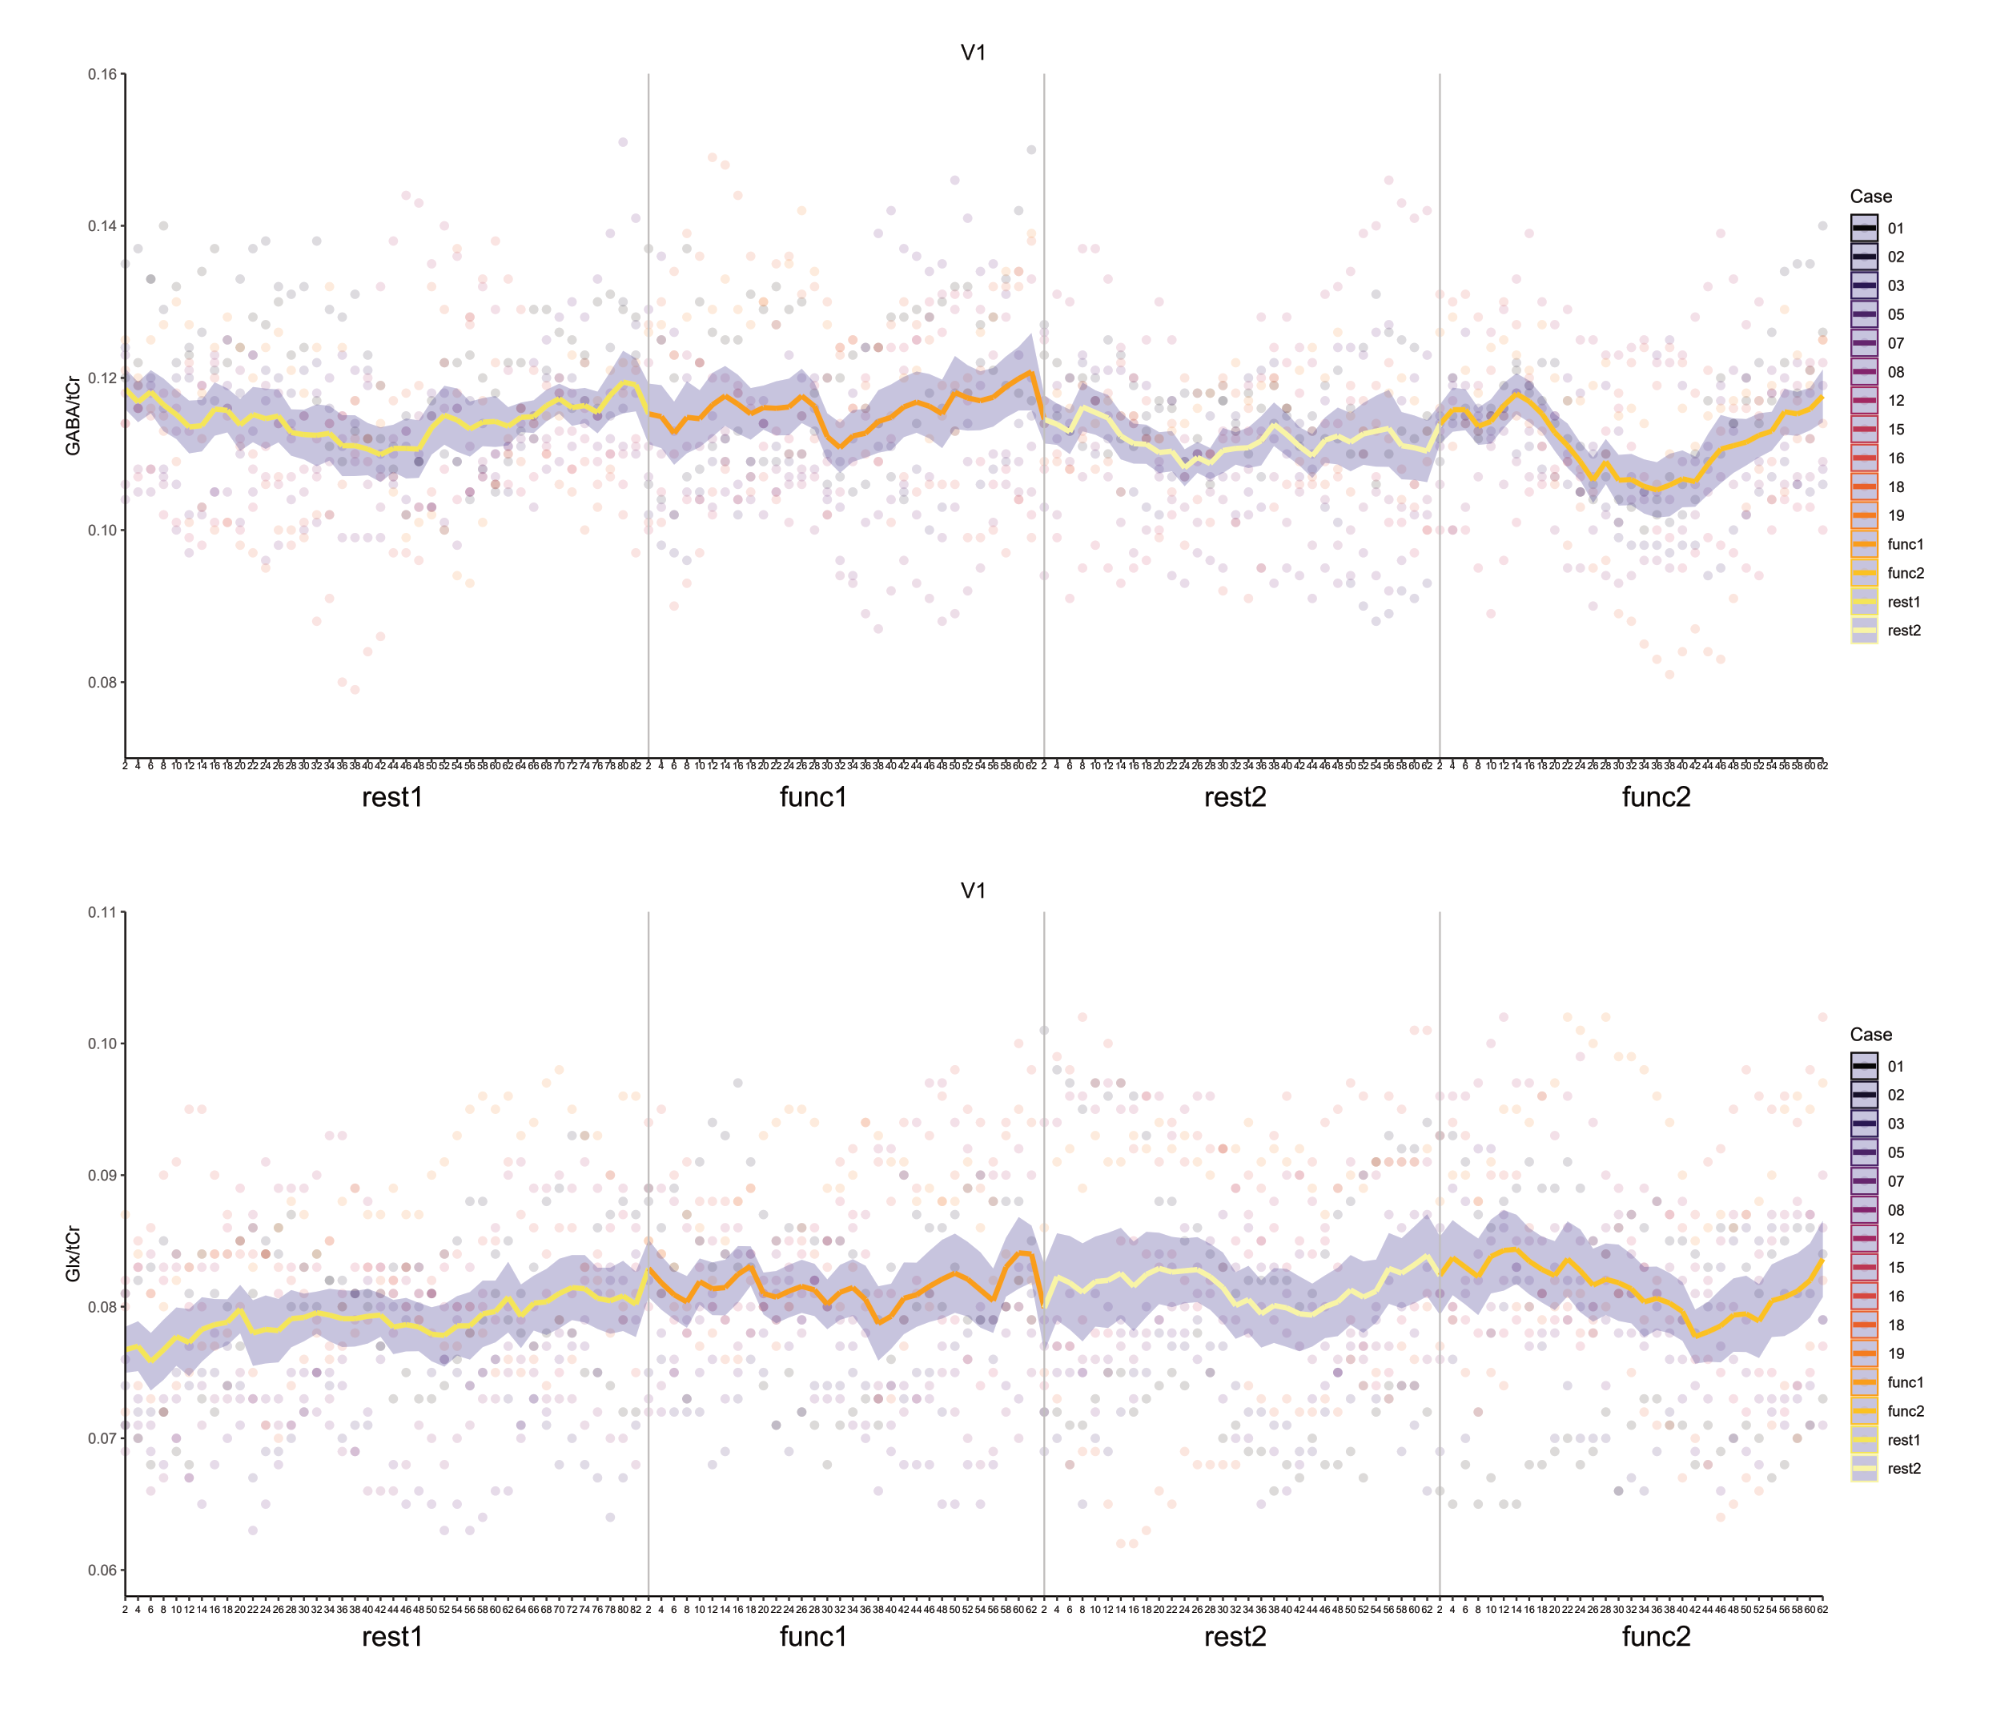
Figure 4: Time course of (Top) GABA+/tCr and (Bottom) Glx/tCr in V1 irrespective of stimulus conditions (faces or objects).
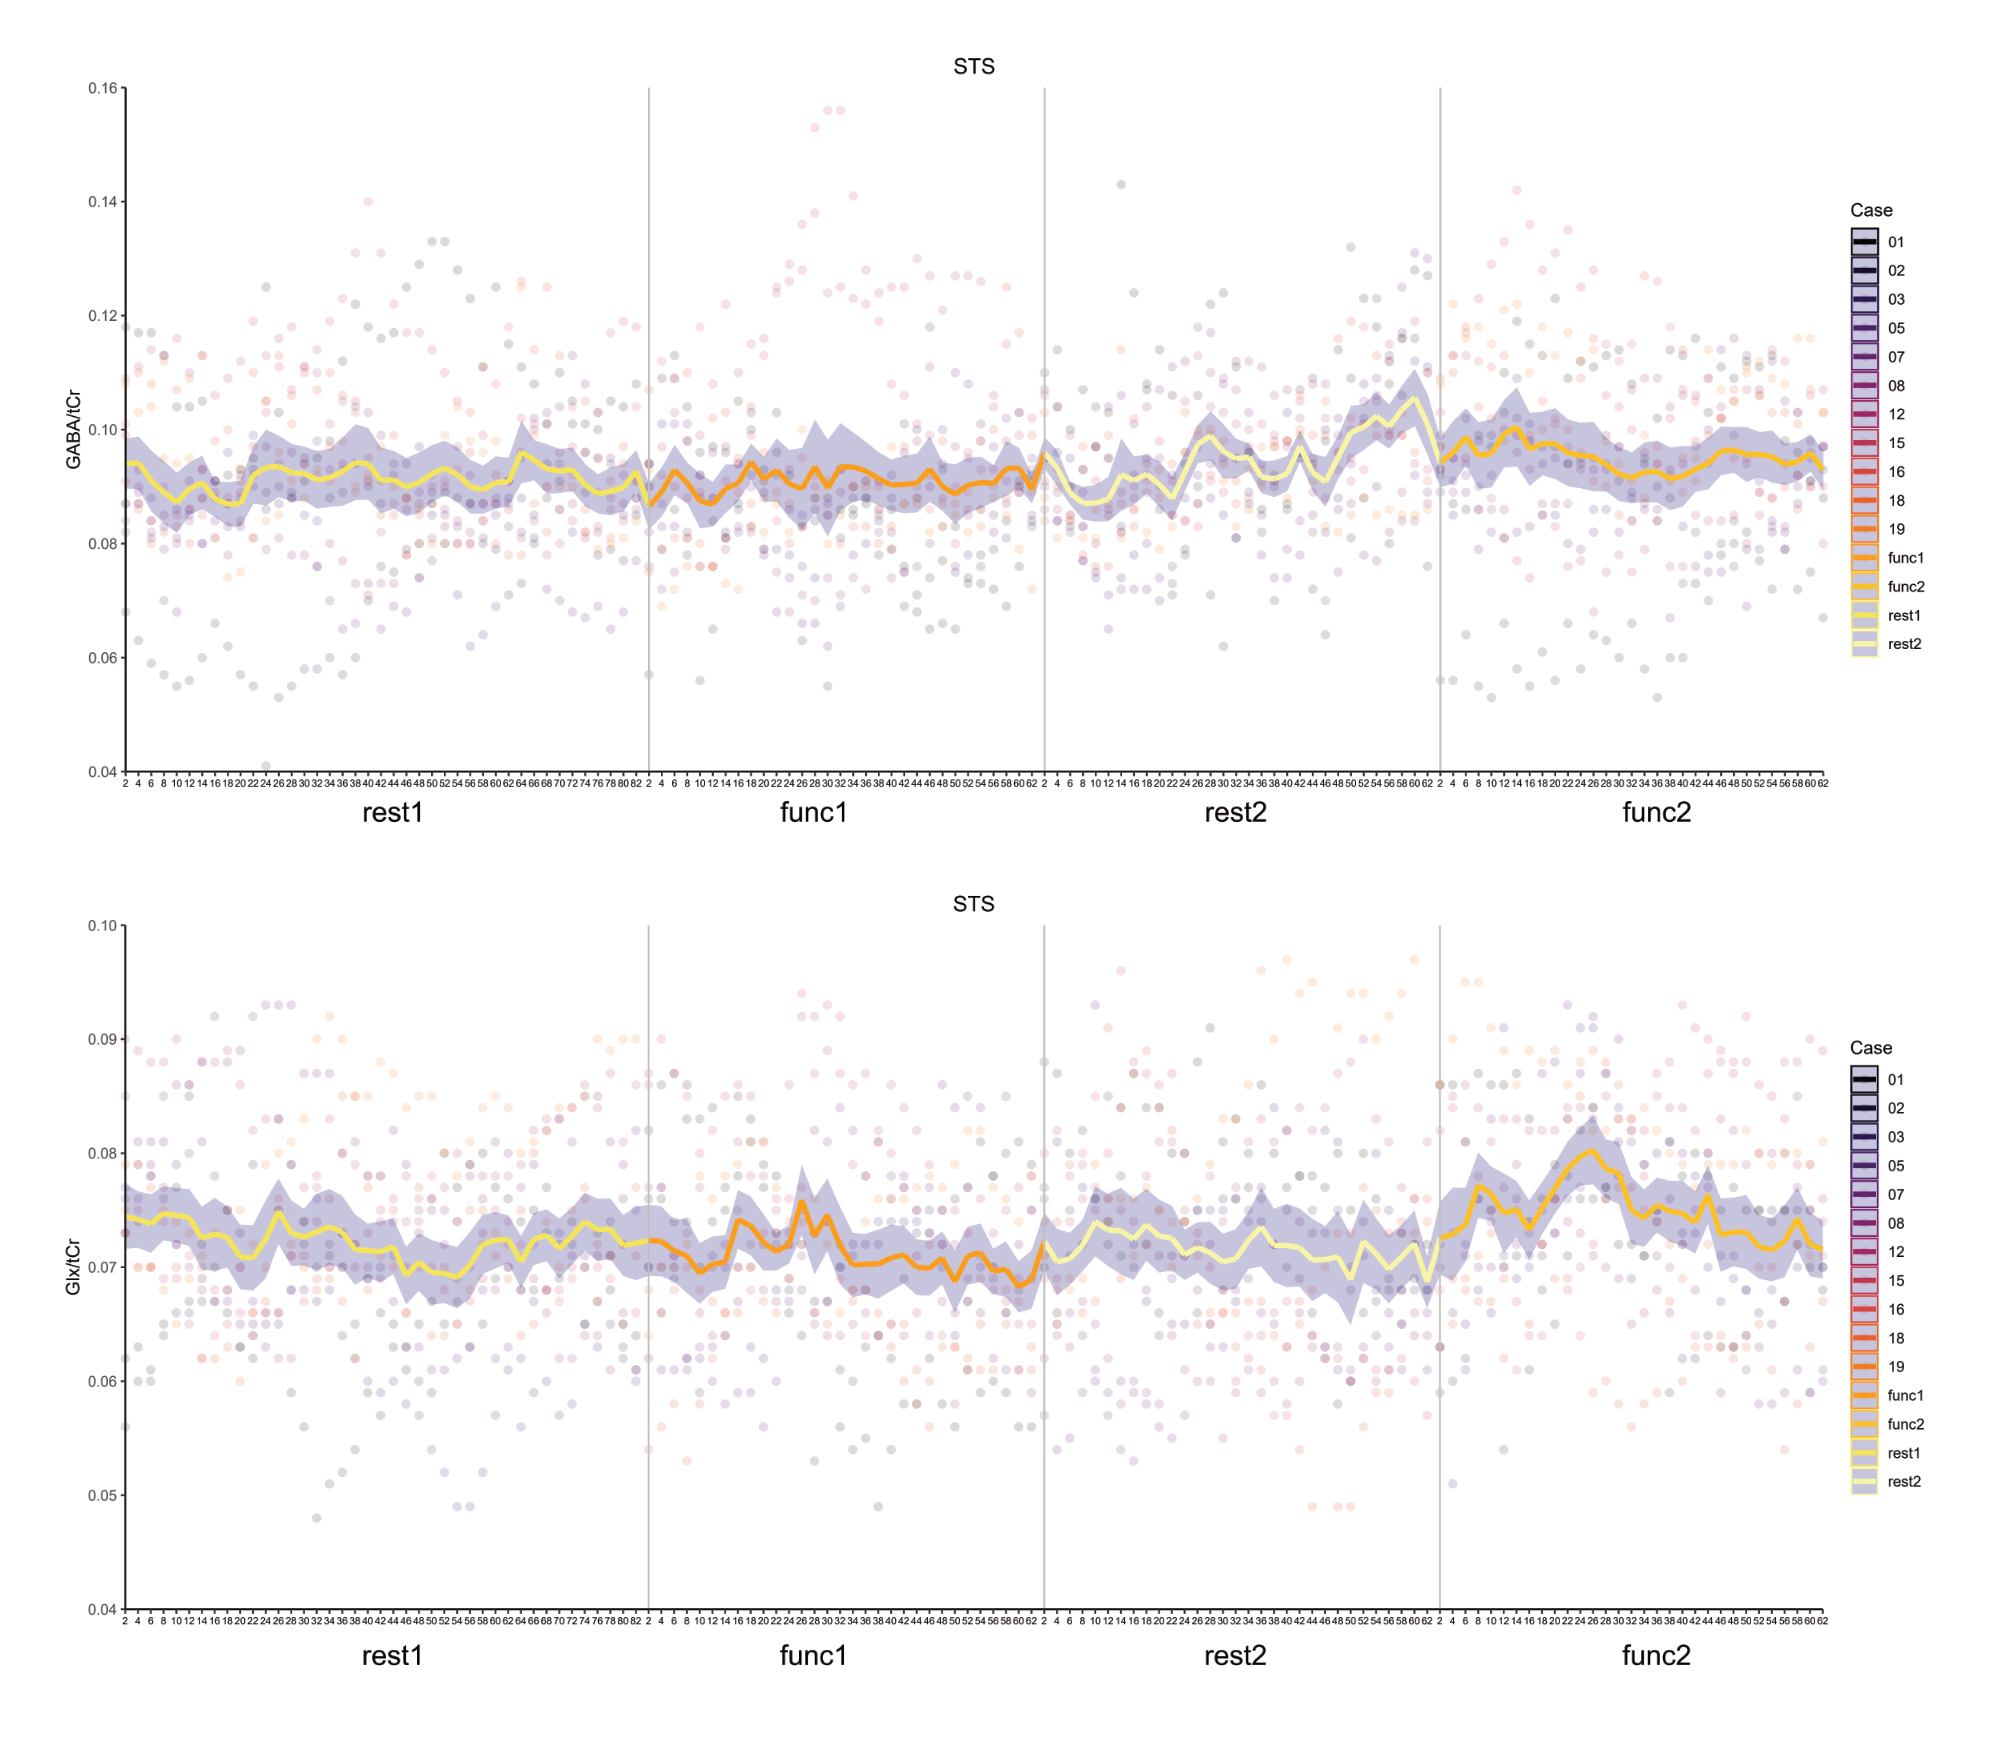
Figure 5: Time course of (Top) GABA+/tCr and (Bottom) Glx/tCr in STS irrespective of stimulus conditions (faces or objects).
DOI: https://doi.org/10.58530/2022/2537