2535
Measuring the macromolecular baseline in the neonatal brain1Centre for the Developing Brain, School of Biomedical Engineering and Imaging Sciences, King’s College London, London, United Kingdom, 2Russell H. Morgan Department of Radiology and Radiological Science, The Johns Hopkins University School of Medicine, Baltimore, MD, United States, 3Department of Forensic and Neurodevelopmental Sciences, Institute of Psychiatry, Psychology & Neuroscience, King's College London, London, United Kingdom, 4Biomedical Engineering Department, School of Biomedical Engineering and Imaging Sciences, King’s College London, London, UK, London, United Kingdom
Synopsis
The doublet nature of the 3 ppm peak previously reported in neonates indicates that a lower macromolecular contribution to the GABA+ 3 ppm signal is likely to be present in this population. Detailed characterisation of age‐related MM contribution rates is required to improve the MRS fitting process, and therefore, to further increase the accuracy of metabolic measurements in neonates. As a first step, we here measure the macromolecular baseline using metabolite-nulling MRS in healthy term neonatal participants.
INTRODUCTION:
GABA+ signal as measured by in vivo edited-MRS contains contributions from GABA and macromolecules (MM), with the latter considered to predominately originate from the amino acid lysine1. As a result of MM contributions, the expected pseudo-doublet character of the 3 ppm signal is not usually observed in adult MRS measurements2,3.In contrast, recent work has shown that spectra collected from neonates display the characteristic doublet GABA+ peak at 3ppm4, perhaps indicating a lower MM contribution in this population. However, no measurements have ever been made to characterise MM levels in neonates to test this hypothesis. Therefore, the aim of this work is to measure the macromolecular baseline using metabolite-nulling MRS in healthy neonatal participants.
METHODS:
Participants 7 healthy newborn infants were recruited with median gestational age at birth: 38 (36-41) weeks. They were scanned at 38 (37-42) weeks postmenstrual age.Imaging Participants were scanned without sedation on a Philips Achieva 3T at St. Thomas’ Hospital London (32-channel neonatal head coil5). Anatomical data were collected using T1-weighted MPRAGE and motion-corrected T2-weighted TSE6). Following ‘pencil-beam’ shimming, MRS data was acquired in the posterior cingulate cortex (25x25x25mm3, see Figure 1), using standard PRESS and metabolite-nulling PRESS (MM-PRESS). This method incorporates pre-inversion to null metabolite signals according to their different T1 relaxation times from macromolecules, using a hyperbolic secant inversion pulse7 (TR=2s, TE=30ms, 2kHz BW, 2048 points, 72 averages). An initial test participant was scanned using multiple MM-PRESS with different inversion times (600-900ms in 50ms increments), for optimisation purposes. The optimum inversion time was predicted to be longer than the adult’s 600ms8, based on a longer assumed value for all metabolite T1s in neonates.
Analysis MRS data were pre-processed and quantified using Osprey9. Anatomical images were segmented using the developing Human Connectome Project pipeline10, using age-specific brain templates, and tissue and relaxation corrections were applied to metabolic and MM concentrations. MM concentrations are expressed as average values +/- standard error of the mean.
RESULTS:
Figure 2 shows the resulting spectra from the initial participant with an array of inversion times. The TI value for optimal metabolite-nulling was found to be 650ms and used in all subsequent experiments. Individual and mean metabolite-nulling spectra in the PCC are shown in Figure 3, whilst Figure 4 displays a representative fit result and the mean spectral fit. MM/lipid concentrations are displayed in Figure 5.DISCUSSION & CONCLUSION:
We have performed the first metabolite-nulled MRS measurement in the neonatal brain. The doublet nature of the 3 ppm peak reported in neonates3 indicates that a lower MM contribution to the GABA+ 3 ppm signal is likely to be present in neonates. This contribution presumably increases with maturation, with previous preclinical work showing a 30% increase in overall macromolecular content measured with MRS during postnatal development in a neonatal rat model11. Neuropeptide levels are also known to increase in the first three weeks after birth12, and l-pipecolate levels (the by-products of lysine breakdown) are much higher around birth than in adults (as large amounts of lysine are being broken down) and then decrease over time13. Additionally, a recent study in children aged 7–14 years has suggested that previously reported changes in GABA+ with age could have been driven by changes in MM levels alone14.Future work will focus on comparing these neonatal results with adult macromolecular baseline values, and further metabolite-nulled measurements in this population, this time with an edited-MRS readout, in order to more specifically evaluate the 3 ppm MM contribution. This detailed characterisation of age‐related MM contribution rates is required to increase the accuracy of metabolic measurements in neonates, and further improve the MRS fitting process.
Acknowledgements
The authors thank the clinical staff on the neonatal intensive care unit at St Thomas Hospital London for supporting the work and the parents who consented for their infants to participate in the work. M.Y.L. and the work were funded through a project grant awarded by Action Medical Research [GN2728].
References
1. Behar KL, Ogino T. Characterization of macromolecule resonances in the 1H NMR spectrum of rat brain. Magn Reson Med. 1993; 30(1):38-44.
2. Mullins PG, McGonigle DJ, O'Gorman RL, et al. Current practice in the use of MEGA-PRESS spectroscopy for the detection of GABA. Neuroimage. 2014; 86:43-52.
3. Mikkelsen M, Barker PB, Bhattacharyya PK, et al. Big GABA: Edited MR spectroscopy at 24 research sites. Neuroimage. 2017; 159:32-45.
4. Yanez Lopez M, Price NA, Puts N, et al. Simultaneous quantification of GABA, Glx and GSH in the neonatal human brain using magnetic resonance spectroscopy. NeuroImage 2021; 233.
5. Hughes EJ, Winchman T, Padormo F, et al. A dedicated neonatal brain imaging system. Magn Reson Med. 2017;78(2):794-804.
6. Cordero-Grande L, Hughes EJ, Hutter J, et al. Three-dimensional motion corrected sensitivity encoding reconstruction for multi-shot multi-slice MRI: Application to neonatal brain imaging. Magn Reson Med. 2018; 79(3):1365-1376.
7. Snoussi K, Gillen JS, Horska A, et al. Comparison of brain gray and white matter macromolecule resonances at 3 and 7 Tesla. Magn Reson Med. 2015; 74(3):607-13.
8. Edden RA, Intrapiromkul J, Zhu H, et al. Measuring T2 in vivo with J-difference editing: application to GABA at 3 Tesla. J Magn Reson Imaging. 2012; 35(1):229-34.
9. Oeltzschner G, Zöllner HJ, Hui SCN, et al. Osprey: Open-source processing, reconstruction & estimation of magnetic resonance spectroscopy data. J Neurosci Methods. 2020; 343:108827.
10. Makropoulos A, Robinson EC, Schuh A, et al. The developing human connectome project: A minimal processing pipeline for neonatal cortical surface reconstruction. Neuroimage. 2018; 173:88-112.
11. Tkác I, Rao R, Georgieff MK, et al. Developmental and regional changes in the neurochemical profile of the rat brain determined by in vivo 1H NMR spectroscopy. Magn Reson Med. 2003; 50(1):24-32.
12. Polin RA, Abman SH, Fox WW. Fetal and Neonatal Physiology 2011; Elsevier Health Sciences.
13. Hallen A, Jamie JF, Cooper AJ. Lysine metabolism in mammalian brain: an update on the importance of recent discoveries. Amino Acids. 2013; 45(6):1249-72.
14. Bell T, Stokoe M, Harris AD. Macromolecule suppressed GABA levels show no relationship with age in a pediatric sample. Sci Rep. 2021; 11(1):722.
Figures
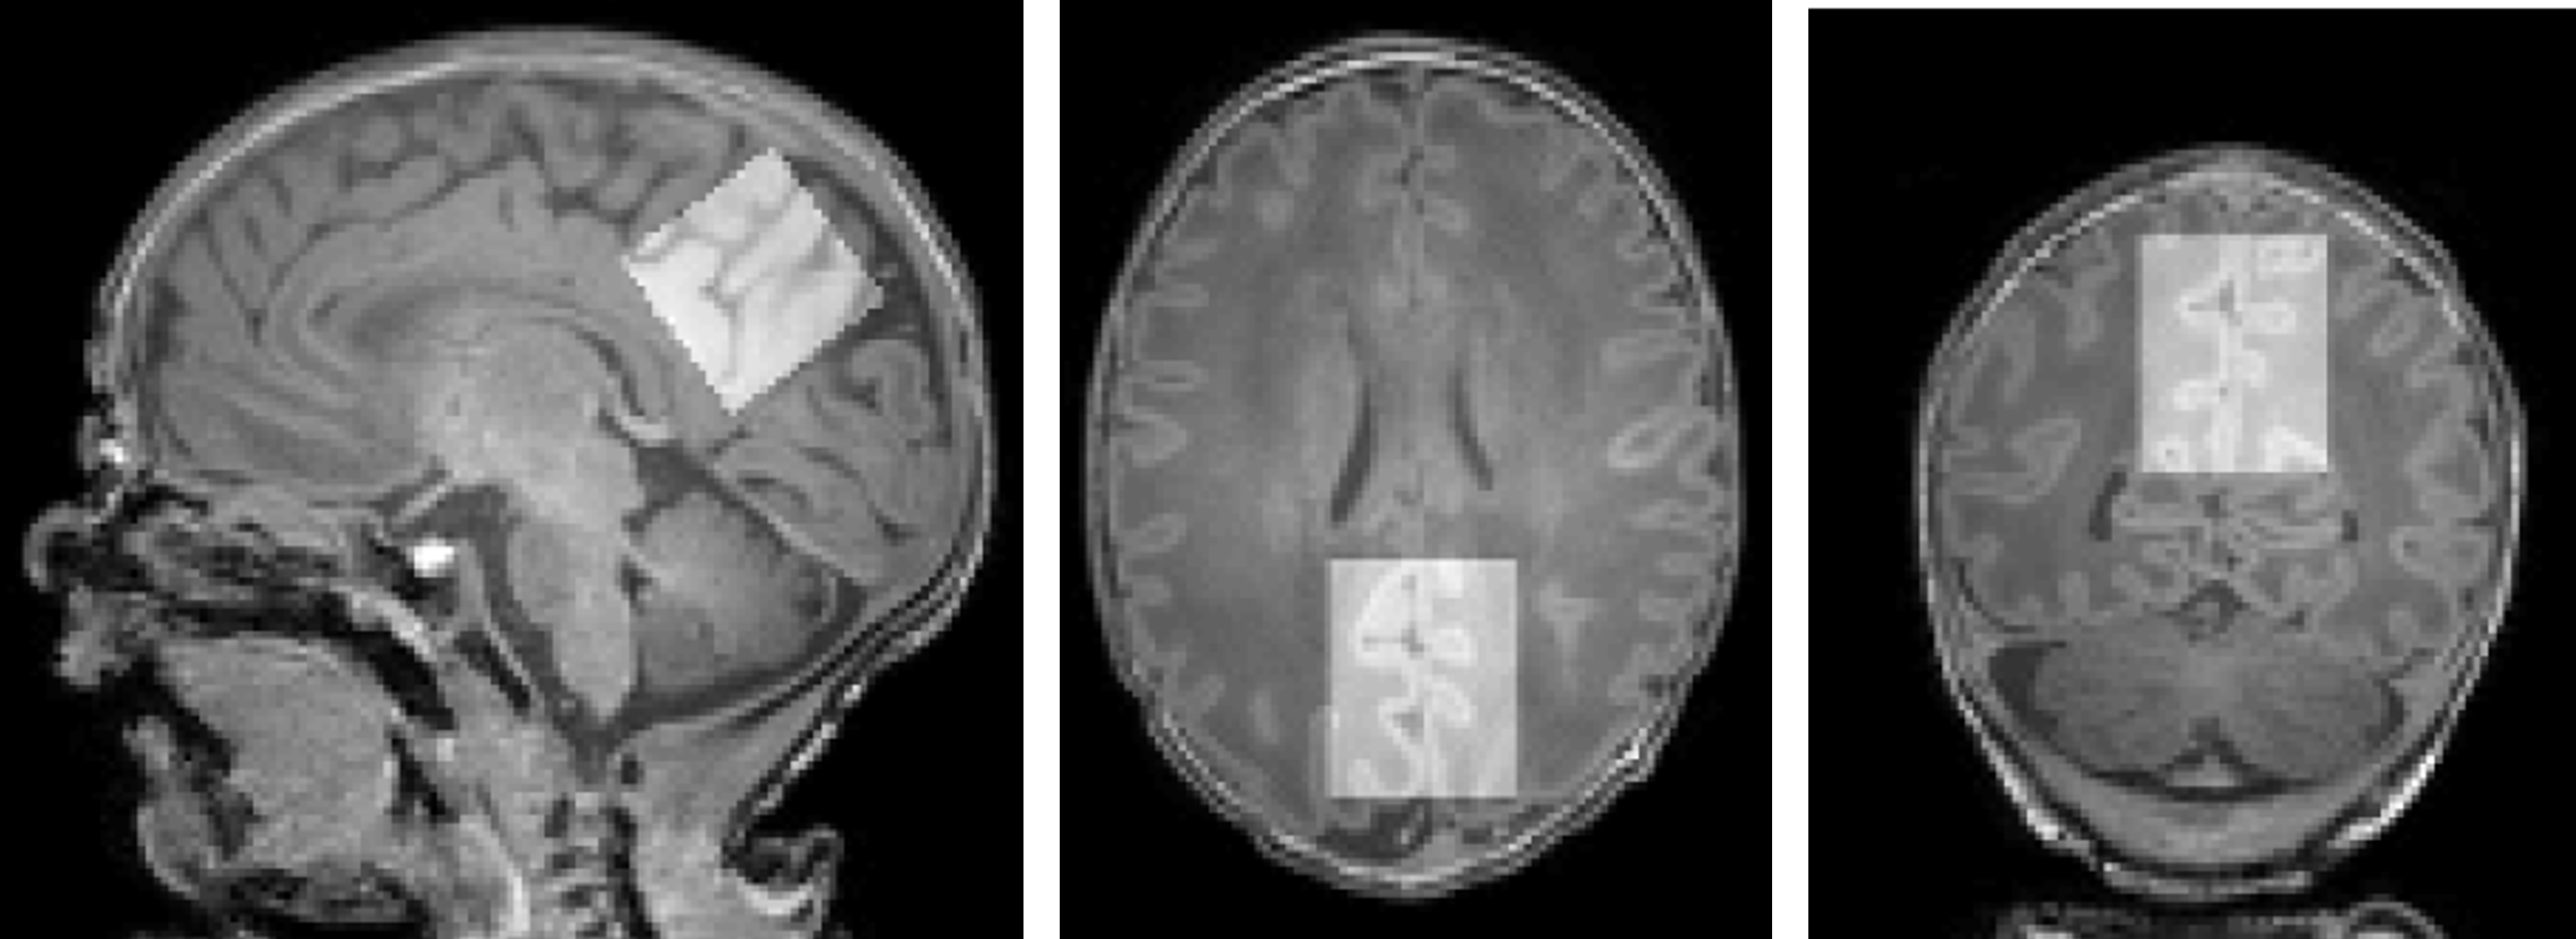
Figure 1: Representative voxel centred over the posterior cingulate cortex (top, 25x25x25 mm3), superimposed on T1-weighted data. Neonate gestation age at birth: 37+3 weeks, postmenstrual age at scan: 38+0 weeks.
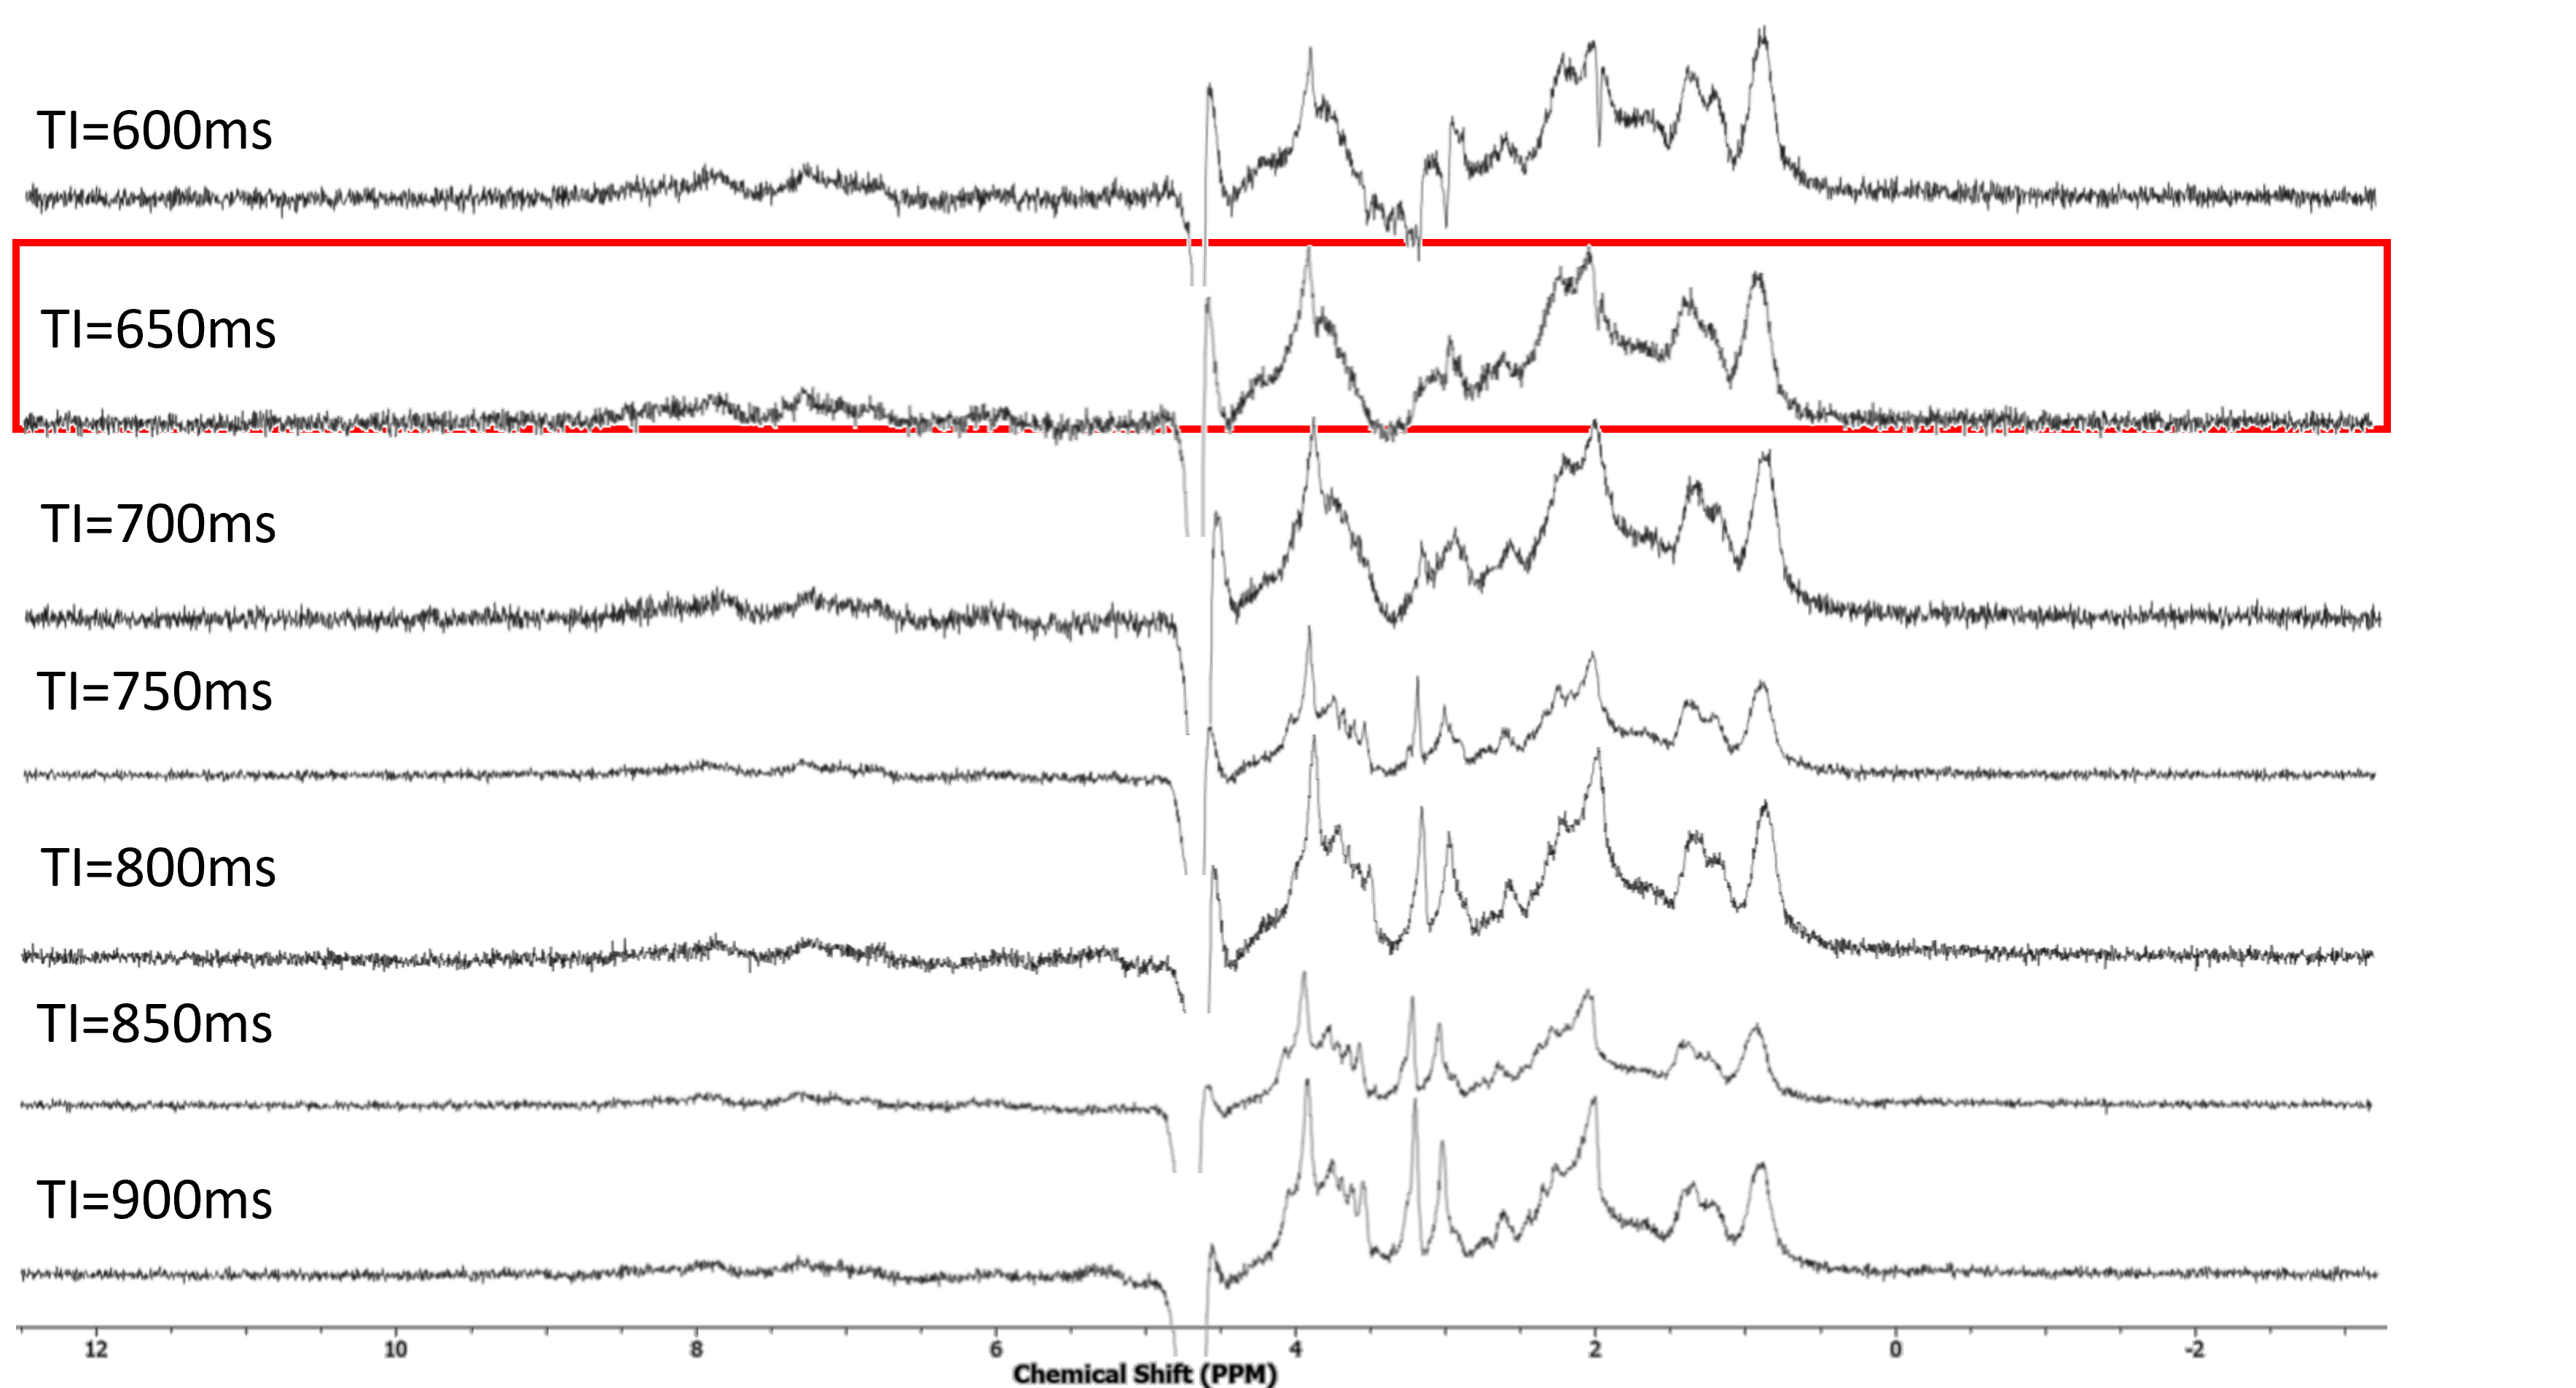
Figure 2: Metabolite-nulled PRESS spectra, with an array of different inversion times (TI from 600ms to 900ms). Highlighted in red is the TI found to most effectively null a range of metabolites in the neonatal brain.
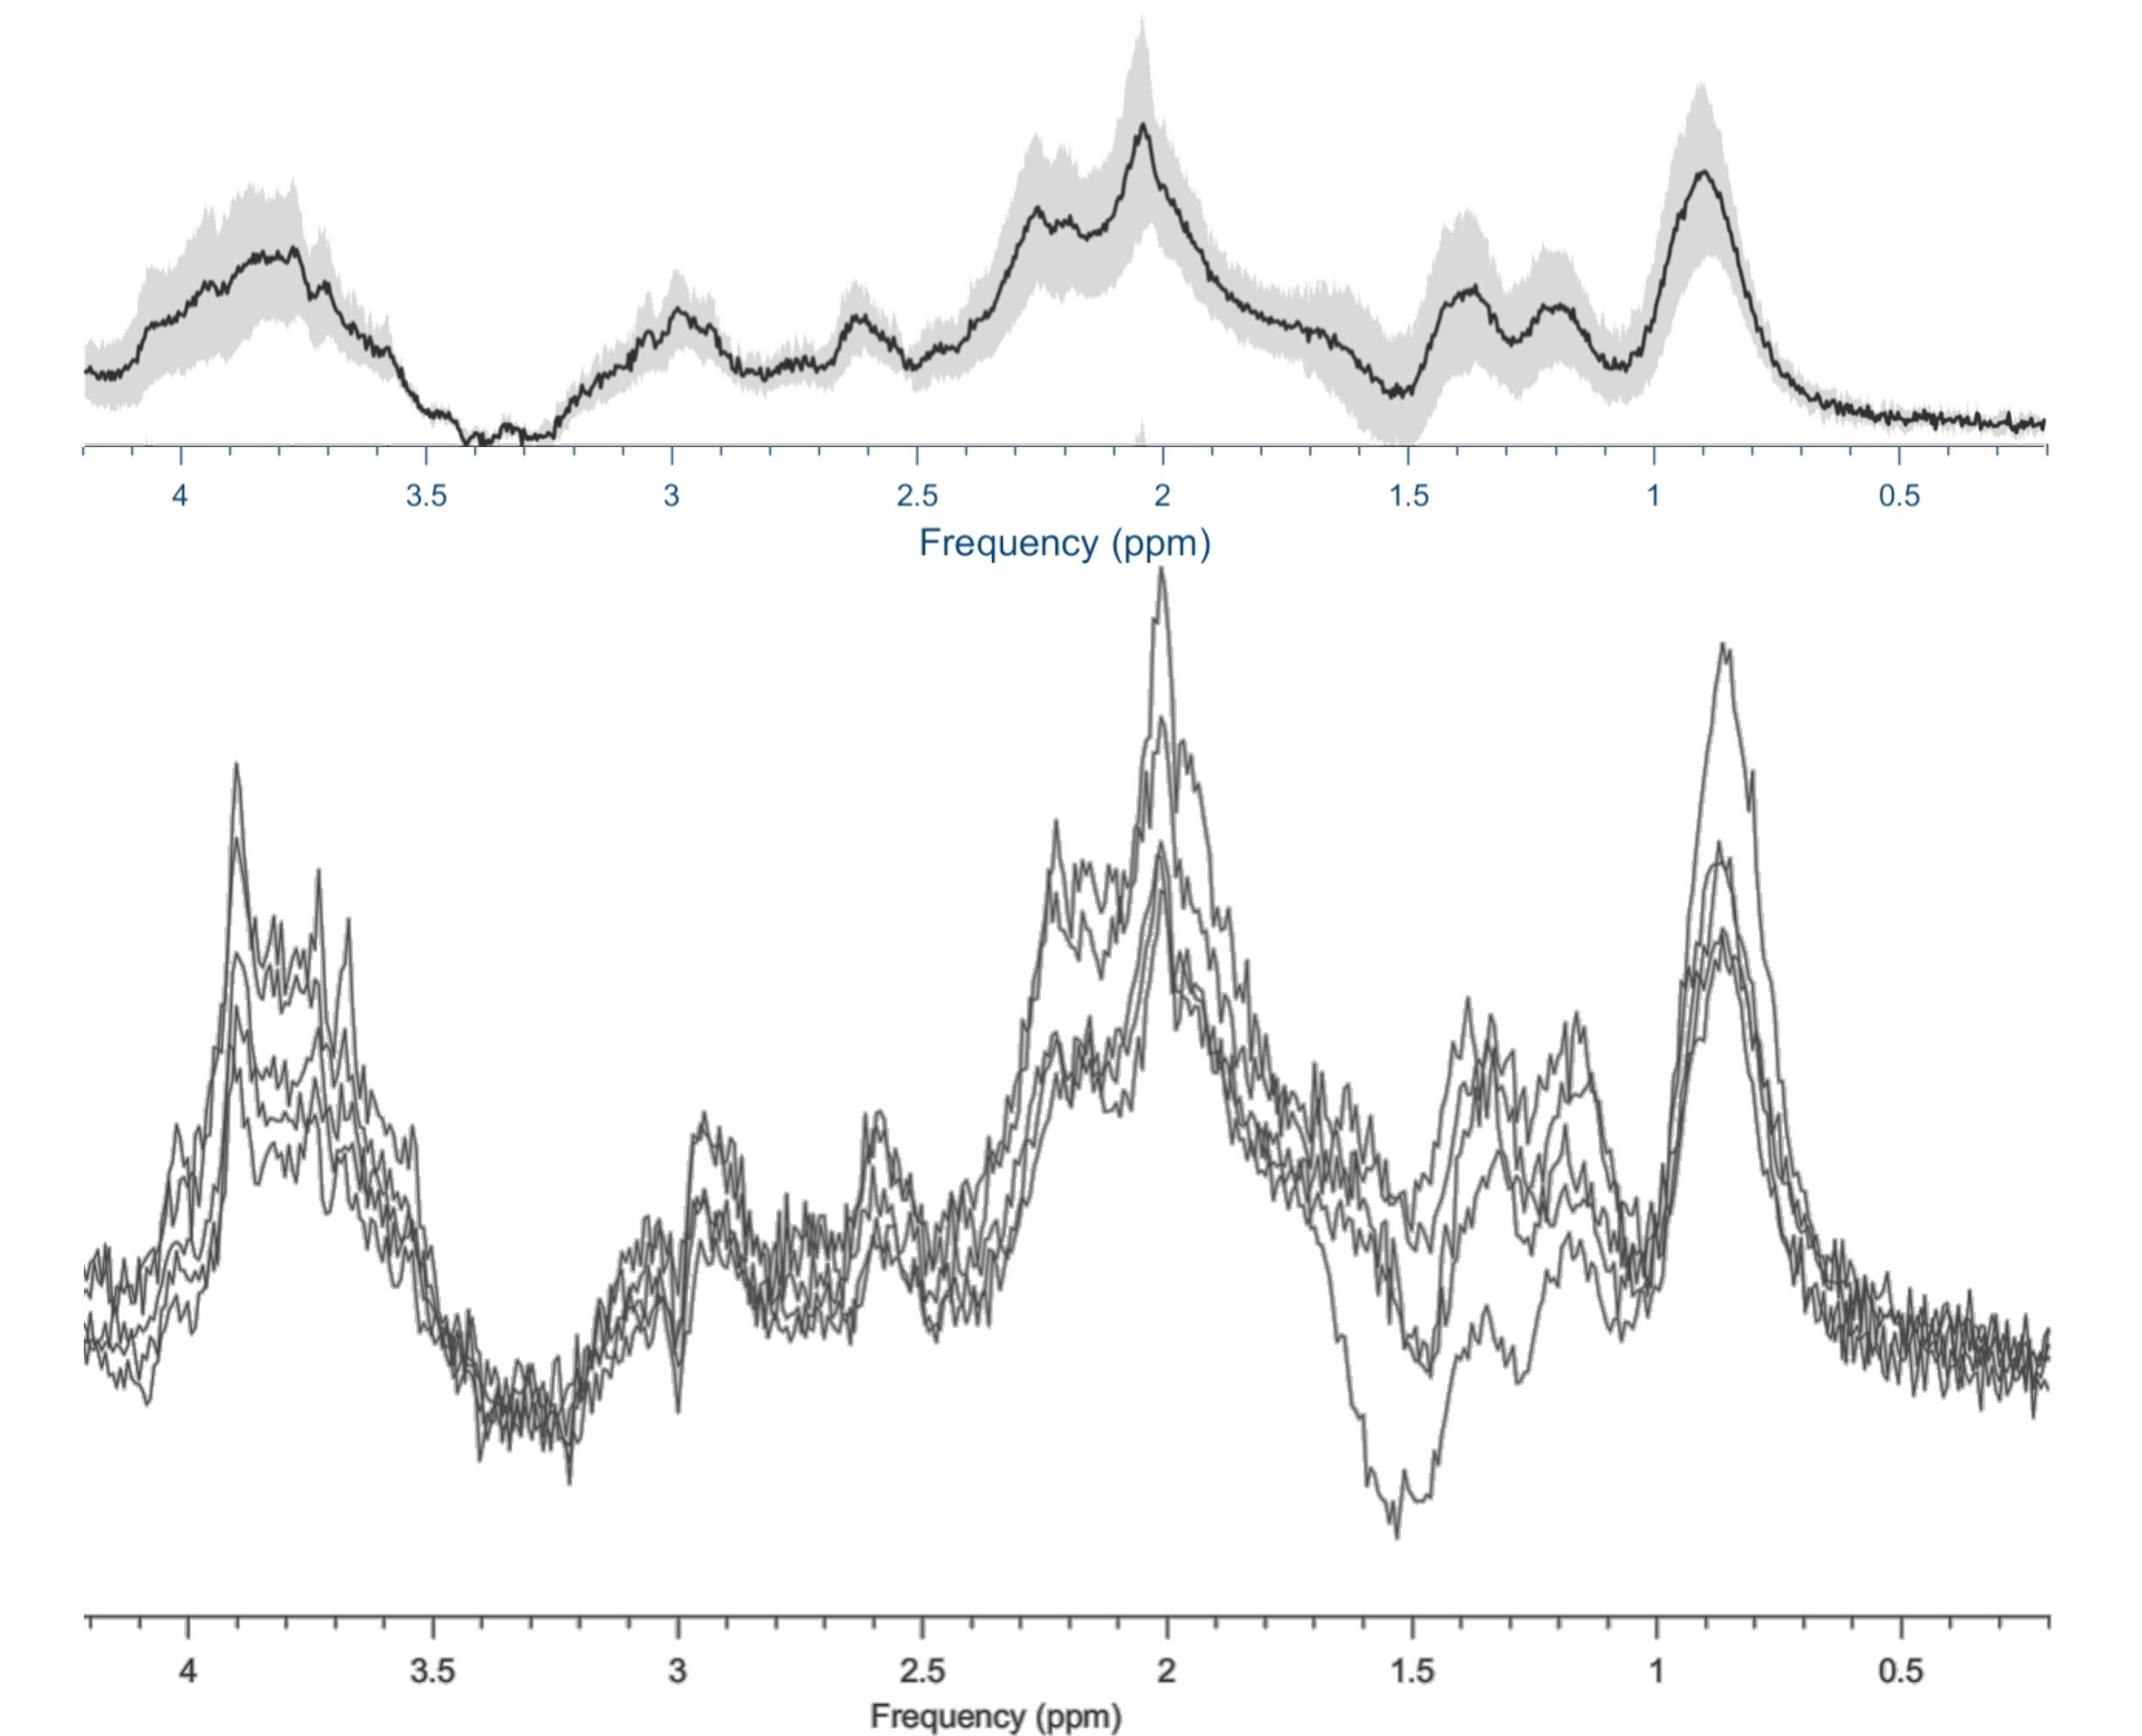
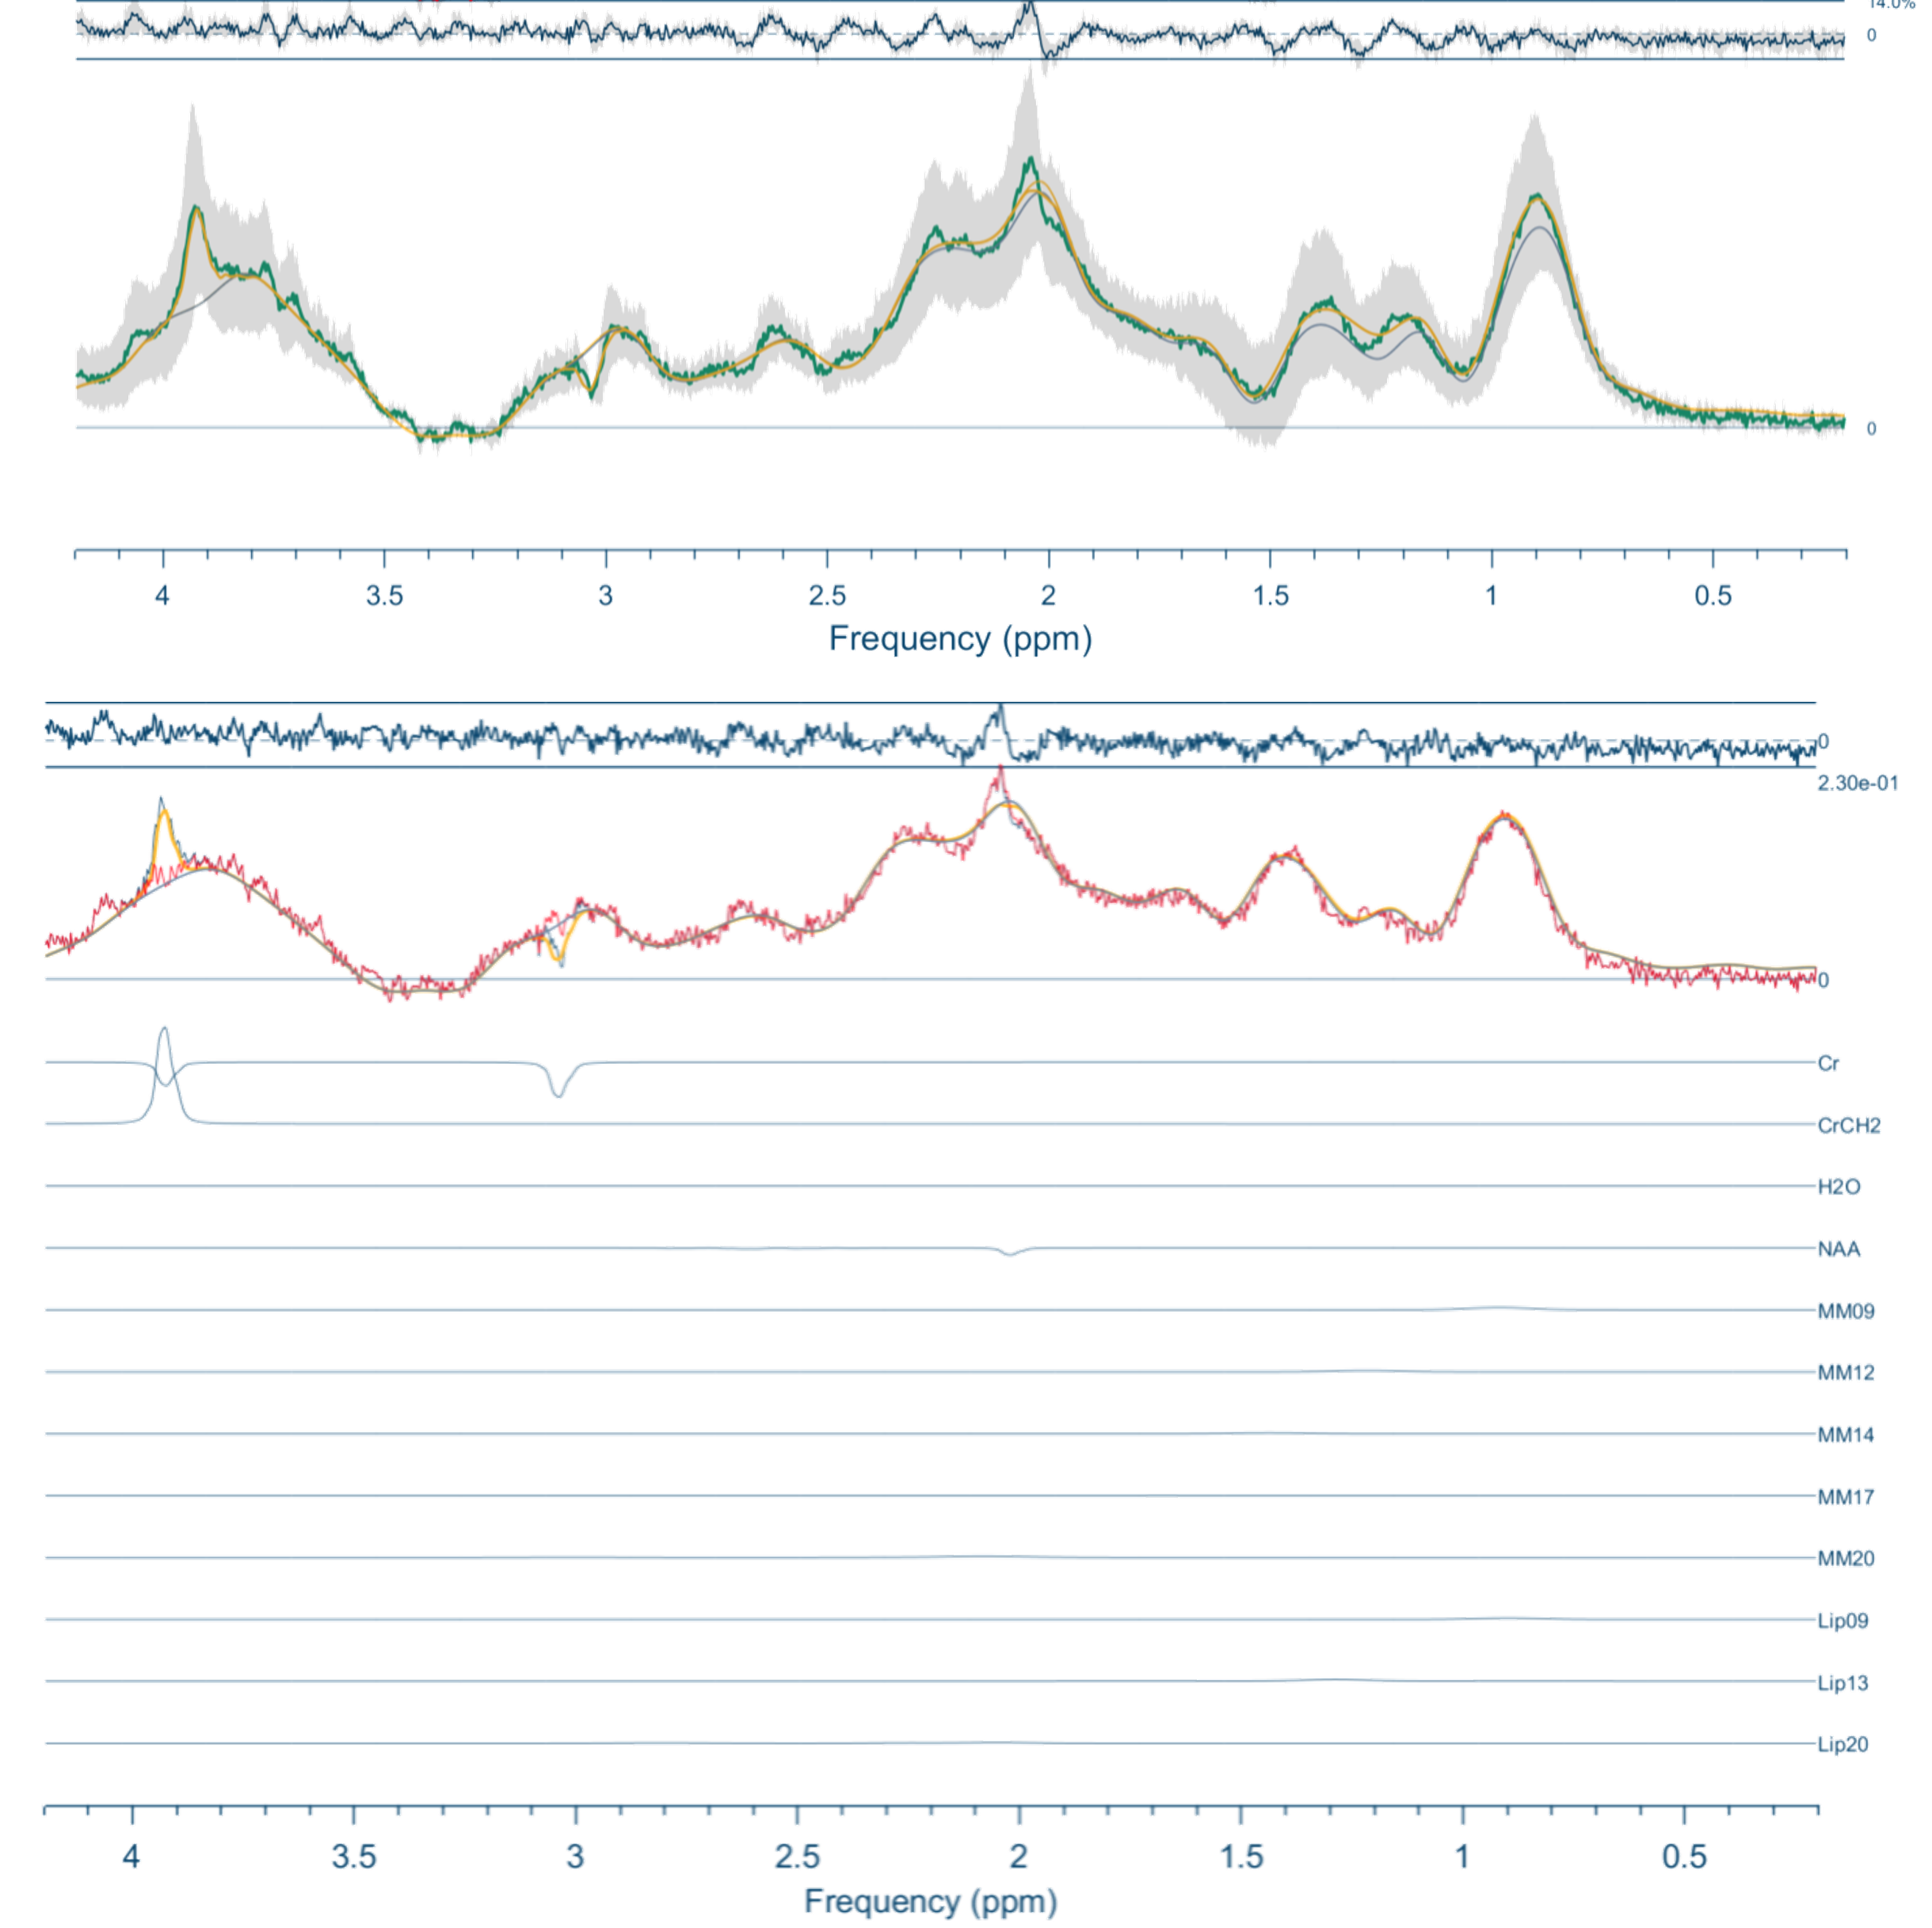
Figure 4: Top) Metabolite-nulled PRESS mean fit (in black) and mean spectrum (in green), with the standard deviation in dark grey. Bottom) Representative fit (in black) with contributions from individual metabolites/MM (Cr creatine; NAA N-acetylaspartate; MM09; MM12; MM14; MM17; MM20; Lip09; Lip13; Lip20). Neonate gestation age at birth: 37+3 weeks, postmenstrual age at scan: 38+0 weeks.
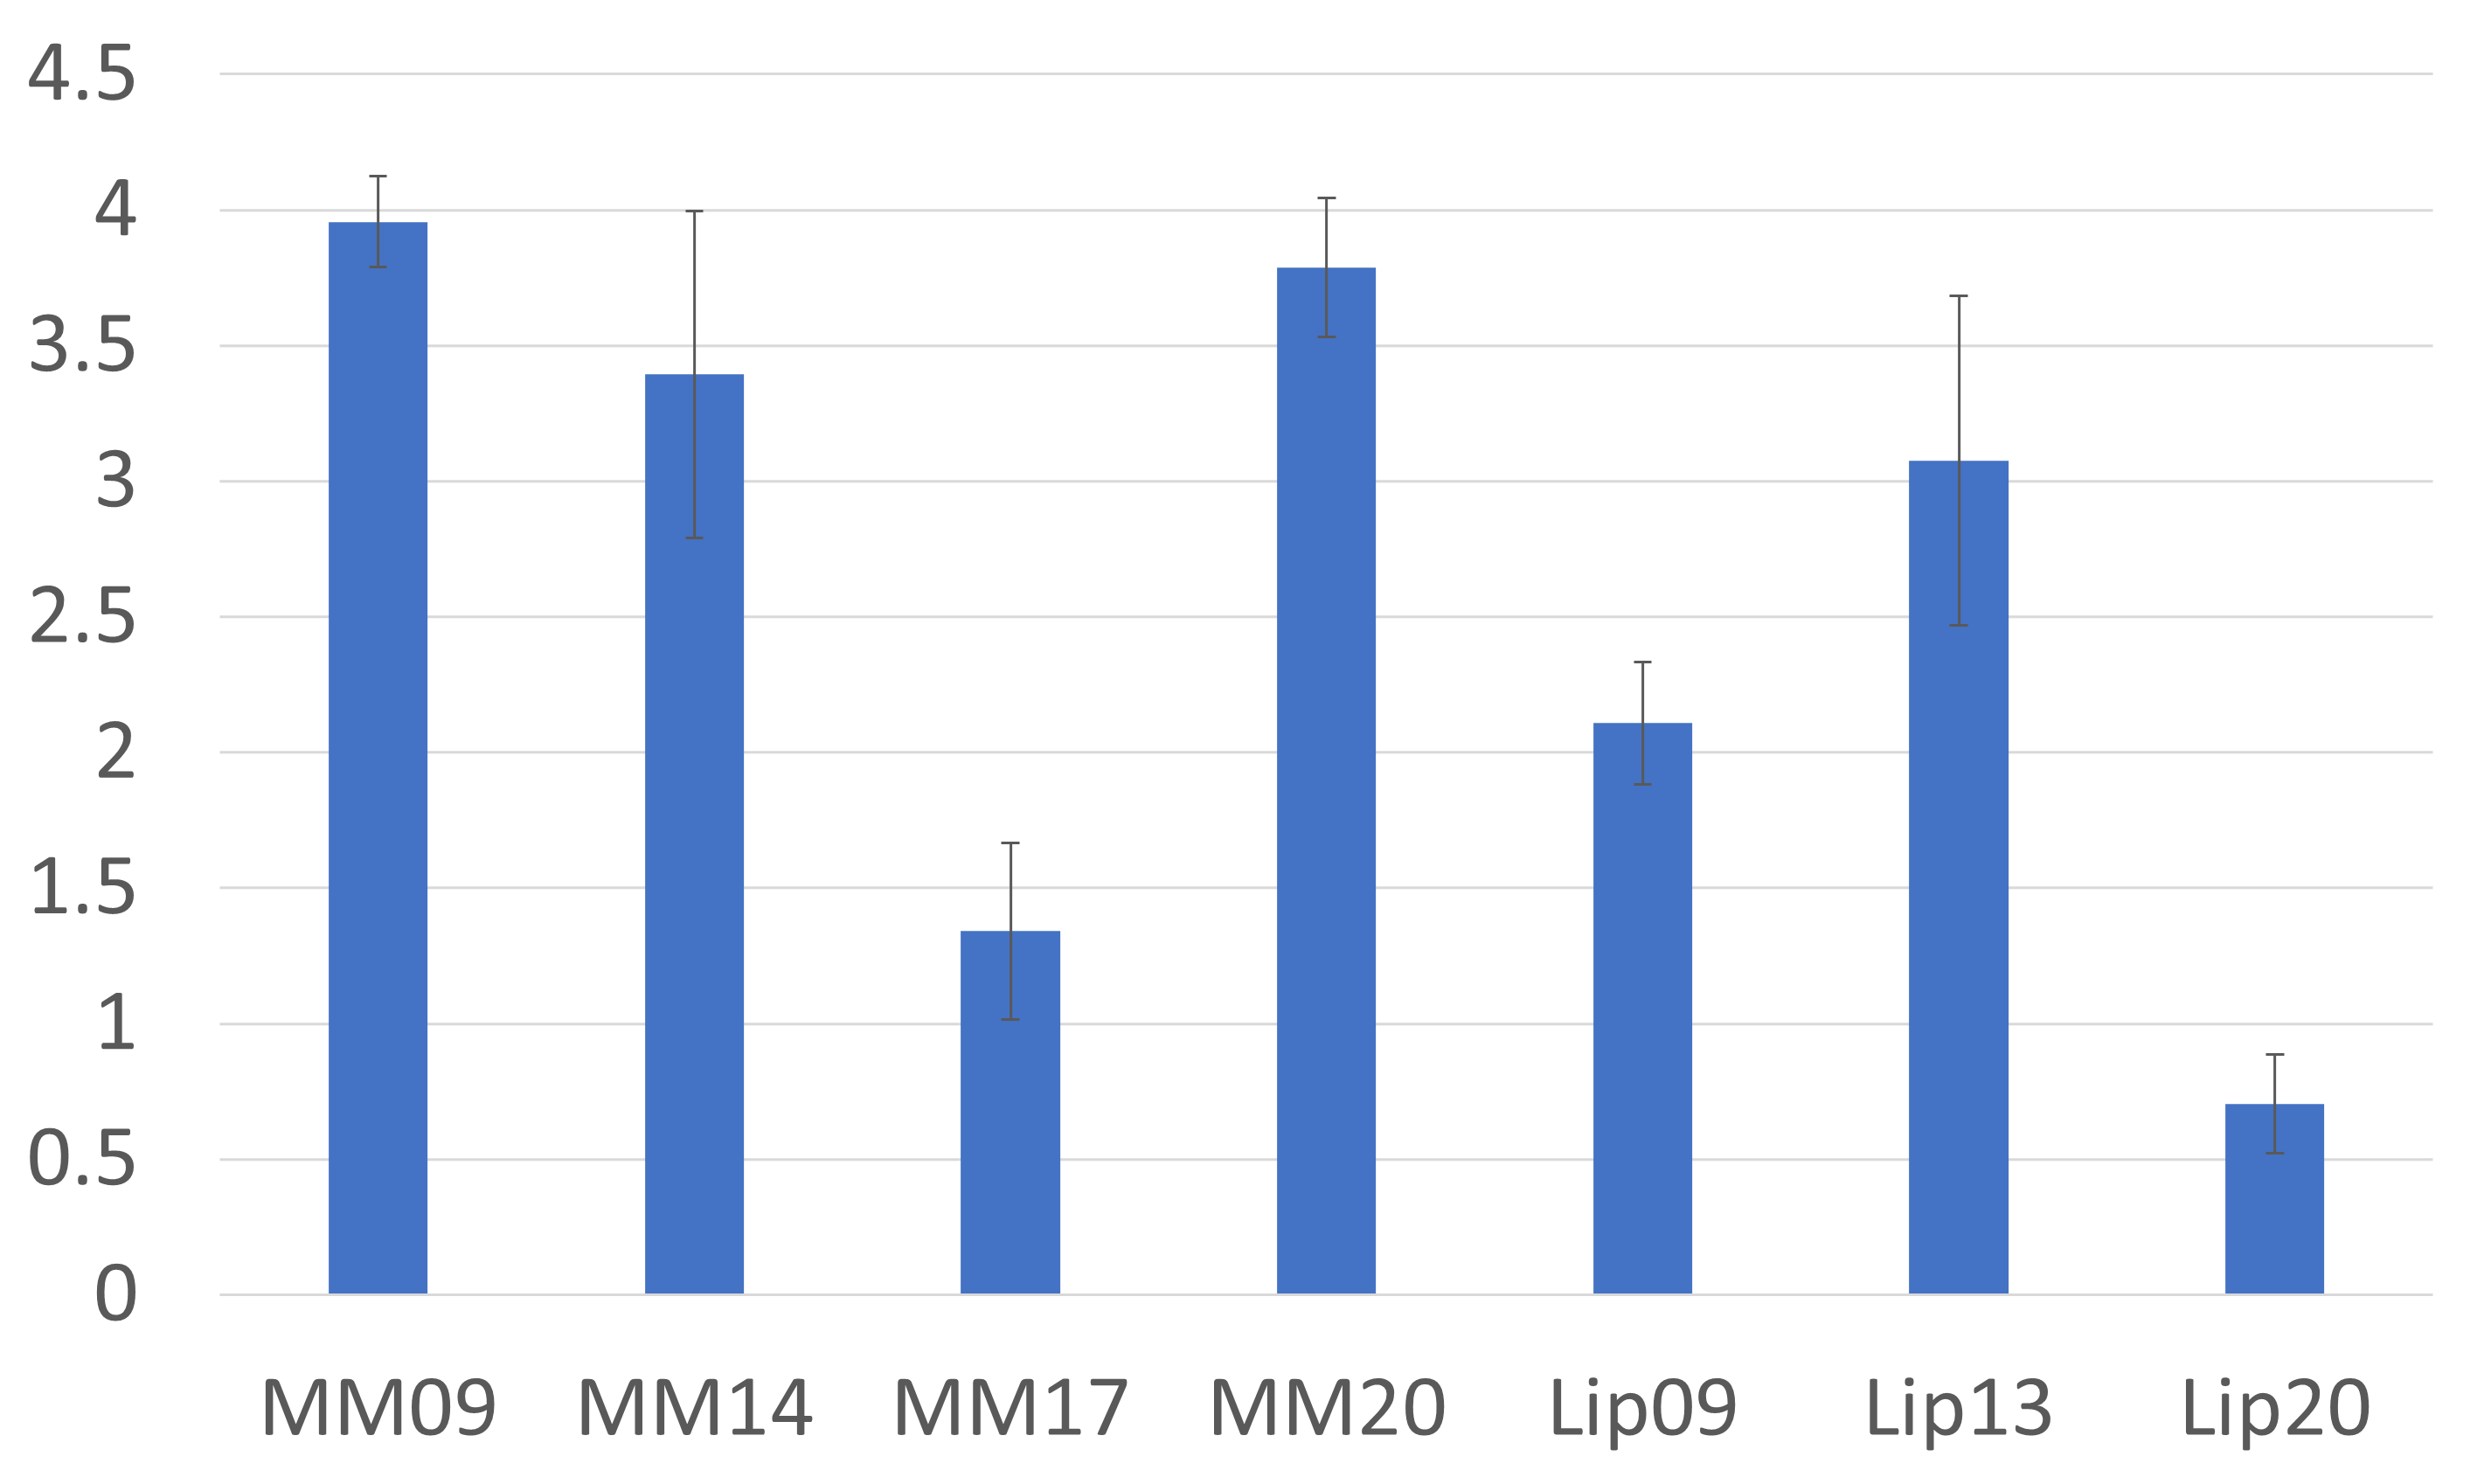
Figure 5: Macromolecular baseline estimations (macromolecules and lipids). Estimated concentrations are displayed in institutional units, with the water signal used as reference and tissue and relaxation corrections applied.