2534
B1+ Correction for 7T FID-CRT-MRSI
Philipp Lazen1, Bernhard Strasser1, Cornelius Cadrien1,2, Sukrit Sharma1, Lukas Hingerl1, Eva Niess1, Stanislav Motyka1, Alexandra Lipka1, Benjamin Spurny-Dworak3, Christoph Brandner4, Stephan Gruber1, Wolfgang Bogner1, Rupert Lanzenberger3, Karl Rössler2, Siegfried Trattnig1,5, and Gilbert Hangel1,2
1Department of Biomedical Imaging and Image-guided Therapy, Medical University of Vienna, Vienna, Austria, 2Department of Neurosurgery, Medical University of Vienna, Vienna, Austria, 3Department of Psychiatry and Psychotherapy, Medical University of Vienna, Vienna, Austria, 4Center for Medical Physics and Biomedical Engineering, Medical University of Vienna, Vienna, Austria, 5Institute for Clinical Molecular MRI, Karl Landsteiner Society, St. Poelten, Austria
1Department of Biomedical Imaging and Image-guided Therapy, Medical University of Vienna, Vienna, Austria, 2Department of Neurosurgery, Medical University of Vienna, Vienna, Austria, 3Department of Psychiatry and Psychotherapy, Medical University of Vienna, Vienna, Austria, 4Center for Medical Physics and Biomedical Engineering, Medical University of Vienna, Vienna, Austria, 5Institute for Clinical Molecular MRI, Karl Landsteiner Society, St. Poelten, Austria
Synopsis
We implemented B1+ correction for our metabolite concentration estimation and analyzed the influence of B1+ inhomogeneities. Since the B1+ field is relatively homogeneous in the center of the brain anyways, the biggest effects were observed closer to the fringes of the brain. The concentration estimates increased between 1.0% and 5.6% for different metabolites when comparing B1+ correction to simple T1 correction, remaining within the spectrum of values established by previous literature.
Introduction
One of the challenges faced by 7T magnetic resonance spectroscopic imaging (MRSI) is the inhomogeneity of the B1+ field and the resulting data impairment. For this study, we implemented a B1+ correction for our concentration estimate calculation1 and quantified the effect of this B1+ inhomogeneity correction. This abstract contains a preliminary evaluation.Methods
We measured seven volunteers (4 male, 3 female, mean age 24.3±4 years) using a protocol consisting of an MP2RAGE, a CRT-FID-MRSI (64x64x39, FOV: 220×220×133 mm, 3.4 mm isotropic voxel size, TR=450 ms, acquisition delay 1.3 ms, 39° flip angle, TA=15 min, WET water suppression) and a water reference MRSI scan (TR=200 ms, 27° flip angle, TA=200 s), and a B1+ map (128x128x10, FOV=250x250x113 mm, TR=6500 ms).The spectroscopic data was post-processed as described in previous work1,2 and subsequently spectrally fitted using LC Model3.
The B1+ correction process consisted of multiple steps which have been compiled in figure 1. First, the measured B1+ map was interpolated to the desired matrix size of 64x64x39. Since it was acquired using a sinc pulse and a different transmitter voltage U than the MRSI sequence, the B1+ map had to be modified using a simulated MRSI slice profile PMRSI with a full width at half maximum of 133mm, according to
$$B_1^{MRSI} = B_1^{Measured} P^{MRSI} U_{Used} / U_{Ref}$$
Next, for every voxel, the anticipated signal was calculated4 based on the local flip angle ɑL and the respective TR and T1 for each of the metabolites of interest (as well as water):
$$S_{B1} = M_0 sin(\alpha_L) (1-e^{-TR/T1})/(1-cos(\alpha_L) e^{-TR/T1})$$
For comparison, a signal map ST1 containing purely T1 correction terms was created analogously, with the only difference being that the local flip angle ɑL was replaced by the Ernst angle ɑE, thereby neglecting any local B1+ effects.
Due to the short acquisition delay used, T2 relaxation effects were omitted. The signal maps were calculated for grey matter (GM) and white matter (WM) and subsequently linearly combined based on FAST segmentation.
The amplitude maps of the metabolites and water, which generally contain values in institutional units, were normalized with regards to the influences of the B1+ field via division by the corresponding signal maps, and in conjunction with literature water concentrations CWater in GM and WM, internal water referencing was performed1.
$$C_{Met} = C_{Water} A_{Met} / A_{Water}$$
The resulting 3D map CMet describes the estimated concentration of a metabolite. For numerical analysis, averages and standard deviations of each concentration map were calculated for the entire brain as well as a single-slice volume of interest, both for T1 and B1+ correction. We also analyzed the calculated signal maps in both cases.
Results
The signal maps ST1 and SB1 differed by 7.5% to 10% when B1+ correction was performed. Together with the water signal map, this resulted in changes of the metabolite values by 3.8% for total choline (tCho), 1.0% for total creatine (tCr), 2.0% for glutamate (Glu), 5.6% for myo-inositol (Ins) and 2.9% for N-acetylaspartate (NAA). In a slice in the upper brain, where B1+ inhomogeneities are relatively small, the increase was only around 3.0% for tCho, 0.7% for tCr, 1.4% for Glu, 4.5% for Ins and 2.3% for NAA, and the deviation of the signal maps was smaller as well (see table 1).In absolute terms, the concentration estimate with T1 correction was 1.82±0.82 mM for tCho, 6.63±2.69 mM for tCr, 8.92±4.89 mM for Glu, 5.52±2.03 mM for Ins and 9.97±4.15 for NAA. B1+ correction increased those values to 1.89±0.86 mM for tCho, 6.70±2.74 mM for tCr, 9.09±5.04 mM for Glu, 5.83±2.15 mM for Ins and 10.25±4.31 mM for NAA. This difference is relatively small and changes in the maps are mainly visible in border regions, where the B1+ field becomes very weak, resulting in a significantly lower excitation and thus a bigger improvement due to the correction.
Figure 2 shows B1+ maps, figure 3 displays concentration estimate maps of NAA together with the corresponding signal maps, and lastly, figure 4 shows concentration estimates for tCho, tCr, Glu, Ins, and NAA.
Conclusion
B1+ correction has a small effect on metabolite concentration estimates for our method. Since B1+ effects vary significantly within the FOV, the correction is more significant in some areas than others, and it can be valuable when the regional evaluation is desired. The B1+ correction increased the concentration estimates compared to our previous publication, which had arrived at values on the lower end of the spectrum given by other literature1.This work is limited by the small number of volunteers and the resolution of the B1+ map. Improvements in B0 shimming as well as parallel transmit RF pulses could further improve our method. The development of a voxel- or ROI-wise analysis pipeline as a replacement for map averages should also lead to more reliable data.
Acknowledgements
This work was supported by the Austrian Science Fund (FWF) grants KLI-646, P 30701 and P 34198.References
- Hangel G, Spurny-Dworak B, Lazen P et al. Inter-subject stability and regional concentration estimates of 3D-FID-MRSI in the human brain at 7 T, 2021. NMR in Biomed. https://doi.org/10.1002/nbm.4596
- Hangel G, Cadrien C, Lazen P, et al. High-resolution metabolic imaging of high-grade gliomas using 7T-CRT-FID-MRSI. NeuroImage Clin. https://doi.org/10.1016/j.nicl.2020.102433
- Provencher SW. Automatic quantitation of localized in vivo 1H spectra with LCModel. NMR Biomed. https://doi.org/10.1002/nbm.698
- Bernstein MA, King KF, Zhou XJ. Handbook of MRI Pulse Sequences. Elsevier; 2004. https://doi.org/10.1016/B978-0-12-092861-3.X5000-6
Figures

Figure 1: Flowchart of the B1+ correction process.
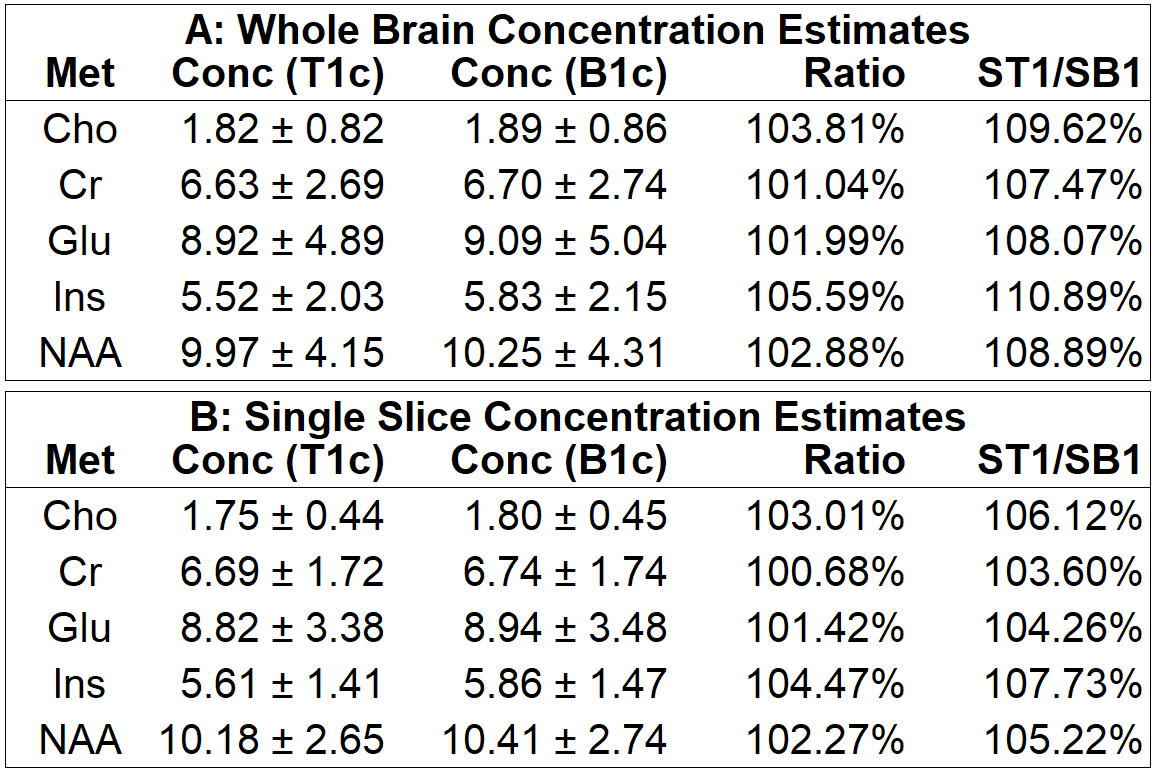
Table 1: Estimated concentration values in mM for the metabolites choline, creatine, glutamate, inositol and N-acetylaspartate in the entire brain (A) and a single slice (B). Shown are the mean values and their standard deviation for a T1 correction (T1c) and a B1+ correction (B1c) as well as the ratio between the means. Additionally, the average signal increase when correcting for the B1+ inhomogeneity is displayed as a ratio of the signal maps ST1 and SB1.

Figure 2: B1+ maps of three volunteers, normalized to the Ernst angle. The B1+ inhomogeneities lead to a higher flip angle in the center of the head that diminishes further outwards. The B1+ correction implemented by this work can correct for this discrepancy.

Figure 3: Concentration estimates in volunteer 2 of NAA with T1 correction (T1c), B1+ correction (B1c) and the relative change of the two when introducing B1+ correction. The signal maps for T1c and B1c and the ratio of the two are also shown. Lastly, a B1+ map normalized to the Ernst angle is shown on the right.

Figure 4: B1+ corrected concentration estimates in millimolar for tCho, tCr, Glu, Ins and NAA.
DOI: https://doi.org/10.58530/2022/2534