2533
Macromolecular background signals for gray and white matter regions in the human brain as defined from strong diffusion-weighted MR spectroscopy1Magnetic Resonance Methodology, Institute of Diagnostic and Interventional Neuroradiology, University of Bern, Bern, Switzerland, 2Translational Imaging Center, sitem-insel, Bern, Switzerland, 3Cardiff University Brain Research Imaging Centre (CUBRIC), School of Psychology, Cardiff University, Cardiff, United Kingdom, 4Max-Planck Institution for Human Cognitive and Brain Sciences, Leipzig, Germany
Synopsis
Diffusion-weighted MRS was successfully implemented at short TE, reaching ultra-high b values >20 ms/μm2 on a 3T Siemens Connectom system. With simultaneous fitting for different b-value spectra, macromolecular background patterns are estimated using different approaches to model metabolite diffusion and different macromolecular signal parameterization in gray matter and white matter.
Introduction
Signals from macromolecules overlap the resonances from small molecules (“metabolites”) and substantially complicate quantification, particularly at short echo times (TE). Macromolecules (MMs) differentiate from metabolites by their shorter T1 and T2 relaxation times1 and up to 20 times slower apparent diffusion coefficient2. Thus, various methods for estimating MM background signals (MMBG) have been proposed: exploiting the relaxation differences in single3,4 or multiple spectra when combined with multidimensional modelling5,6, or in combination with diffusion-weighted MR spectroscopy (DW-MRS)7. If diffusion weighting alone is to be used to determine the MMBG, very high b-values are required, given the slow diffusion coefficients of metabolites compared to water, and if MMBG is to be determined for short TEs, where they are most relevant in clinical MRS, it is ideal to use STEAM localization on an MR system with very strong gradients. Hence, in addition to shedding light on cytoarchitecture, DW-MRS can also be used to determine the MMBG in particular if combined with simultaneous multidimensional fitting8. In this work, three questions are addressed:A) Does DW-MRS reveal differences for the MMBG signal from gray and white matter?
B) Which diffusion model for metabolite signals is best suited to define the MMBG?
C) Does the parameterization model influence the estimated MMBG pattern?
Methods
Spectra were recorded with a Siemens Connectom System (300 mT/m gradient amplitude) and a DW-STEAM sequence (TE 30 ms) with metabolite-cycling (MC) to localize supra-ventricular white matter (WM) (5-10 cm3, 14 subjects) and predominantly gray matter (GM) in the occipito-parietal cortex (13-35 cm3, 12 subjects). Diffusion-weightings (diffusion time Δ=80 ms) up to 23.1 and 25.1 ms/μm2 were achieved in WM (diffusion-weighting approximately along the fibers) and GM (diffusion-weighting in space diagonal), respectively. Peripheral pulse triggering was used with actual repetition times (TR) monitored for appropriate T1 saturation correction8.Spectral data were processed in JMRUI, Matlab, and Python. Water signals isolated from MC were used for eddy-current, phase, and frequency shift correction and motion compensation (MoCom)9. Additional motion compensation was achieved relying on the MM peak at 0.94 ppm (MMCorr) as a reference to correct remaining motion-related artifacts8,10. Finally, cohort averages were prepared for the fitting of the data.
Twenty metabolites were simulated as a metabolite basis set, and two MM baseline models adapted from the literature8,11 were used to determine the MM spectrum using the simultaneous fitting tool FiTAID12:
MMBG Model I: Model8 consisting of 80 equally-spaced Voigt lines with fixed Lorentzian and Gaussian widths (10 Hz and 5 Hz, respectively).
MMBG Model II: A ultra-high-field spectral model11, dividing the MMBG into 4 regions, each heuristically composed of 6 to 11 Gaussian basis functions with published offsets and linewidths, which were converted from 17.2 to 3T spectra.
Initial fits using the 9 and 6 least motion-corrupted datasets yielded an ADC for the MM of 3.76 x 10⁻³ and 3.40 x 10⁻³ μm2/ms (R2=0.70 & R2=0.72) in WM and GM data, respectively. Various diffusion constraints for metabolites were used in the simultaneous fit in the final fitting step. Table 1 charts all scenarios used. MMBGs were extracted from these fits and compared for differences between WM and GM and for the influence of metabolite diffusion and MM parameterization models.
Results & Discussion
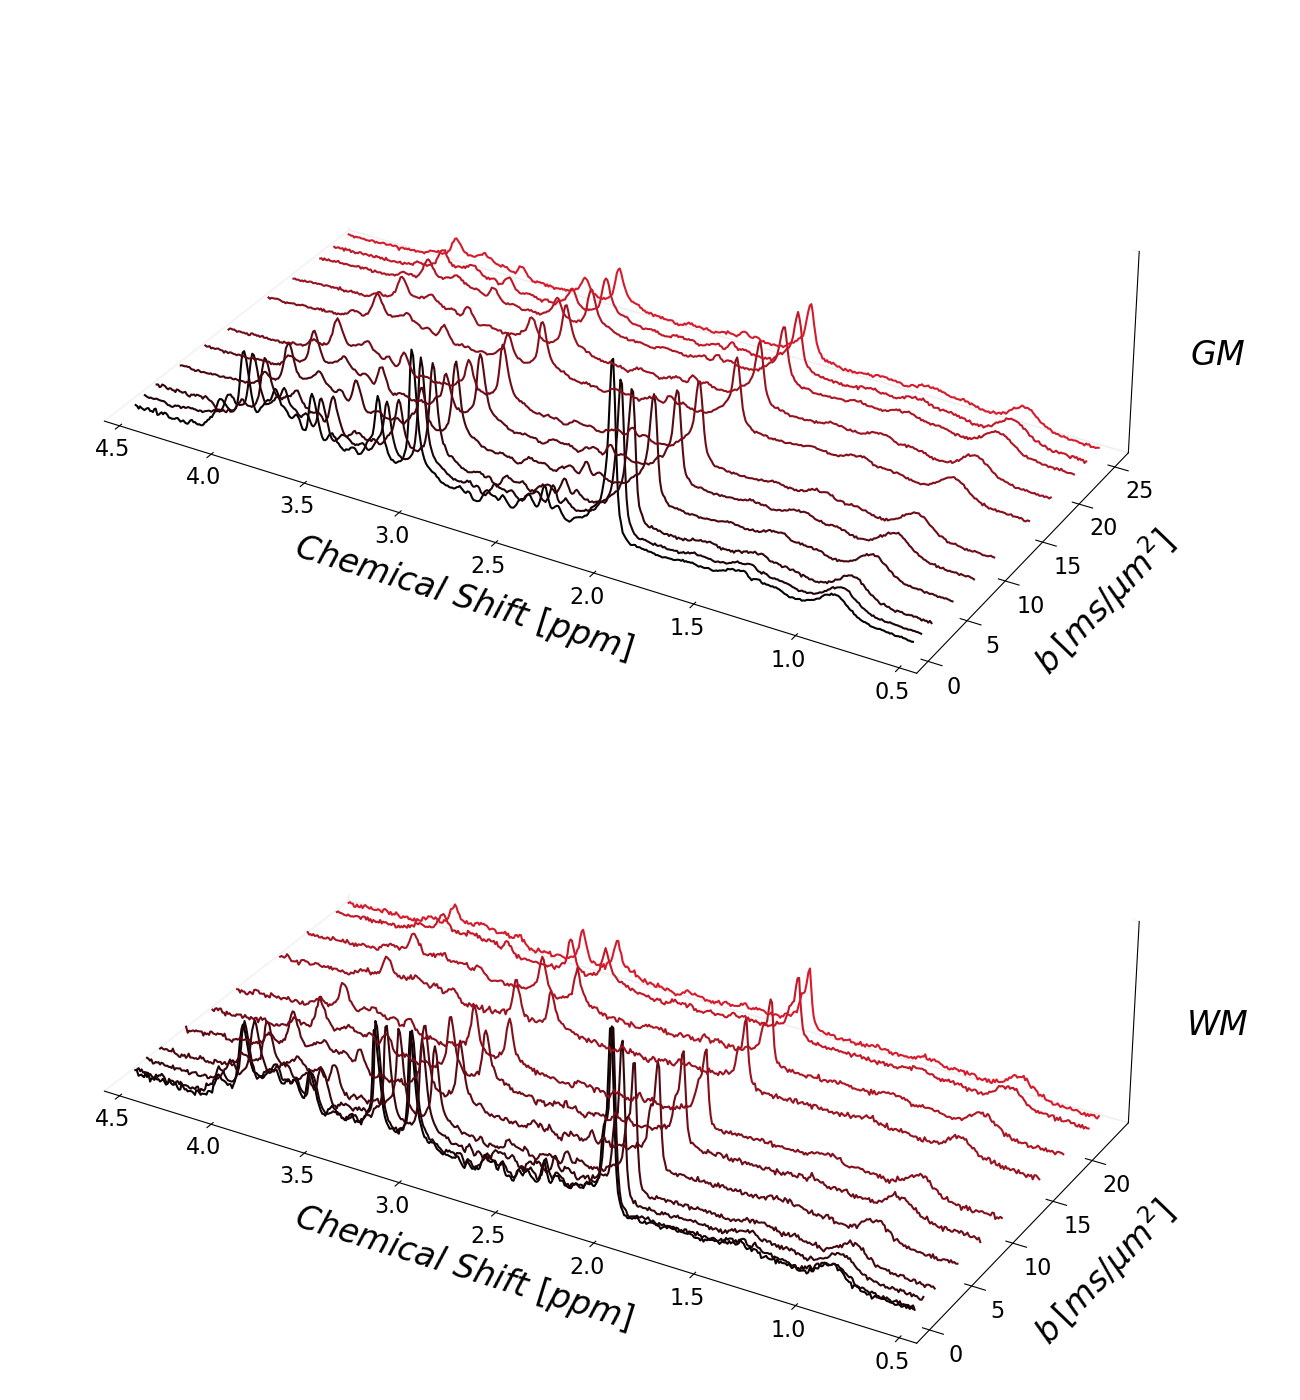
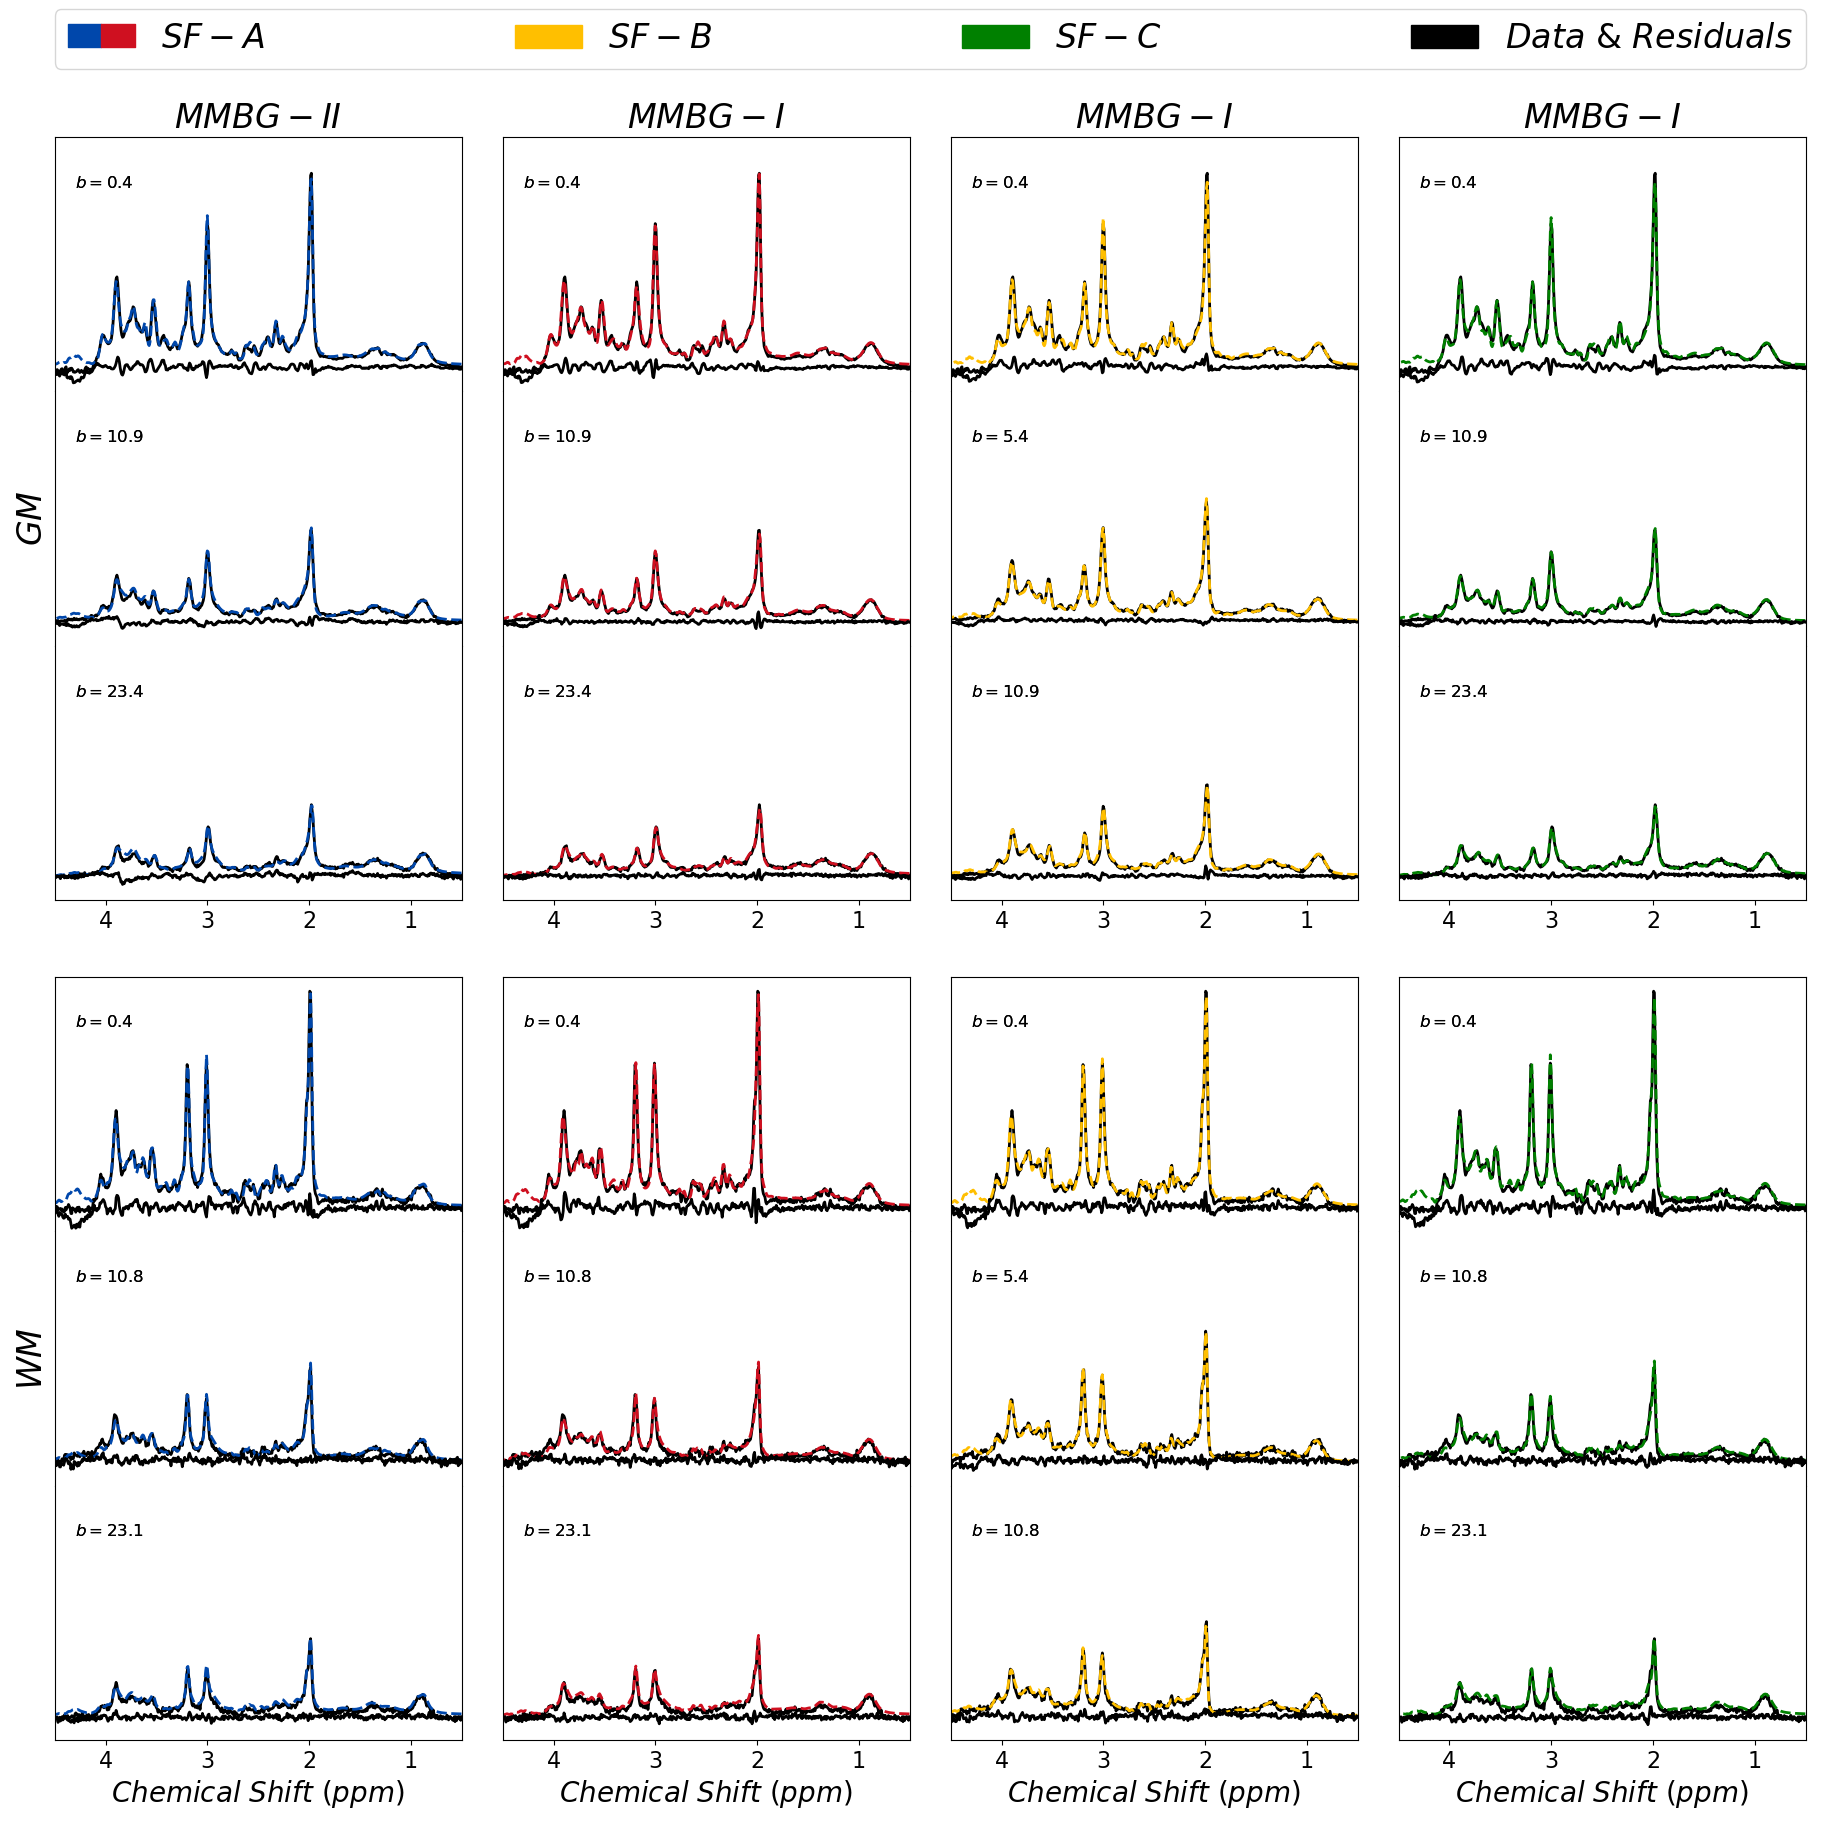
Figure 1 presents the cohort spectra after all correction steps. The relatively low SNR in WM is related to the smaller voxel size.Representative fit results for WM and GM and all treated cases are depicted in figure 2 (3 b-values per case). MMBG-II is seen to be ill-composed to represent the MM peak at ~1.6ppm.
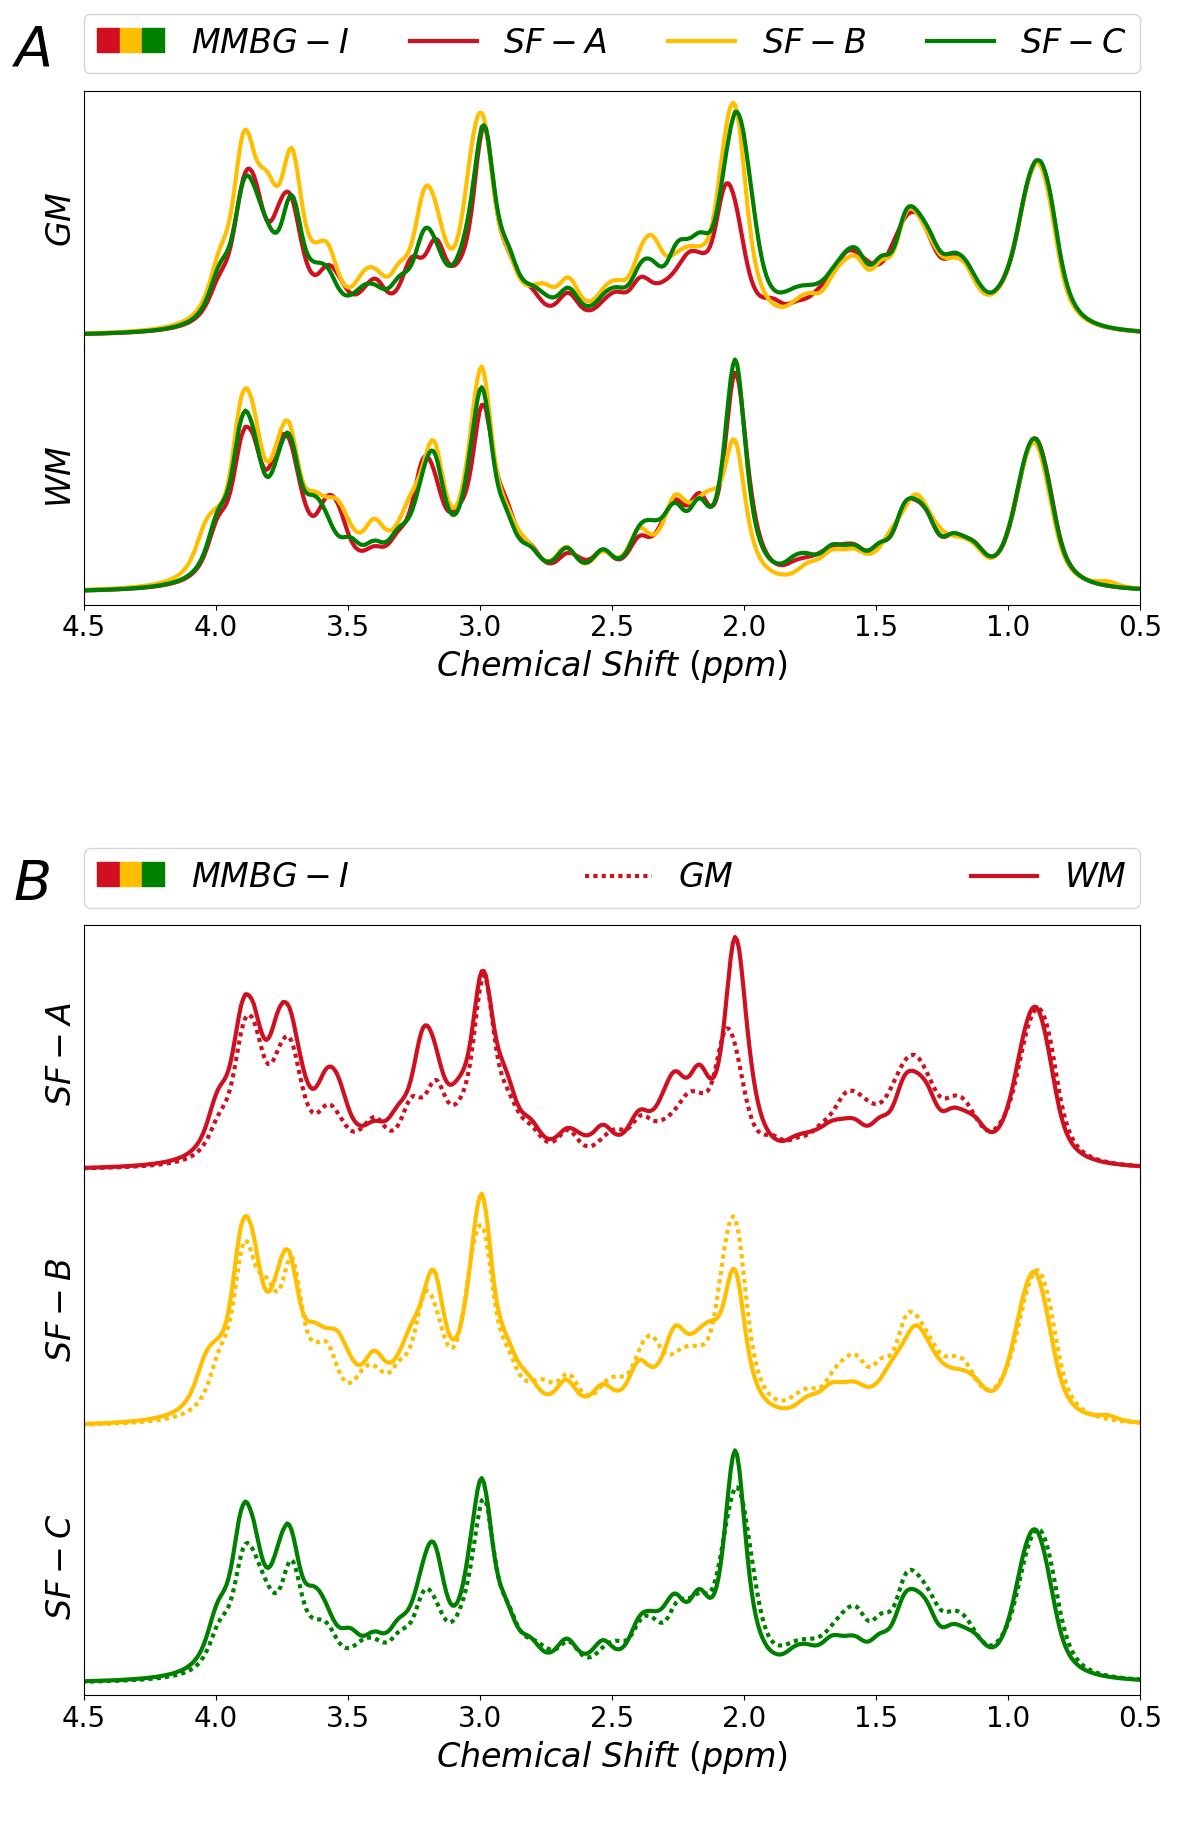
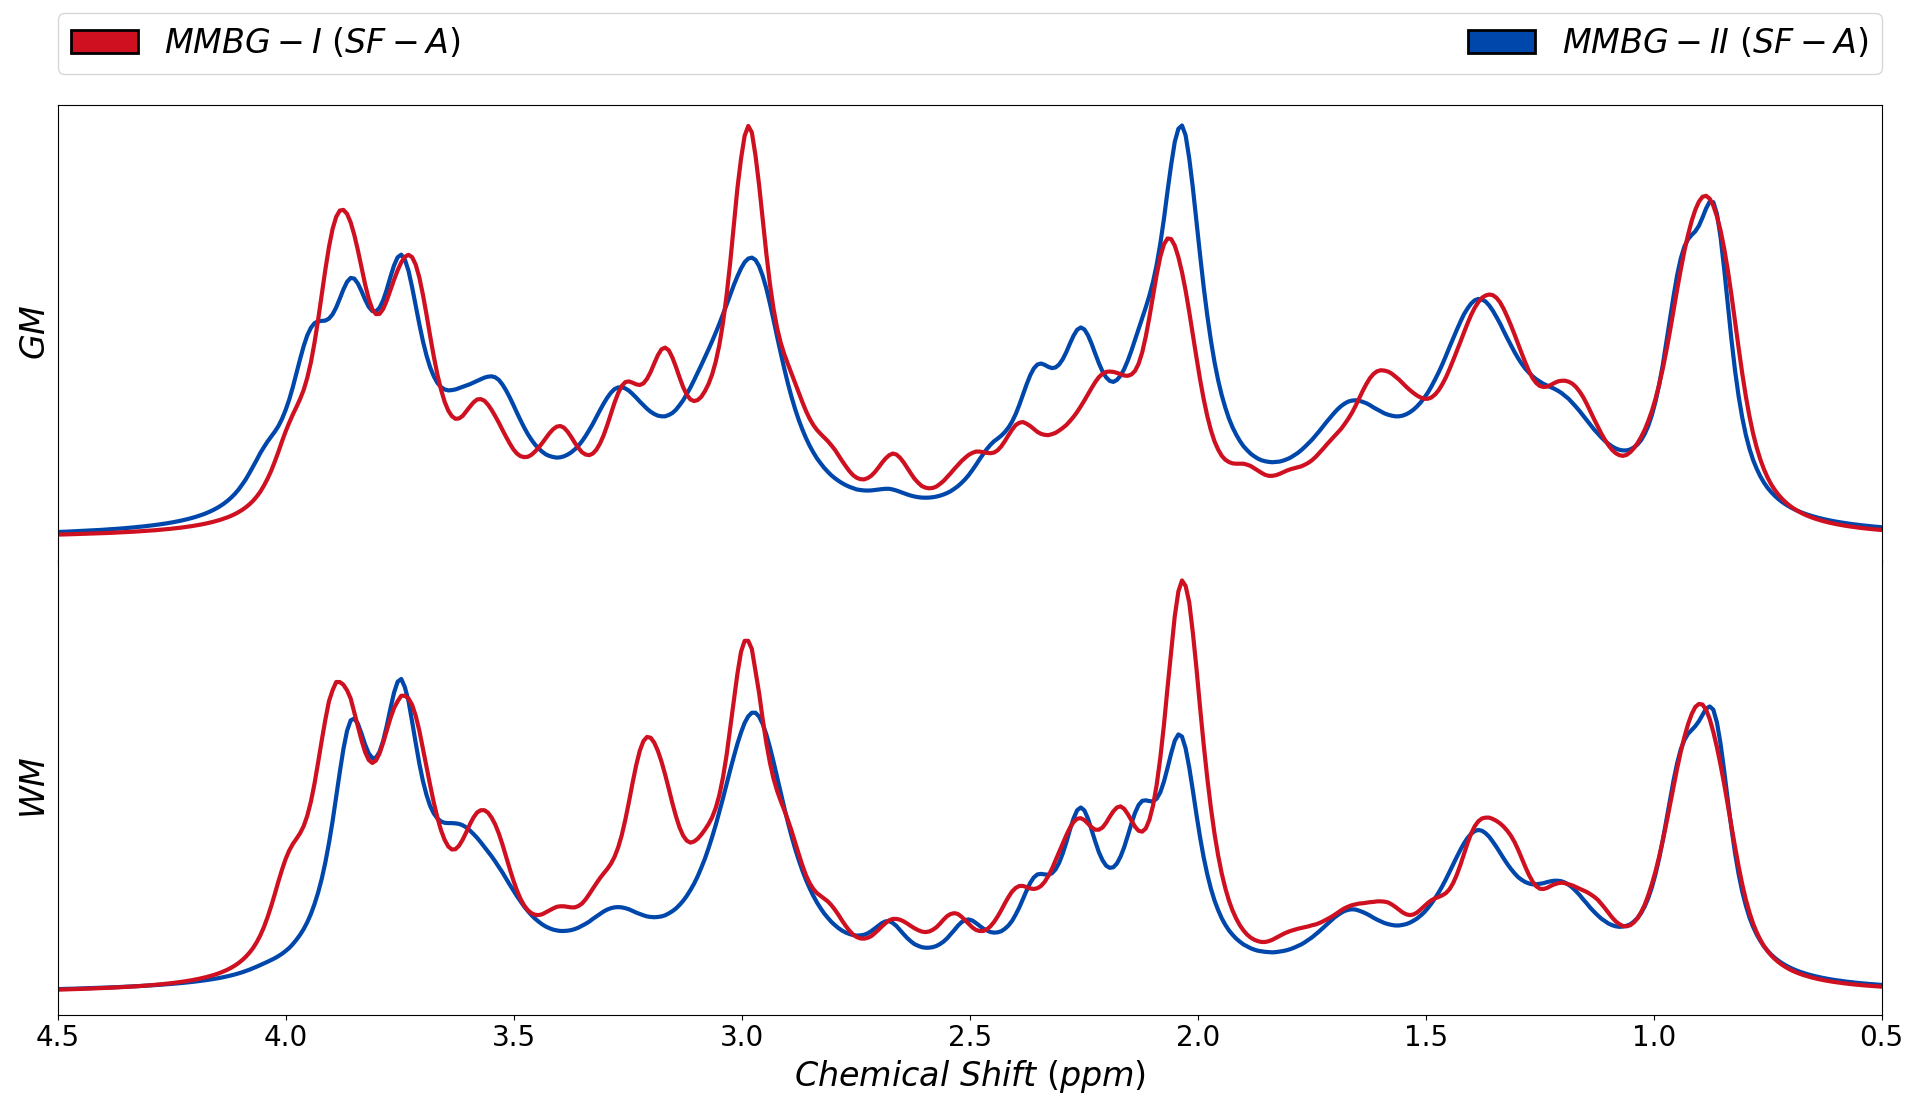
Figure 3 juxtaposes different fitting schemes (priors on metabolite diffusion) in A) and WM vs. GM in B). The different models show clear differences throughout those spectral regions with major metabolite contributions (except around 3ppm). SF-A has the largest freedom to adjust any metabolite signals per spectrum, reducing trust in its MMBG definition. SF-B seems to be best suited in theory (monoexponential decay in modest b-value range), but then lacks the large b-values with the largest suppression of metabolite signals, while SF-C thus may be preferable even though the biexponential model also has considerable freedom, even if only used for the most prominent metabolites. MMBG from WM and GM are consistently distinct near 1.6ppm; other differences seem to depend on the diffusion model. MMBG parameterization is compared in figure 4. The model adapted from high field does not seem appropriate (e.g., at 1.6ppm) and lacks the flexibility to adapt to the current observations based on diffusion-weighting and lower B0.
Conclusions
- DW-MRS on a system with strong gradients allows the determination of the MMBG at short TE to be used as a basis component for clinical studies.
- The non-mono-exponential diffusion decay of metabolite signals is a clear limitation for the definition of the MMBG based on high diffusion weighting.
- Variation of metabolite diffusion models, parameterizations of the MMBG pattern, and use of a limited b-value range show that the final pattern depends on many parameters. Better SNR data may be needed for a better definition of the metabolite signal behavior.
- Differences for MMBG in WM and GM are observed, but given the modeling uncertainties cannot be uniquely defined.
Acknowledgements
No acknowledgement found.References
1. Cudalbu, C. et al. Contribution of macromolecules to brain 1H MR spectra: Experts’ consensus recommendations. NMR Biomed. 34, e4393 (2021).
2. Pfeuffer, J., Tkác, I. & Gruetter, R. Extracellular-intracellular distribution of glucose and lactate in the rat brain assessed noninvasively by diffusion-weighted 1H nuclear magnetic resonance spectroscopy in vivo. J. Cereb. Blood Flow Metab. 20, 736–746 (2000).
3. Behar, K. L. & Ogino, T. Characterization of macromolecule resonances in the 1H NMR spectrum of rat brain. Magn. Reson. Med. 30, 38–44 (1993).
4. Giapitzakis, I.-A., Avdievich, N. & Henning, A. Characterization of macromolecular baseline of human brain using metabolite cycled semi-LASER at 9.4 T. Magn. Reson. Med. 80, 462–473 (2018).
5. Chong, D. G. Q., Kreis, R., Bolliger, C. S., Boesch, C. & Slotboom, J. Two-dimensional linear-combination model fitting of magnetic resonance spectra to define the macromolecule baseline using FiTAID, a Fitting Tool for Arrays of Interrelated Datasets. Magn. Reson. Mater. Physics, Biol. Med. 24, 147–164 (2011).
6. Hoefemann, M., Bolliger, C. S., Chong, D. G. Q., van der Veen, J. W. & Kreis, R. Parameterization of metabolite and macromolecule contributions in interrelated MR spectra of human brain using multidimensional modeling. NMR Biomed. 33, e4328 (2020).
7. Kunz, N. et al. Diffusion-weighted spectroscopy: A novel approach to determine macromolecule resonances in short-echo time 1H-MRS. Magn. Reson. Med. 64, 939–946 (2010).
8. Simsek, K., Döring, A., Pampel, A., Möller, H. E. & Kreis, R. Simultaneous spectral and bi-exponential diffusion modeling of doubly motion-corrected human brain spectra with very high b-values. in Proc. Intl. Soc. Mag. Reson. Med. 29 (2021).
9. Döring, A., Adalid, V., Boesch, C. & Kreis, R. Diffusion-weighted magnetic resonance spectroscopy boosted by simultaneously acquired water reference signals. Magn. Reson. Med. 80, 2326–2338 (2018).
10. Ligneul, C., Palombo, M. & Valette, J. Metabolite diffusion up to very high b in the mouse brain in vivo: Revisiting the potential correlation between relaxation and diffusion properties. Magn. Reson. Med. 77, 1390–1398 (2017).
11. Lopez-Kolkovsky, A. L., Mériaux, S. & Boumezbeur, F. Metabolite and macromolecule T1 and T2 relaxation times in the rat brain in vivo at 17.2T. Magn. Reson. Med. 75, 503–514 (2016).12. Adalid, V. et al. Fitting interrelated datasets: metabolite diffusion and general lineshapes. Magn. Reson. Mater. Physics, Biol. Med. 30, 429–448 (2017).
Figures