2527
Deep learning framework for accelerating revised-NODDI parameter estimation with tensor-valued diffusion encoding1Computer Science & Centre for Medical Image Computing, University College London, London, United Kingdom, 2AINOSTICS, Manchester, United Kingdom
Synopsis
This work demonstrates the feasibility of using deep learning (DL) to accelerate revised-NODDI parameter estimation with data acquired using tensor-valued diffusion encoding (TVDE). Revised-NODDI is a recently proposed version of NODDI which showed improved compatibility with TVDE. Thanks to this compatibility the model has an extra free parameter to be estimated which, with conventional fitting methods, further slowdown NODDI’s time-demanding parameter estimation. DL methods can vastly accelerate this process. We show that accurate estimation of revised-NODDI parameters can be obtained via a DL framework. We compare the results with those obtained with conventional fitting methods.
Introduction
This work assesses the feasibility of using a deep learning (DL)-based framework for accelerating revised-NODDI model parameter estimation using data from the new generation of diffusion MRI (dMRI) acquisitions known as tensor-valued diffusion encoding (TVDE).TVDE generalizes the concept of b-value to that of b-tensor1,2 providing additional information in the dMRI signal. Revised-NODDI is a recently introduced version of NODDI model3,4, which has been shown to improve the model compatibility with TVDE measurements5.
In the framework of biophysical modeling, TVDE is relevant as it can reduce the model parameter estimation bias. Namely, the orthogonal information offered by TVDE can be used to relax some model assumptions, refining, in principle, the parameter estimation6.
For revised-NODDI, a combination of TVDE acquisitions can be used to directly estimate the intra-neurite diffusivity7, which is fixed to a default value in the original version of the model. Linear tensor encoding (LTE), corresponding to the conventional diffusion MRI acquisitions, and spherical tensor encoding (STE) have been previously used4,5.
However, the parameter estimation using conventional fitting methods is known to be computationally slow and the presence of extra parameters to be estimated can further slowdown the process. Deep neural networks (DNNs) have been applied previously to accelerate the estimation of microstructure parameters from dMRI data8-11. This work aims to demonstrate that DNNs can be used to accelerate revised-NODDI parameter estimation from TVDE data.
Materials and Methods
The experimental design is summarized in figure 1. We design a DNN which takes TVDE data as input and outputs revised-NODDI parameter estimations. We train the network on synthetic data and test it on in-vivo data. We compare the DNN estimated parameters with those obtained by fitting the model to the TVDE data. The output maps will serve as ground truth (GT).In-vivo data
We use the dataset publicly available at https://github.com/filip-szczepankiewicz/Szczepankiewicz_DIB_201912. In brief, the dataset comprises one subject acquired with multiple TVDEs. In this work we consider data acquired with LTE and STE.
DNN architecture
The input of the network is the direction-averaged signal; the outputs are the revised-NODDI parameters. Specifically, we focus on predicting the neurite density index (NDI), the free-water fraction (FWF) and the isotropic intra-neurite diffusivity (dI)13. The network comprises three hidden layers with 150 nodes each and ReLU8. A mean squared error loss is used between the network predictions and the parameters used to generate the synthetic signal. The DNN is trained in 200 epochs with a batch size of 250, a learning rate of 0.001 and Adam optimizer. The validation set is the 25% of the input sample.
Synthetic data
We generate synthetic signal from N=104 combinations of model parameters randomly sampled from a uniform distribution between 0 and 1 (figure 2). The parameter combinations are used to generate LTE and STE data via the forward revised-NODDI model using the in-vivo data protocol. We add Rician noise to each measurement such that SNR(b=0)=30. We direction-average the signal to forgo directional dependence of the signal.
Results and discussions
Figure 3 shows that the DNN can predict revised-NODDI parameters from TVDE in-vivo data. The NDI predictions are accurate throughout the brain, however there is a slight overestimation of NDI in highly coherent white matter (WM) tracts such as corpus callosum. The FWF predictions are slightly overestimated in the whole parenchyma, while the dI parameter appears marginally underestimated.Figures 4 confirms quantitatively the previous observations with the mean of the difference between predictions and GT close to zero both in in grey matter (GM) and WM. FWF and dI bias is more evident in WM compared to GM.
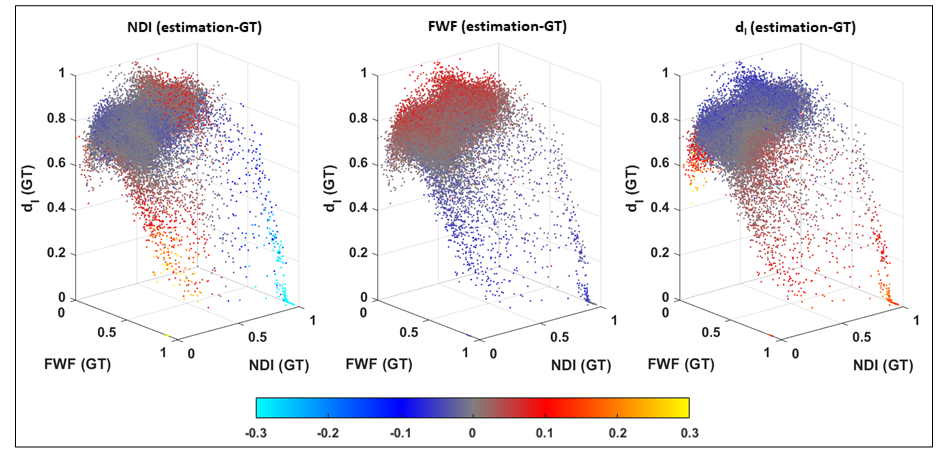
Figure 5 does not show obvious correlation patterns between bias estimation and GT parameters. A positive NDI bias is confirmed at high values of the GT. A moderate correlation between FWF dI is can be observed. A higher negative bias of dI seem to correspond to low values of FWF.
Conclusions
We show that a DL framework can be used to accelerate revised-NODDI parameters estimation. The training takes approximately 3 minutes and the parameter prediction is practically instantaneous. This compares to the conventional fitting approach which takes about four hours and half using 12 cores.We used broad distribution of the training labels. This should ensure generalizability at expanses of parameter estimation accuracy. More accurate prediction should be possible with refined choice of the parameter distribution as well as fine tuning the network.
Acknowledgements
No acknowledgement found.References
1. Westin, C.F., et al., Q-space trajectory imaging for multidimensional diffusion MRI of the human brain. Neuroimage, 2016. 135: p. 345-62.
2. Topgaard, D., Multidimensional diffusion MRI. J Magn Reson, 2017. 275: p. 98-113.
3. Zhang, H., et al., NODDI: practical in vivo neurite orientation dispersion and density imaging of the human brain. Neuroimage, 2012. 61(4): p. 1000-16.
4. Guerreri, M., et al., Revised NODDI model for diffusion MRI data with multiple b-tensor encodings, in International Society for Magnetic Resonance in Medicine. 2018: Paris, France.
5. Guerreri, M., et al., Tortuosity assumption not the cause of NODDI’s incompatibility with tensor-valued diffusion encoding, in International Society for Magnetic Resonance in Medicine. 2020: Virtual conference.
6. Szczepankiewicz, F., et al., The link between diffusion MRI and tumor heterogeneity: Mapping cell eccentricity and density by diffusional variance decomposition (DIVIDE). Neuroimage, 2016. 142: p. 522-532.
7. Lampinen, B., et al., Neurite density imaging versus imaging of microscopic anisotropy in diffusion MRI: A model comparison using spherical tensor encoding. Neuroimage, 2017. 147: p. 517-531.
8. Golkov, V., et al., q-Space Deep Learning: Twelve-Fold Shorter and Model-Free Diffusion MRI Scans. IEEE Trans Med Imaging, 2016. 35(5): p. 1344-1351.
9. Barbieri, S., et al., Deep learning how to fit an intravoxel incoherent motion model to diffusion-weighted MRI. Magn Reson Med, 2020. 83(1): p. 312-321.
10. Gyori, N., et al. In-vivo neural soma imaging using b-tensor encoding and deep learning. in Proceedings of the 27th Annual Meeting of ISMRM, Montreal, Canada. 2019.
11. de Almeida Martins, J.P., et al., Neural networks for parameter estimation in microstructural MRI: Application to a diffusion-relaxation model of white matter. Neuroimage, 2021. 244: p. 118601.
12. Szczepankiewicz, F., S. Hoge, and C.F. Westin, Linear, planar and spherical tensor-valued diffusion MRI data by free waveform encoding in healthy brain, water, oil and liquid crystals. Data Brief, 2019. 25: p. 104208.
13. Eriksson, S., et al., NMR diffusion-encoding with axial symmetry and variable anisotropy: Distinguishing between prolate and oblate microscopic diffusion tensors with unknown orientation distribution. Journal of Chemical Physics, 2015. 142(10): p. 104201.
Figures
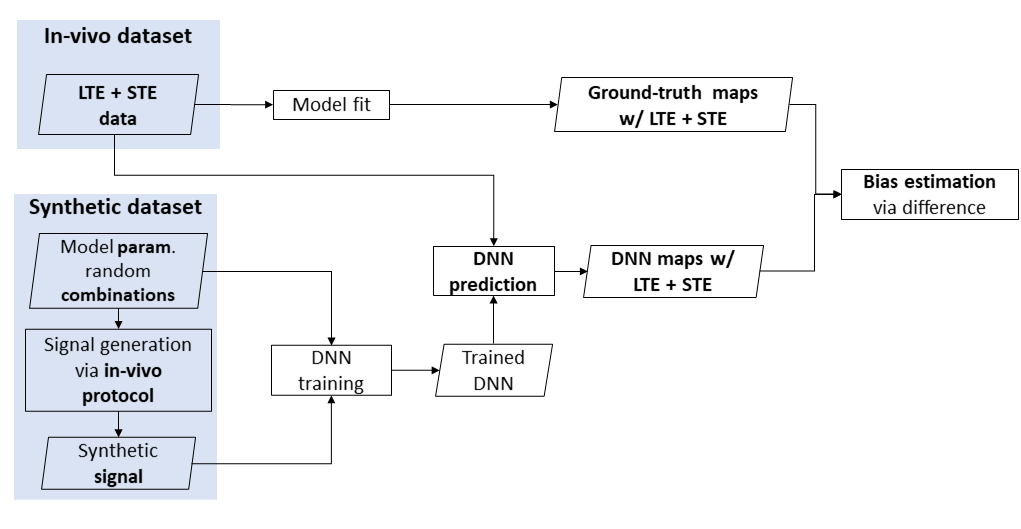
Fig 1: schematic view of the experimental design. The ground truth is obtained fitting revised-NODDI model to spherical tensor encoding (STE) and linear tensor encoding (LTE) in-vivo data. The DNN is trained using LTE and STE synthetic data. Model parameter predictions are obtained from unseen LTE+STE in-vivo data. Bias of the estimations are obtained computing the difference between the predictions and their ground truth.

Fig 2: revised-NODDI parameter distribution of the synthetic data. The neurite density index (NDI), intra-neurite isotropic diffusivity (dI) and orientation dispersion index (ODI) are sampled from a uniform distribution between 0 and 1. The free water fraction (FWF) is sample from a bimodal distribution between 0 and 1 with the highest pick close to zero and a lower pick close to one.
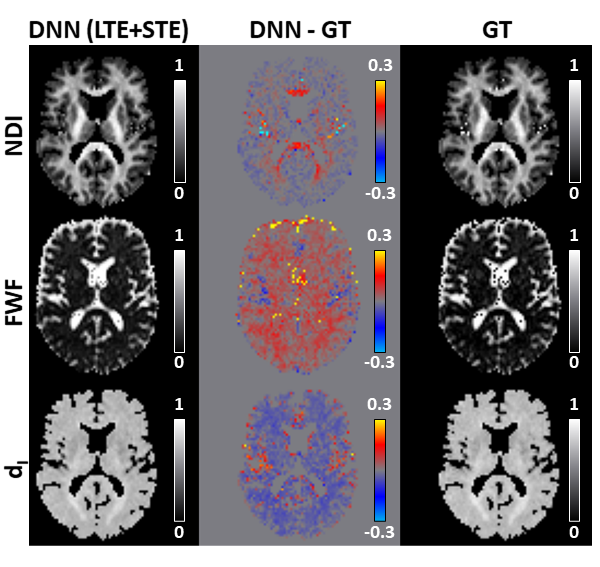
Fig 3: revised-NODDI maps via deep neural network (DNN) vs ground truth (GT). We compare one representative slice of neurite density index (NDI), free water fraction (FWF) and intra-neurite isotropic diffusivity (dI) parametric maps predicted by the DNN (left column) using both linear tensor encoding (LTE) and spherical tenso encoding (STE) with the GT (right column). GT here is represented by the maps obtained by fitting the revised-NODDI model to LTE and STE data jointly. The middle column shows the DNN-GT difference maps.
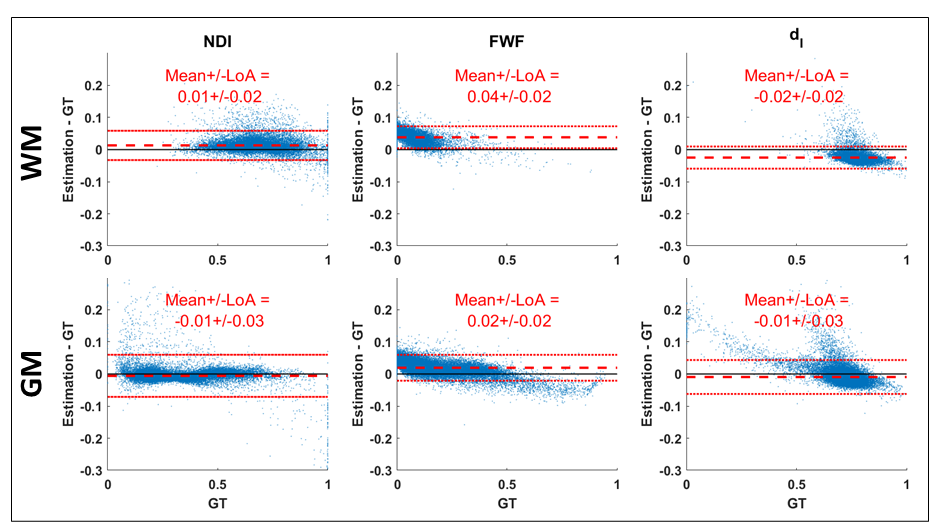
Fig 4: estimation bias of revised-NODDI parameters determined by the DNN. The figure shows Bland-Altman plots of NDI, FWF and dI. The plots are shown separately for white matter (WM) and grey matter (GM). The red dashed line indicates the mean value of the difference between the estimated parameter values and the ground-truth. The red dotted lines indicate 95% limits of agreement (LoA).