2524
Amide Proton Transfer (APT) Mapping from Undersampled Z-spectra in the Brain Using Deep Learning1Biomedical Imaging Research Institute, Cedars Sinai Medical Center, Los Angeles, CA, United States, 2Department of Bioengineering, University of California, Los Angeles (UCLA), Los Angeles, CA, United States
Synopsis
CEST Imaging requires radio frequency pulses at several frequency offsets to generate CEST maps (APT, NOE, DS, MT). In this study, we aimed to generate APT maps from CEST images of undersampled frequency offsets using deep learning, which can potentially reduce the total scan time of CEST imaging. The Z-spectrum was undersampled by a factor of 3.5 using the Fisher information gain analysis. Fitting results from the proposed method were compared with those from multi-pool fitting with fully sampled Z-spectrum. We have shown that it is feasible to reconstruct APT maps from undersampled, uncorrected CEST images.
Introduction
Chemical Exchange Saturation Transfer (CEST) imaging is a non-contrast imaging technique to indirectly detect exchangeable protons in the water pool by pre-saturation at different frequency offsets. CEST can image endogenous or exogenous compounds containing protons exhibiting a suitable exchange rate with bulk water. Of particular interests are the amide protons that are part of proteins and peptides that can be detected using MRI. Amide proton transfer (APT) maps have been shown to be correlated with brain gliomas1.CEST images acquired at several frequency offsets are needed to generate quantitative maps (e.g., APT, NOE, DS, MT). Total scan time can be reduced by sampling fewer frequency offsets. Previous works2 reduced the number of frequency offsets to be sampled by an overall factor of 1.5 using deep learning and asymmetry analysis. However, further reduction in scan time is still necessary for routine clinical application. In this work, we present a new approach to reduce the total scan time which uses a neural network and Fisher Information gain analysis to reduce the number of frequency offsets by a factor of 3.5 without requiring specialized image reconstruction. Furthermore, this feed-forward neural network directly reconstructs APT maps from undersampled, B0 uncorrected data, thus bypassing the WASSR B0 correction step and reducing the fitting time with traditional physics-based model fitting.
Methods
Data collection:The dataset consisted of seven healthy volunteers who underwent MRI scans on a 3T MR system (MAGNETOM Vida, Siemens Healthcare, Erlangen, Germany) with a 1Tx/16Rx-channel head/neck coil. Table 1 contains the relevant CEST imaging parameters. CEST images were acquired at 53 frequency offsets from 100 ppm upfield to 100 ppm downfield. The total imaging time was 5 min 54 s for one slice. Three slices were scaned in each volunteer. In total, 21 slices were used for training and testing the neural network.
Network inputs and labels:Z-spectrum:
Undersampling was designed by selecting 15 (of 53) frequency offsets with maximum Fisher information for a typical CEST signal. Retrospective undersampling of the Z-spectrum was performed at these 15 frequency offsets, equivalent to a 3.5x scan time acceleration. Undersampled, B0-uncorrected Z-spectra at each voxel were fed directly into the neural network as inputs. PCA based denoising3 was used to denoise the fully-sampled CEST images. WASSR correction4 was used for B0 correction. After the B0 correction, multi-pool Lorentzian fitting model was used to generate the APT maps. Those APT maps, fitted from fully-sampled data were used as ground truth labels for the supervised neural network training [Fig 1].
Network architecture:
The neural network model was constructed as a 3-layer feed-forward, fully-connected structure with ReLU activation function. L2 loss was used as the loss function. The model was trained for 500 epochs, with a learning rate of 5e-4 and the ADAM optimizer. For training, validation and testing, a 65-15-20 split was used to effectively train the neural network, and slice-wise Leave One Out cross-validation was used to prevent overfitting.
Data analysis:
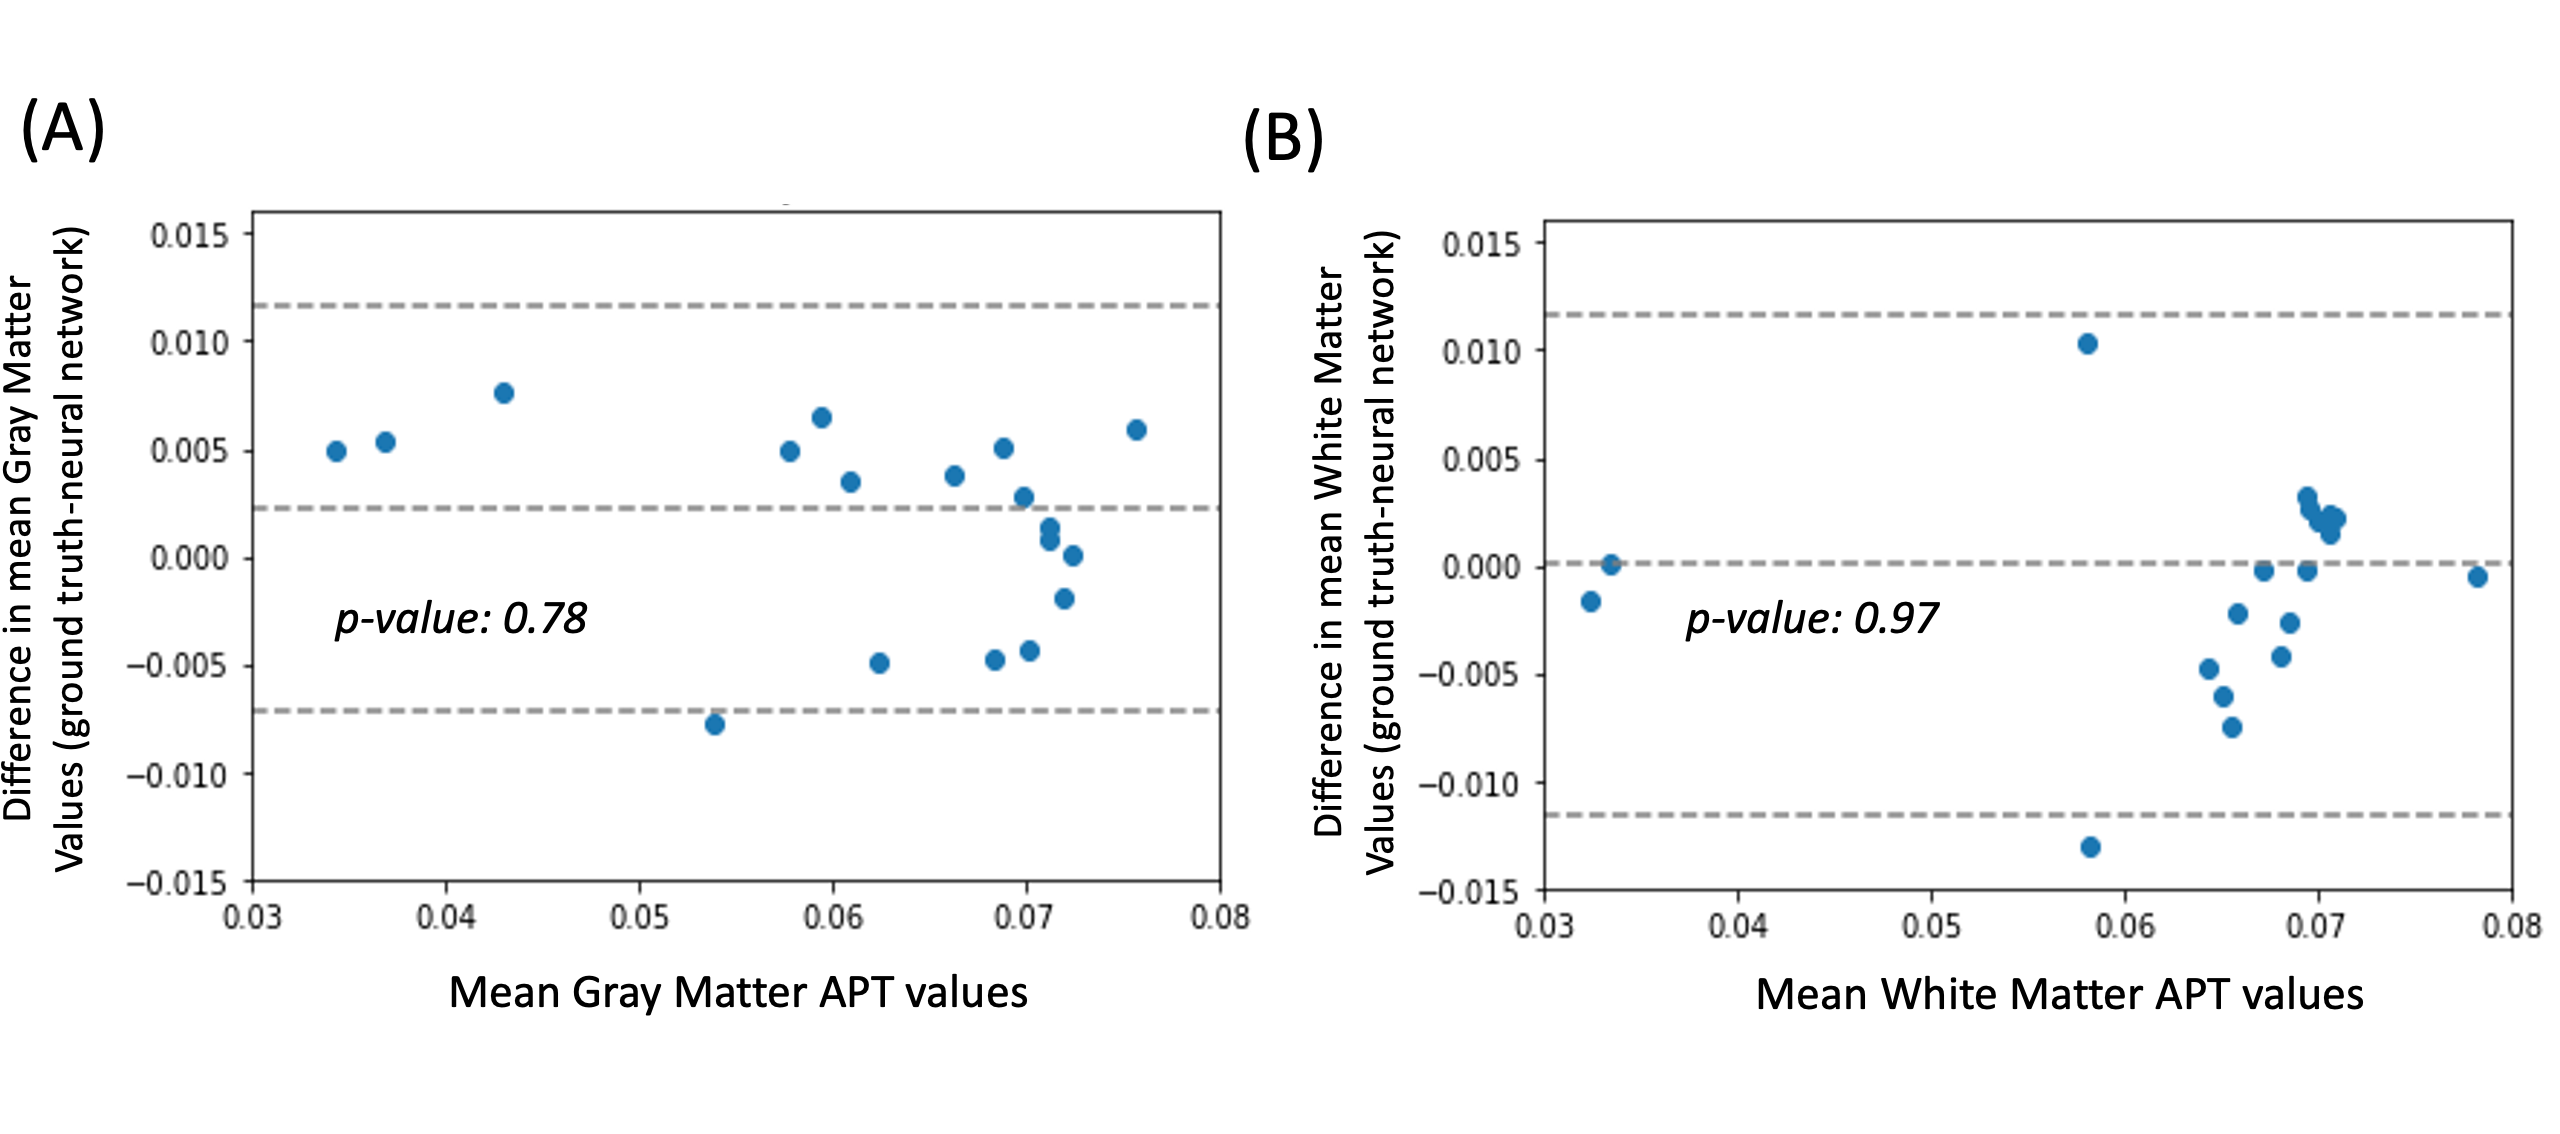
Root mean squared error (RMSE), structural similiarity index (SSIM) and peak signal-to-noise ratio (PSNR) were used as quantitative metrics to evaluate the image quality. Paired two-sided T-test was used to evaluate whether the neural network introduced any APT bias in either gray matter (GM) or white matter (WM) regions of the brain.
Results
Figure 2 shows representative APT maps from the proposed method and from multi-pool fitting. The neural network is able to generate a similar APT map (Fig. 2B) to the reference (Fig. 2A) with less noise. The APT map generated using multi-pool fitting on same undersampled Z-spectra (Fig. 2C) has no clear structure and is noisy. The neural netowrk is able to generate similar APT images, with lower mean squared error and higher PSNR than the multi-pool fitting model (Table 2).No bias is seen for APT signal in GM and WM regions as evidenced by the Bland Altman analysis shown in Figure 3. Based on two sided T-tests, there is no significant difference in the GM and WM signals (p-value: 0.78 and 0.97 respectively) between the ground truth and the neural network’s output.
Discussion and Conclusion
Multi-pool fitting with undersampled Z-spectra is ill-conditioned and hence results in APT maps with poor image quality. Whereas, the proposed neural network is able to generate high-SNR APT maps from undersampled Z-spectra. Note that the input CEST images were without B0 correction, the WASSR pre scan is not needed for pre-processing, which will significantly save the total scan time.In conclusion, the proposed network can generate APT maps using CEST images with 15 out of 53 frequency offsets. It has the potential to reduce the total scan time by a factor of 3.5. Further validations of this technique are needed for patient studies.Acknowledgements
This work was supported in part by NIH R01 EB028146, R01 AR066517, and R01 HL156818.References
[1] Wu B, Warnock G, Zaiss M, Lin C, Chen M, Zhou Z, Mu L, Nanz D, Tuura R, Delso G. An overview of CEST MRI for non-MR physicists. EJNMMI physics. 2016 Dec;3(1):1-21.
[2] Li Y, Xie D, Cember A, Nanga RP, Yang H, Kumar D, Hariharan H, Bai L, Detre JA, Reddy R, Wang Z. Accelerating GluCEST imaging using deep learning for B0 correction. Magnetic resonance in medicine. 2020 Oct;84(4):1724-33.
[3] Breitling J, Deshmane A, Goerke S, Korzowski A, Herz K, Ladd ME, Scheffler K, Bachert P, Zaiss M. Adaptive denoising for chemical exchange saturation transfer MR imaging. NMR in Biomedicine. 2019 Nov;32(11):e4133.
[4] Kim M, Gillen J, Landman BA, Zhou J, Van Zijl PC. Water saturation shift referencing (WASSR) for chemical exchange saturation transfer (CEST) experiments. Magnetic Resonance in Medicine: An Official Journal of the International Society for Magnetic Resonance in Medicine. 2009 Jun;61(6):1441-50.
Figures
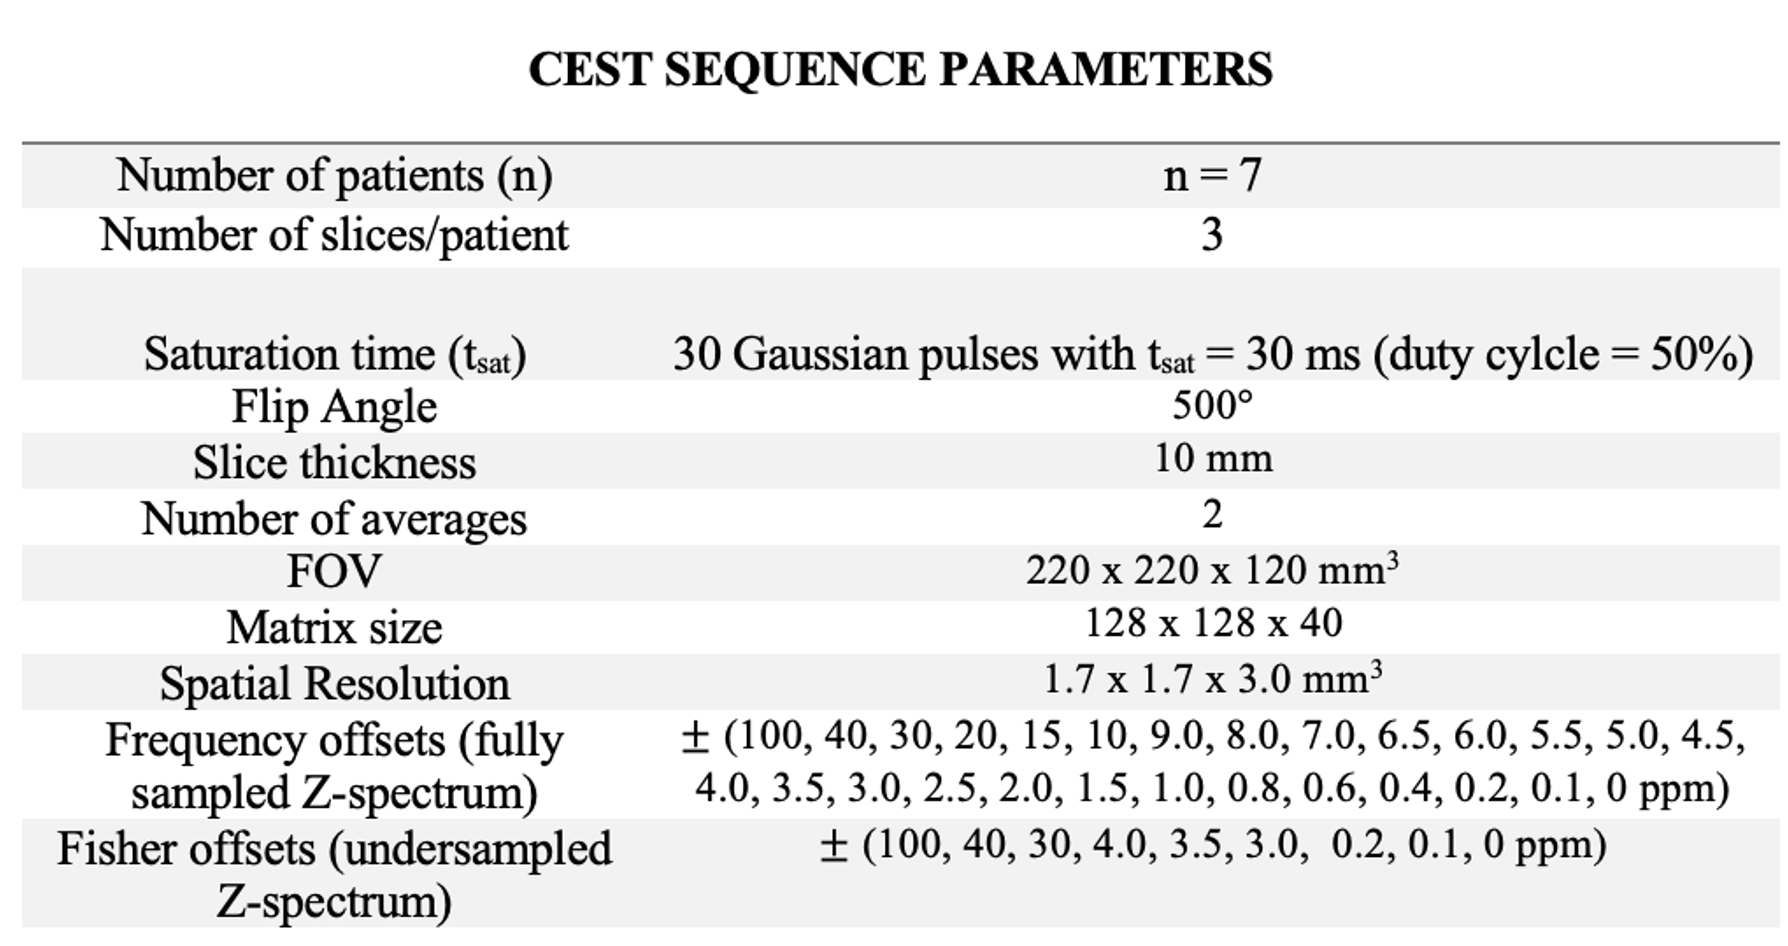
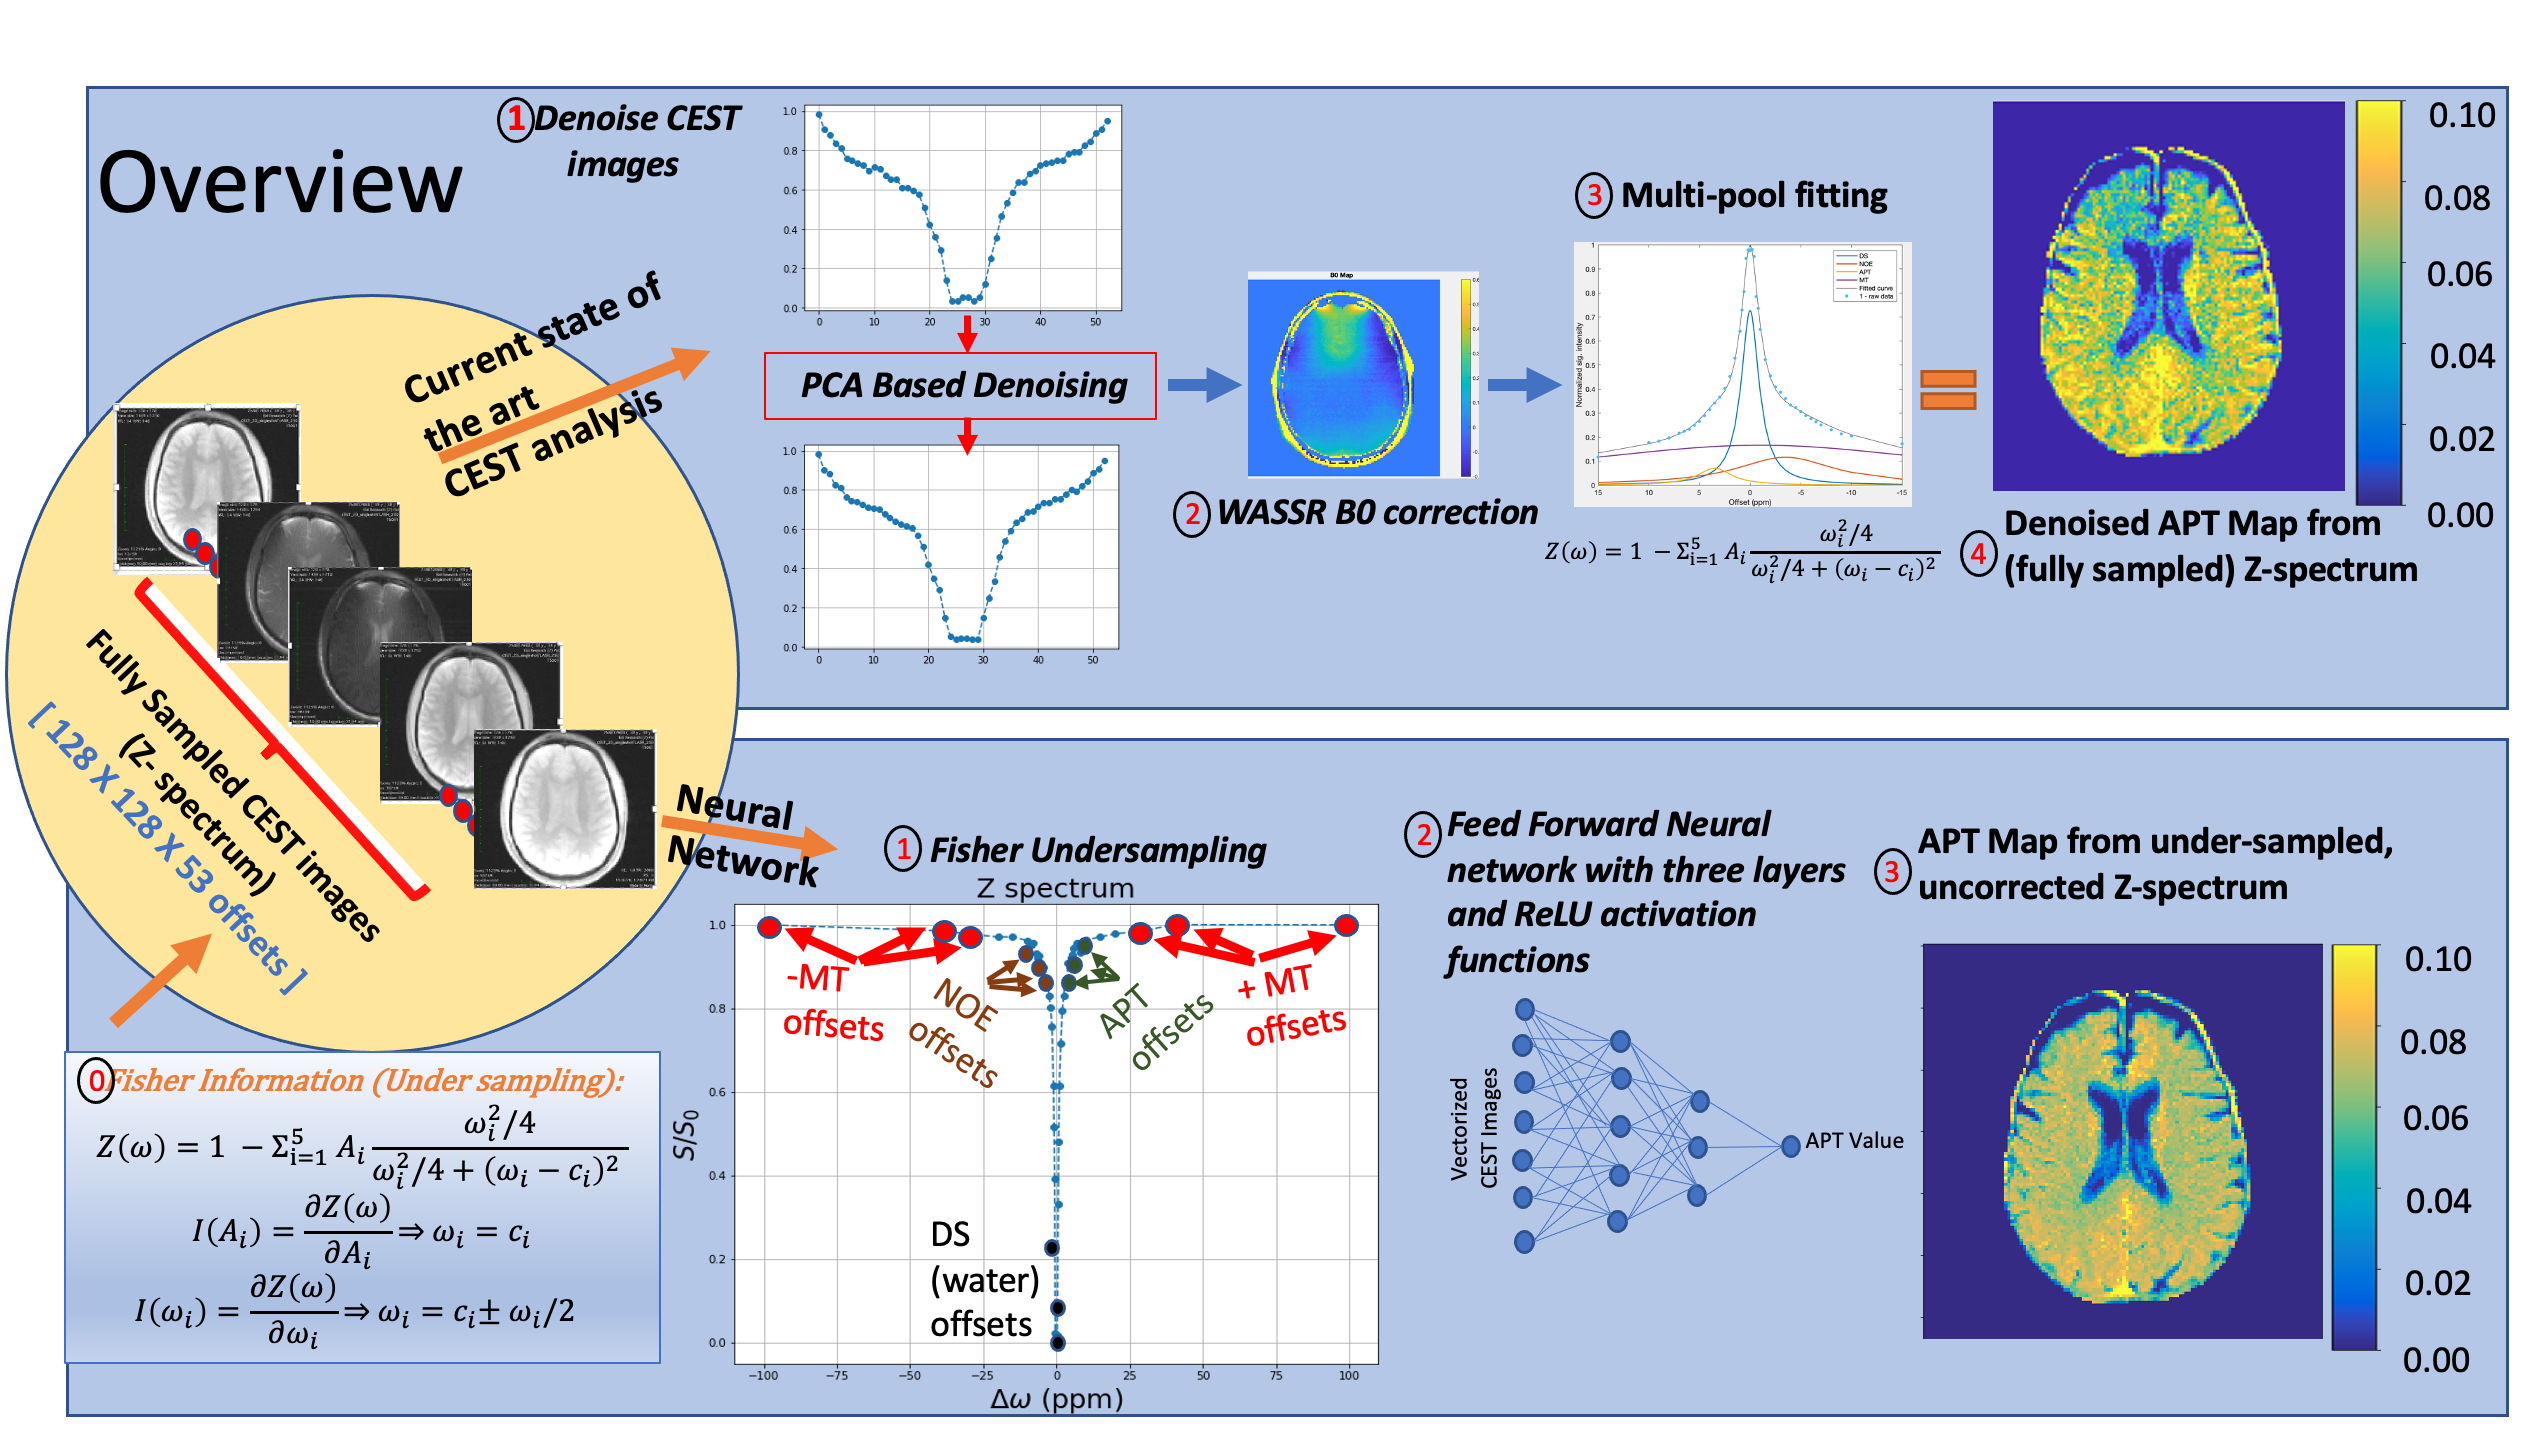
Figure 1: Study overview.
[Top panel] CEST images are (1) denoised using the PCA based denoising algorithm3 followed by WASSR correction4 to generate field corrected images. Multi-pool Lorentzian fitting model (3) is used to generate the APT maps (4).
[Bottom Panel]. Using Fisher Information gain analysis (0) Z-spectrum is undersampled to 15 offsets (1) which serve as inputs to the 3-layer feed forward neural network (2). (3) shows the result of the APT Map generated using the neural network.
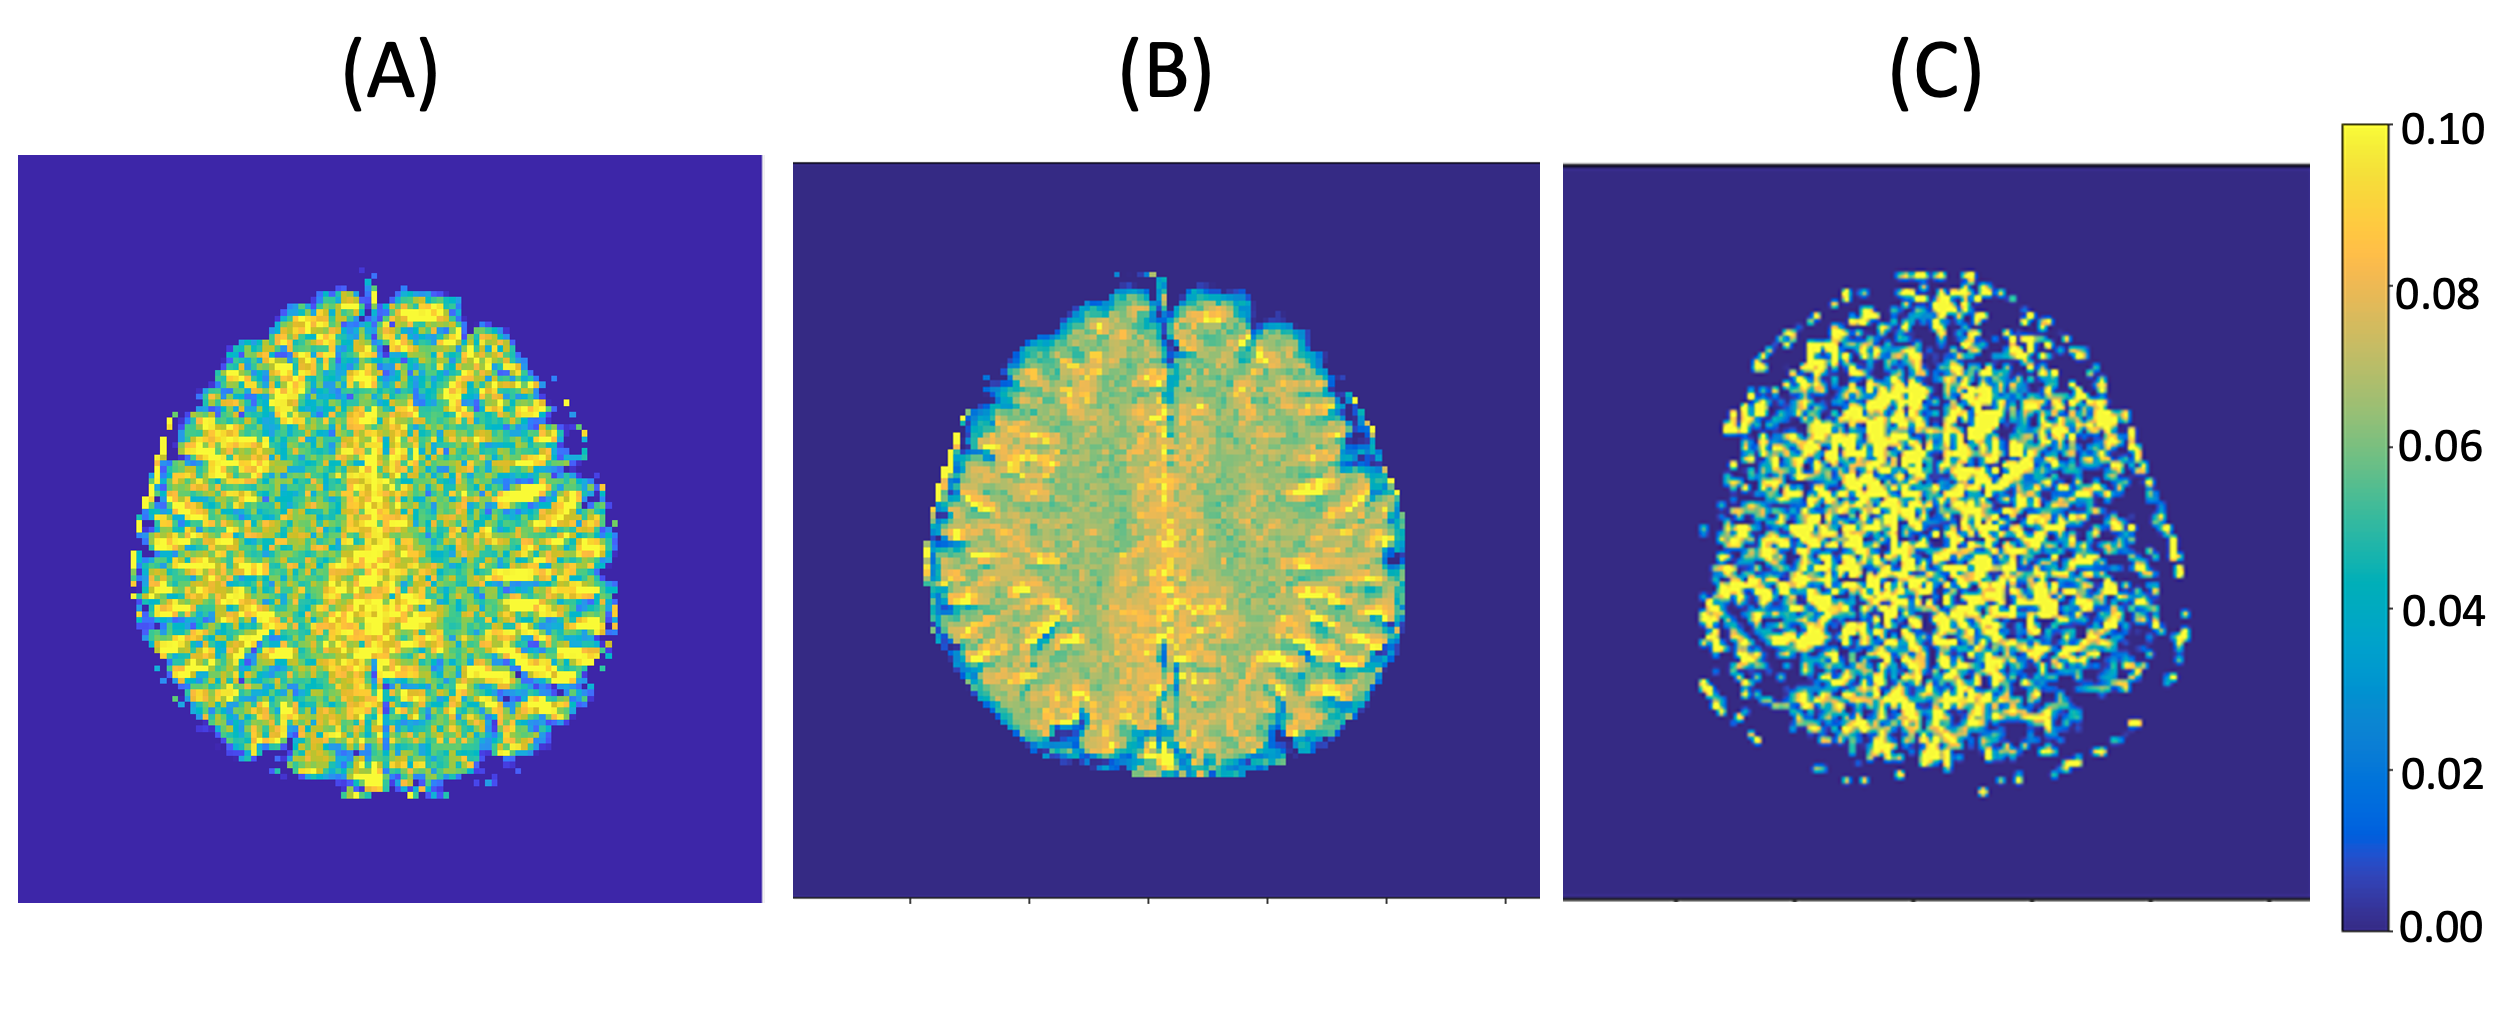
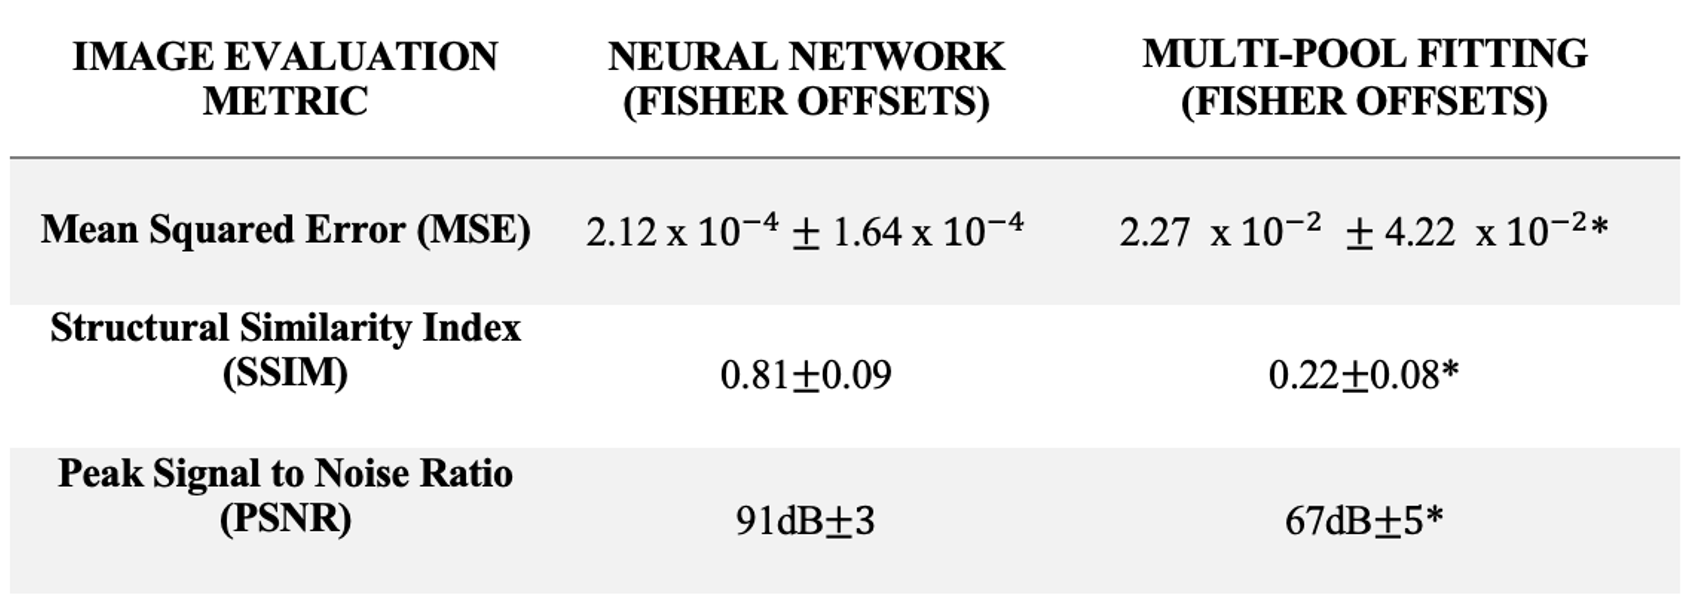
Table 2: Mean image metrics for all slices in the testing dataset. The neural network based reconstruction of the undersampled Z-spectrum (Fisher offsets) generates the APT map with lower MSE, higher SSIM and PNSR values than the multi-pool fitting at Fisher offsets.
* indicates statistical significance (p-value < 0.05)