2522
Fast and High-Resolution T2* weighted and susceptibility-based MRI using 3D-EPI with Deep Learning Reconstruction1GE Healthcare, Buc, France, 2GE Healthcare, Calgary, AB, Canada, 3GE Healthcare, Houston, TX, United States, 4GE Healthcare, Boston, MA, United States, 5GE Healthcare, Menlo Park, CA, United States, 6Karolinska University Hospital, Stockholm, Sweden, 7Karolinska Institutet, Stockholm, Sweden, 8GE Healthcare, Stockholm, Sweden
Synopsis
Fast and high-resolution T2*w and susceptibility-weighted imaging is an essential part of brain MR assessment for many neurological conditions. Very high spatial resolution can be helpful for visualization of microvascular details as well as the central vein sign in white matter Multiple Sclerosis lesions, but such scans have a long acquisition time. In this abstract, we demonstrate high-quality whole-brain T2*w and susceptibility-based MRI at 0.5 mm isotropic resolution in less than 4 minutes using a 3D-echo-planar acquisition and a deep learning reconstruction. Finally, straightforward improvements are discussed for further reduction of the scan time.
Introduction
Fast high-resolution T2*weighted (T2*w) and susceptibility-weighted (SW) scans are an essential component of brain MRI exams and are used among other things to detect microbleeds, calcification, and iron deposition1. When acquired at very high isotropic resolution, 3D T2* images can also depict important features such as the central vein sign (CVS) in multiple sclerosis (MS) which provides more specificity than white matter hyperintensity2-6.However, gradient echo based whole-brain 3D T2* imaging at very high-resolutions leads to long scan times owing to the late TE. On the contrary, 3D T2* Echo Planar Imaging (EPI)7-8 pulse sequence has a much higher sampling efficiency and has been previously employed for this application, but it has insufficient SNR at high-resolution.
Previously reconstruction embedded deep learning (DL) algorithm, AIR Recon DL, that provides a more intelligent reconstruction of MR complex data with higher SNR and ringing suppression9 has been demonstrated to improve SNR and visualization of structural details in 2D sequences across anatomies10. In this work, we extended it to the SNR starved high-resolution 3D-EPI T2*w data and evaluated the resulting image quality.
Method
A 3D multi-shot multi-echo spoiled EPI pulse sequence similar to ref 9 was developed. The reconstruction included correction for readout ramp sampling, phase correction, parallel imaging (ASSET, GE Healthcare, WI, USA), and a 3D version of a previously presented DL-based MR image reconstruction pipeline9-10 (commercially known as AIR Recon DL). This reconstruction operates on the complex imaging data to reduce noise and truncation artifact. The vessel contrast was improved using susceptibility-weighted processing (SWI) of the complex data11. Finally, receive coil inhomogeneities were corrected using a calibration scan with the body coil and the array coil (PURE, GE Healthcare, WI, USA).To demonstrate the feasibility of this fast high-resolution and high-quality T2*w imaging at 3T, two subjects were scanned on a 3T MR scanner (SIGNA Premier, GE Healthcare, WI, USA) using a 48-channel coil.
The first subject was scanned in two sessions separated by 2 months. Both times at an isotropic resolution of 0.5 mm. In the first session, subject 1 was scanned in axial and sagittal orientation with the following parameters: single-echo, TE=27ms, TR=64ms, flip angle=17 degrees, matrix 480x480x320, in-plane acceleration=2, #shots=10, etl=24, echo-spacing=1.884ms. In the second session, the axial acquisition was repeated using the same parameters, but the sagittal acquisition was made with TR=54ms, #shots=12, echo train length (ETL)=20, echo-spacing=2.176ms (other parameters were identical).
The second subject was scanned in axial orientation with a very high in-plane resolution (0.24mm) but a moderate slice thickness (2mm) as is commonly used for T2* imaging: 0.24x0.24x2mm resolution, TE=27.9ms, TR=68.268ms, flip-angle=17°, in-plane acceleration=2, matrix=1024x1024x80, #shots=64, etl=8, echo-spacing=5.332ms.
All axial acquisitions were performed with a 100mm inferior sat band to attenuate in-flow artifacts.
Results
The scan times for the acquisitions at 0.5 mm isotropic for subject 1 were between 3:51 min and 3:57 min (scan time varied with the varying acquisition parameters as described in the methods section). Representative images obtained from scan session 1 in subject 1 is shown in figure 1. Notice the SNR and overall image quality improvement brought by the DL recon (fig.1-d) compared to conventional reconstruction (fig.1-a) which is SNR-limited.Multiplanar reformats of subject 1 session 2, shown in Figure 2 demonstrate the improved sharpness and visualization of small vessels in all three planes with DL Recon (Figure 2b, bottom row) compared to the conventional reconstruction (Figure 2a, top row).
The reproducibility and robustness of the method are investigated in figure 3. A zoomed-in area of the right hemisphere is compared across the two scan sessions and for axial and sagittal scan planes. Fine vascular structures can be easily identified in all four datasets. DL recon successfully removes image noise while preserving the image details.
Finally, the last two figures investigate the acquisition with even higher in-plane resolution but thicker slice (0.24x0.24x2mm) that took 5:32 min. Figure 4 depicts a slice at the level of the ventricles and Figure 5 shows a zoomed section obtained from this scan session. The improvement in SNR and visualization of micro-vasculature and fine details in the brain parenchyma with DL Recon (fig.5-b) compared to the conventional recon (fig.5-a) is apparent in the magnitude, susceptibility-weighted, phase, and minimum intensity projection images.
Discussion and conclusion
We demonstrated fast, high-resolution, high-quality T2*w imaging at 3T. The 0.5mm isotropic data were acquired in less than 4 minutes, and the 0.24x0.24x2mm data in 5:32 minutes.The sampling efficiency of 3D-EPI can be combined effectively with the DL reconstruction for fast high-resolution high-quality T2*w imaging at 3T. Normally, at the given resolution, T2*w 3D-EPI is SNR limited but AIR Recon DL helped overcome that limitation. In this work, we used a conservative parallel imaging acceleration factor of 2x in-plane.
The 48-channel coil may enable higher acceleration factors, or slice acceleration, without excessive g-factor penalties, for example in the slice direction.
Further optimizations of contrasts and resolution and evaluation in patient cohorts would be needed to tune the acquisition and reconstruction parameters for targeted applications such as small vessel disease, stroke, and MS.
Acknowledgements
No acknowledgement found.References
1. Haller, S., Vernooij, M. W., Kuijer, J., Larsson, E. M., Jäger, H. R., & Barkhof, F. (2018). Cerebral Microbleeds: Imaging and Clinical Significance. Radiology, 287(1), 11–28. https://doi.org/10.1148/radiol.2018170803
2. Adams C. W. (1975). The onset and progression of the lesion in multiple sclerosis. Journal of the neurological sciences, 25(2), 165–182. https://doi.org/10.1016/0022-510x(75)90138-0
3. Ontaneda, D., Sati, P., Raza, P., Kilbane, M., Gombos, E., Alvarez, E., Azevedo, C., Calabresi, P., Cohen, J. A., Freeman, L., Henry, R. G., Longbrake, E. E., Mitra, N., Illenberger, N., Schindler, M., Moreno-Dominguez, D., Ramos, M., Mowry, E., Oh, J., Rodrigues, P., … North American Imaging in MS Cooperative (2021). Central vein sign: A diagnostic biomarker in multiple sclerosis (CAVS-MS) study protocol for a prospective multicenter trial. NeuroImage. Clinical, 32, 102834. Advance online publication. https://doi.org/10.1016/j.nicl.2021.102834
4. Castellaro, M., Tamanti, A., Pisani, A. I., Pizzini, F. B., Crescenzo, F., & Calabrese, M. (2020). The Use of the Central Vein Sign in the Diagnosis of Multiple Sclerosis: A Systematic Review and Meta-analysis. Diagnostics (Basel, Switzerland), 10(12), 1025. https://doi.org/10.3390/diagnostics10121025
5. Tallantyre, E. C., Morgan, P. S., Dixon, J. E., Al-Radaideh, A., Brookes, M. J., Evangelou, N., & Morris, P. G. (2009). A comparison of 3T and 7T in the detection of small parenchymal veins within MS lesions. Investigative radiology, 44(9), 491–494. https://doi.org/10.1097/RLI.0b013e3181b4c144
6. Gaitán, M. I., Yañez, P., Paday Formenti, M. E., Calandri, I., Figueiredo, E., Sati, P., & Correale, J. (2020). SWAN-Venule: An Optimized MRI Technique to Detect the Central Vein Sign in MS Plaques. AJNR. American journal of neuroradiology, 41(3), 456–460. https://doi.org/10.3174/ajnr.A6437
7. Norbeck, O., Sprenger, T., Avventi, E., Rydén, H., Kits, A., Berglund, J., & Skare, S. (2020). Optimizing 3D EPI for rapid T1 -weighted imaging. Magnetic resonance in medicine, 84(3), 1441–1455. https://doi.org/10.1002/mrm.28222
8. Sati, P., Thomasson, D. M., Li, N., Pham, D. L., Biassou, N. M., Reich, D. S., & Butman, J. A. (2014). Rapid, high-resolution, whole-brain, susceptibility-based MRI of multiple sclerosis. Multiple sclerosis (Houndmills, Basingstoke, England), 20(11), 1464–1470. https://doi.org/10.1177/135245851452586
9. Lebel, R. M. (2020). Performance characterization of a novel deep learning-based MR image reconstruction pipeline. https://arxiv.org/abs/2008.06559
10. Kim, M., Kim, H. S., Kim, H. J., Park, J. E., Park, S. Y., Kim, Y. H., Kim, S. J., Lee, J., & Lebel, M. R. (2021). Thin-Slice Pituitary MRI with Deep Learning-based Reconstruction: Diagnostic Performance in a Postoperative Setting. Radiology, 298(1), 114–122. https://doi.org/10.1148/radiol.2020200723
11. Haacke, E. M., Xu, Y., Cheng, Y. C., & Reichenbach, J. R. (2004). Susceptibility weighted imaging (SWI). Magnetic resonance in medicine, 52(3), 612–618. https://doi.org/10.1002/mrm.20198
Figures
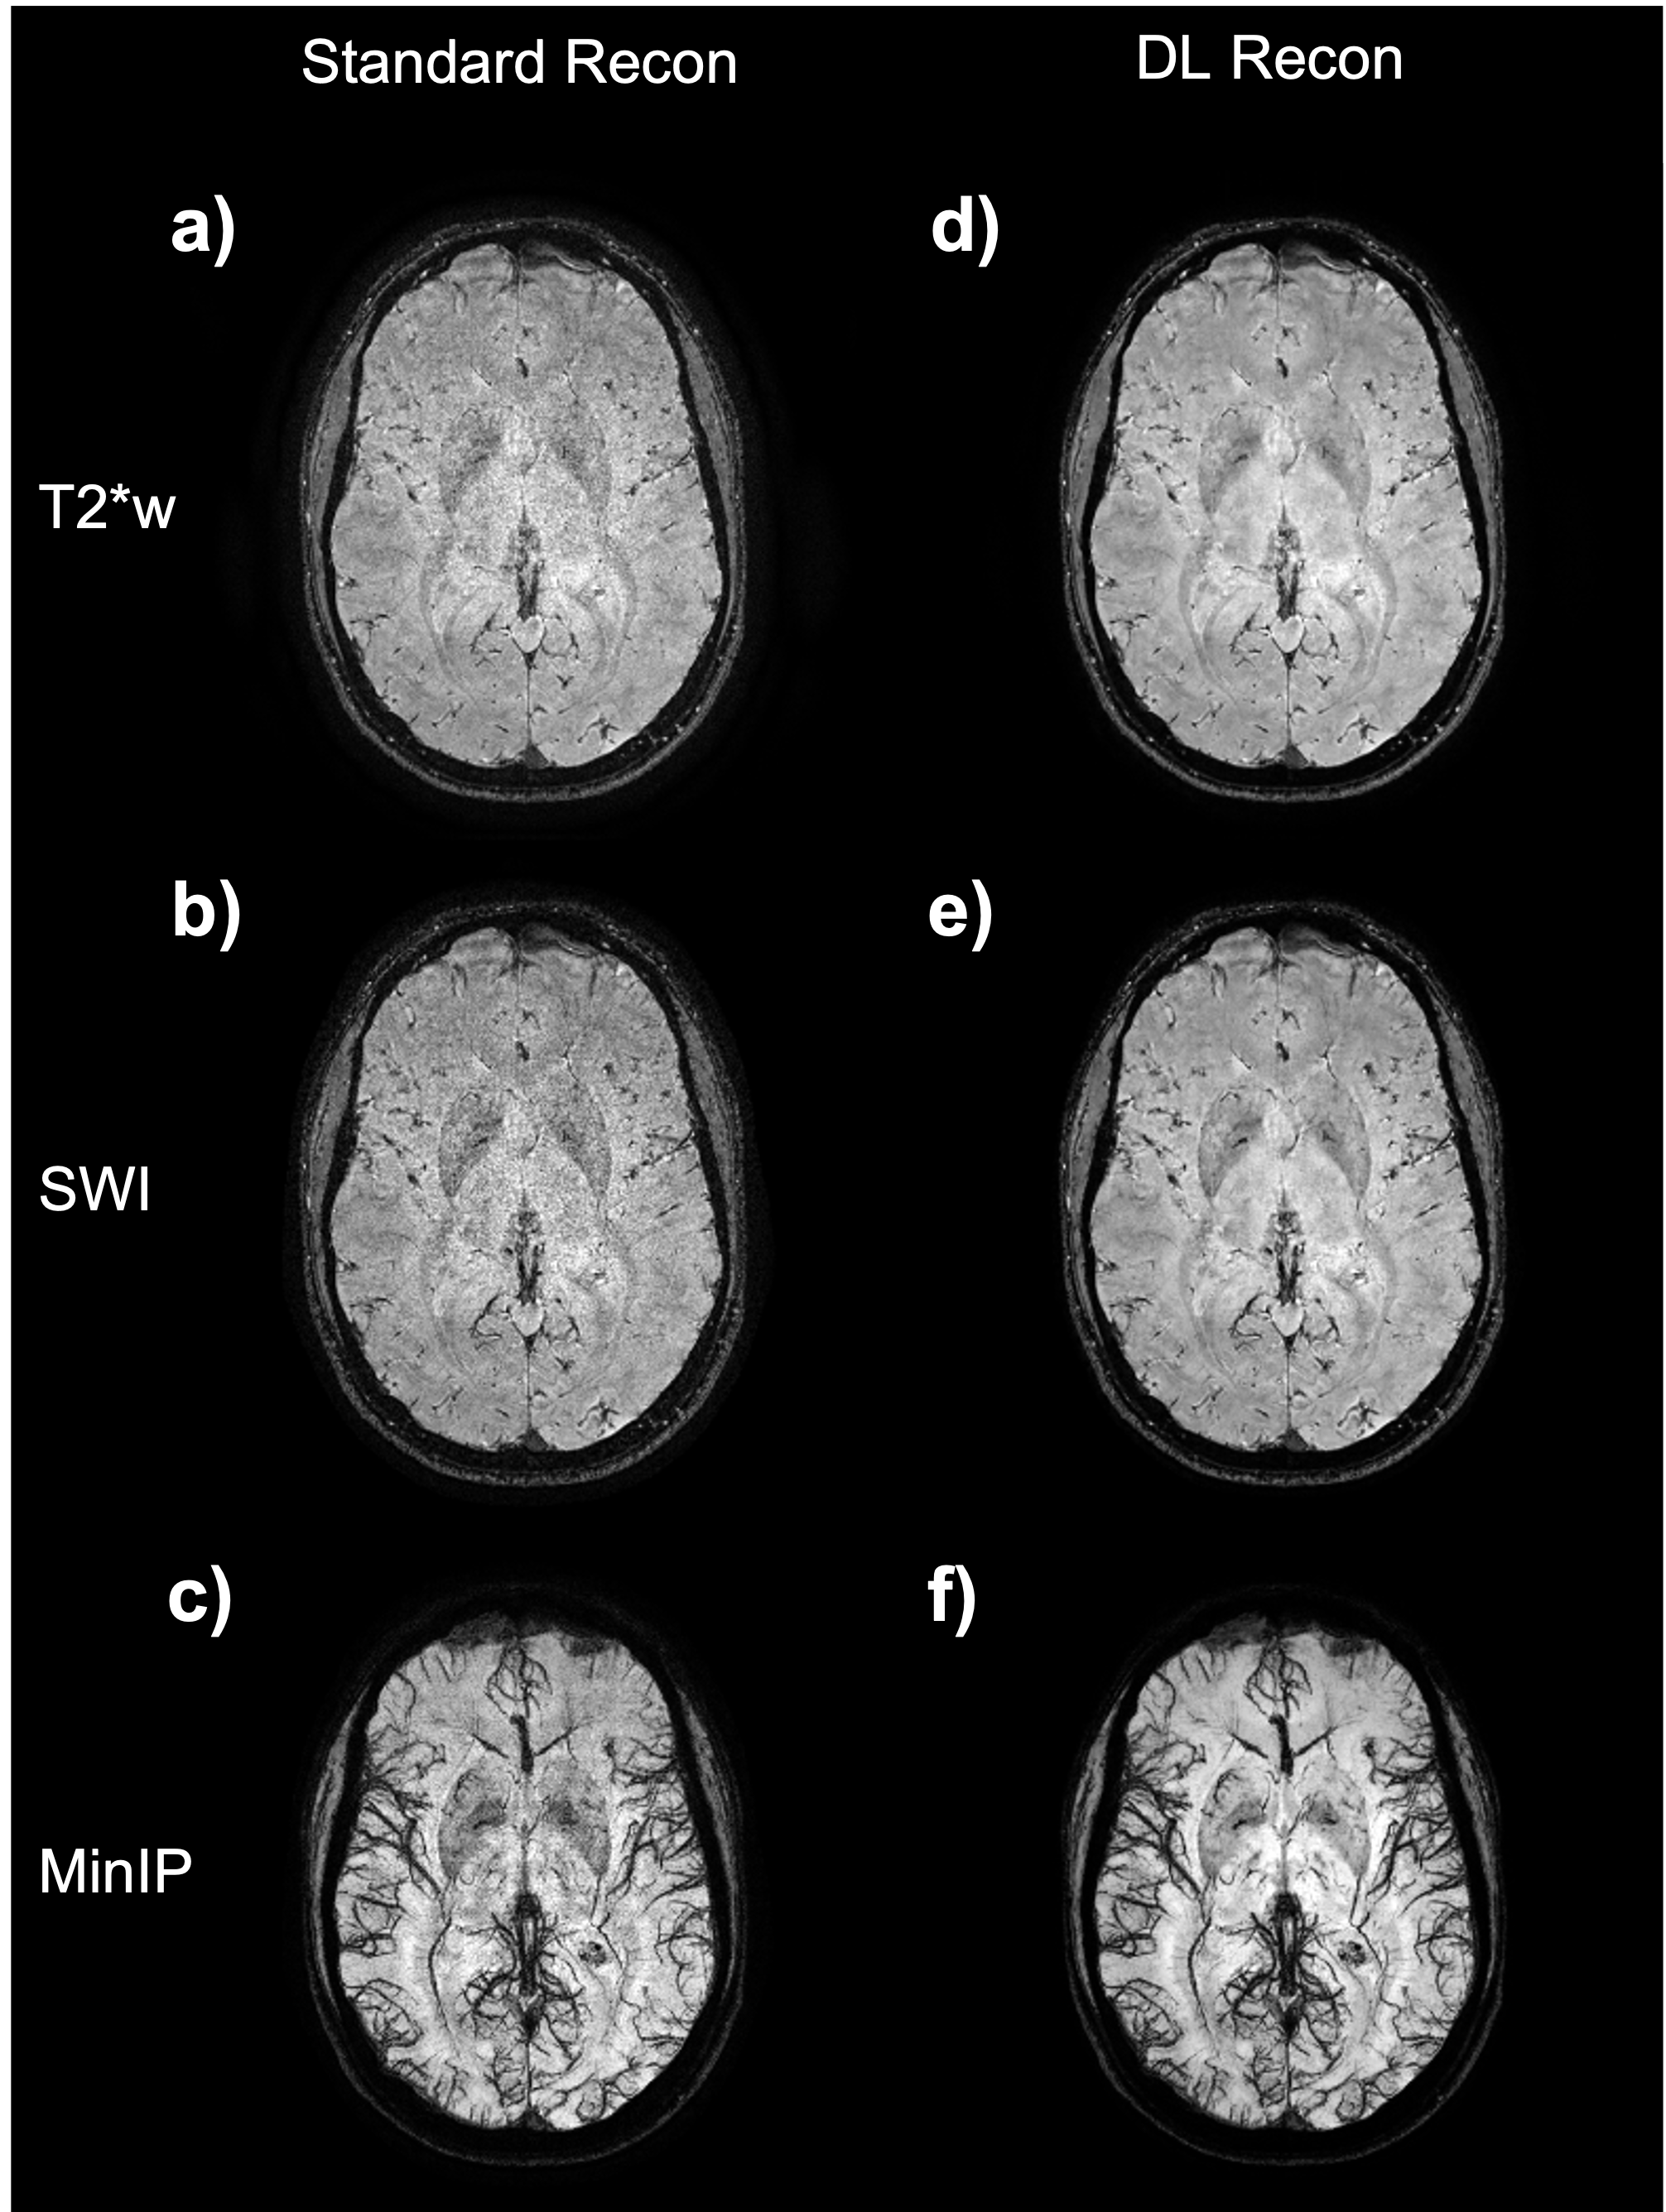
Figure 1: Axial image example from the subject 1 (session 1, axial acquisition) at 0.5 mm isotropic. Image a) is the magnitude image; b) SWI processed images and c) a 12mm minimum intensity projection (MinIP) centered on the slice shown on a) and b). The images a), b), and c) were made with the standard reconstruction pipeline. Images d), e) and f) are the corresponding magnitude, susceptibility contrast weighted, and a 12mm MinIP results, respectively, from images obtained with the DL reconstruction pipeline.
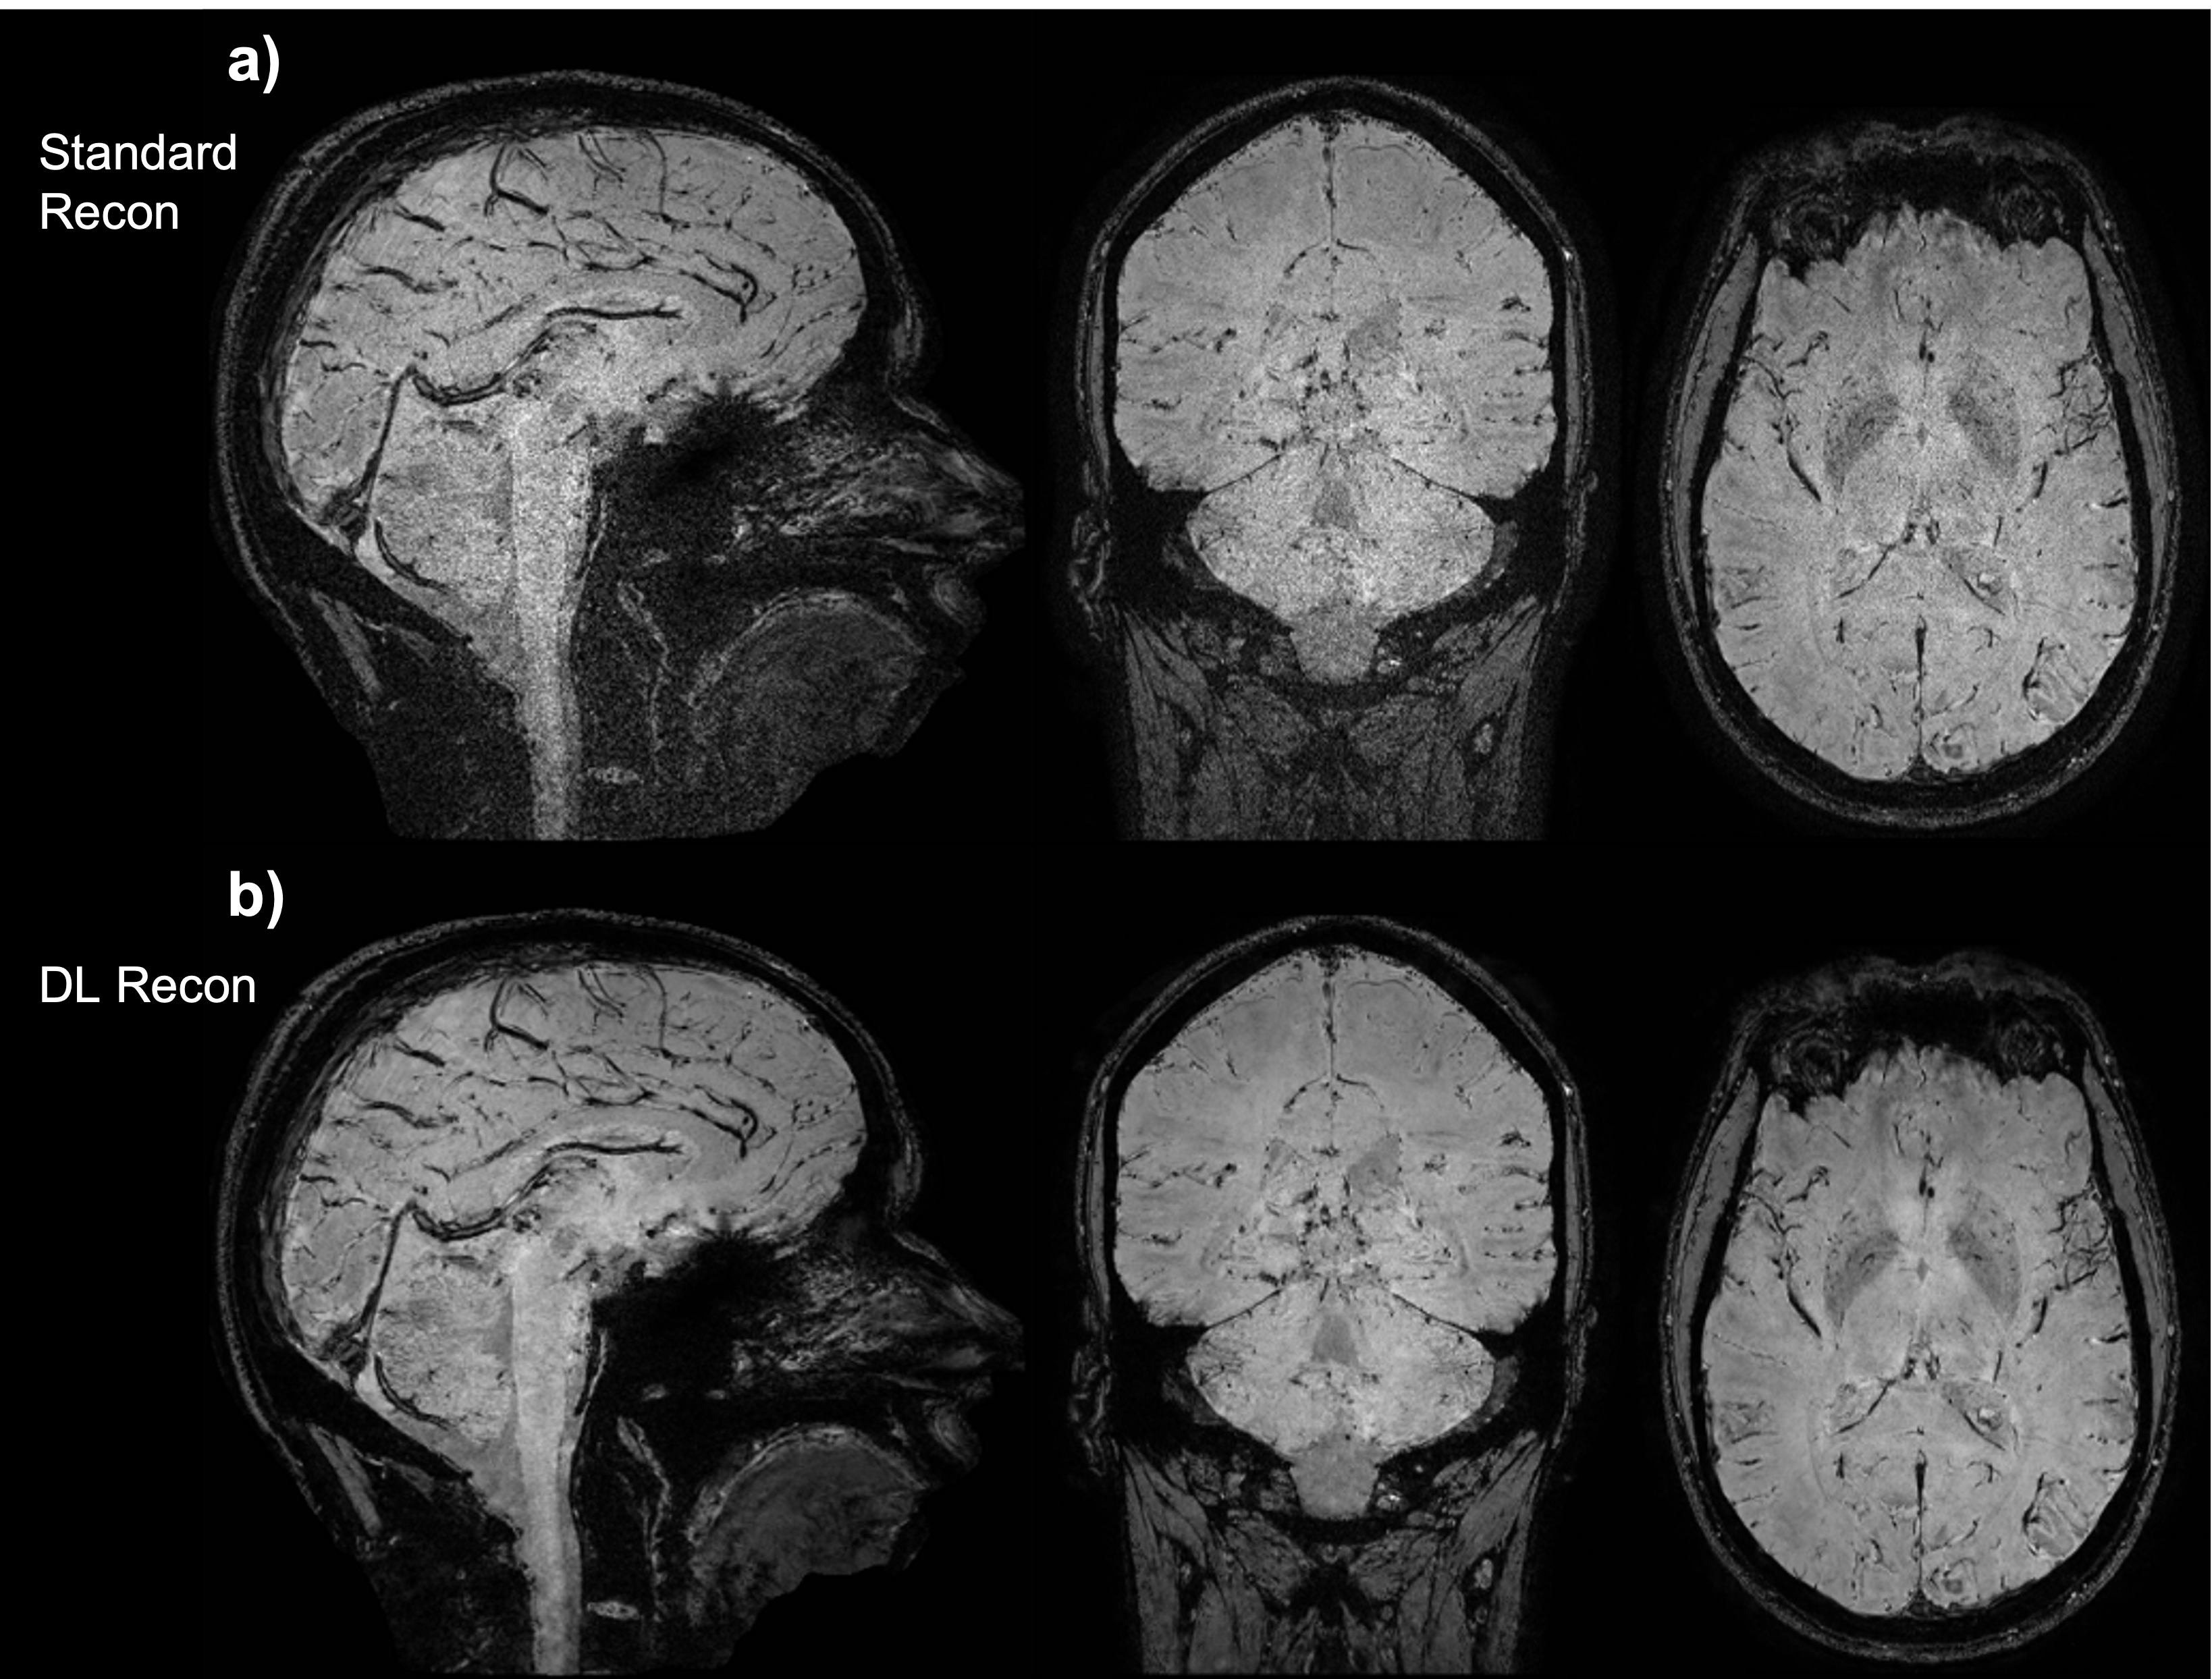
Figure 2: Three-plane view of the SWI processed data of subject 1 (session 2, sagittal acquisition), (a) standard reconstruction, and (b) DL reconstruction. This is intended to show the overall image quality of the whole volume.
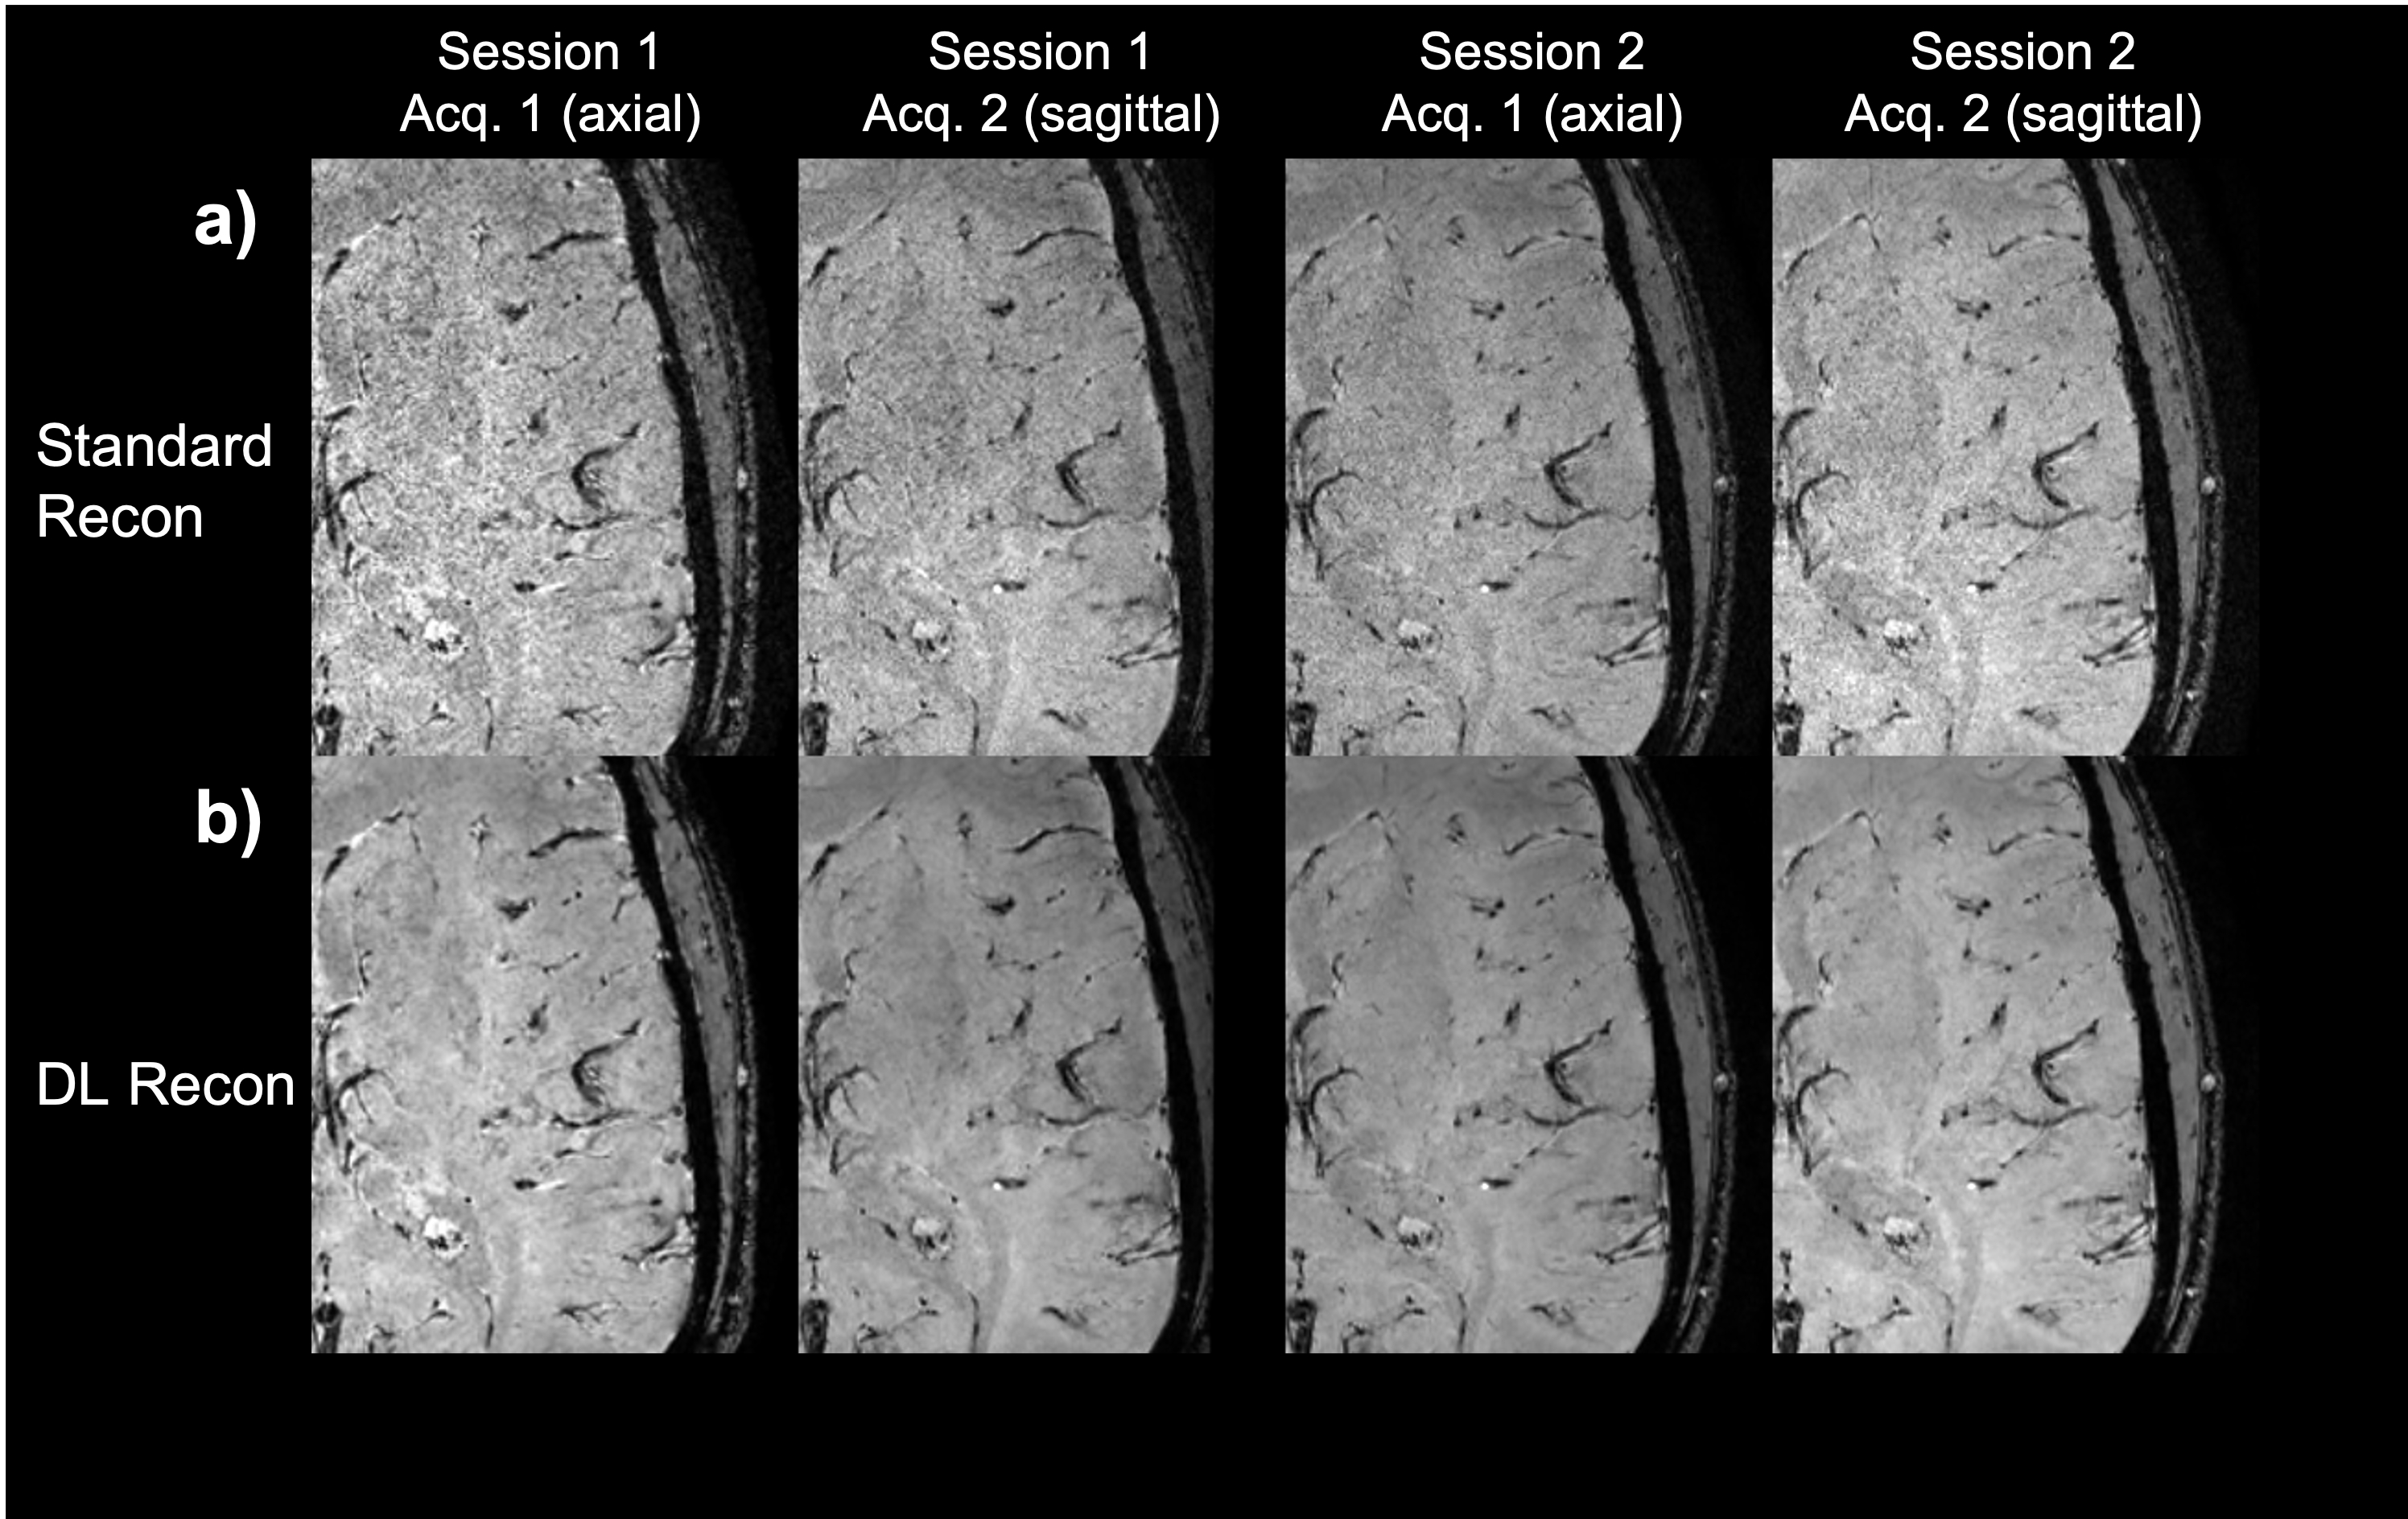
Figure 3: Zoom on a specific slice of subject 1 data on all sessions and all acquisition (identical data acquired in axial or sagittal orientation). Row a) is the standard reconstruction pipeline and b) the corresponding deep learning reconstruction pipeline. The data from the two sessions were registered, so minor differences are expected due to registration error.
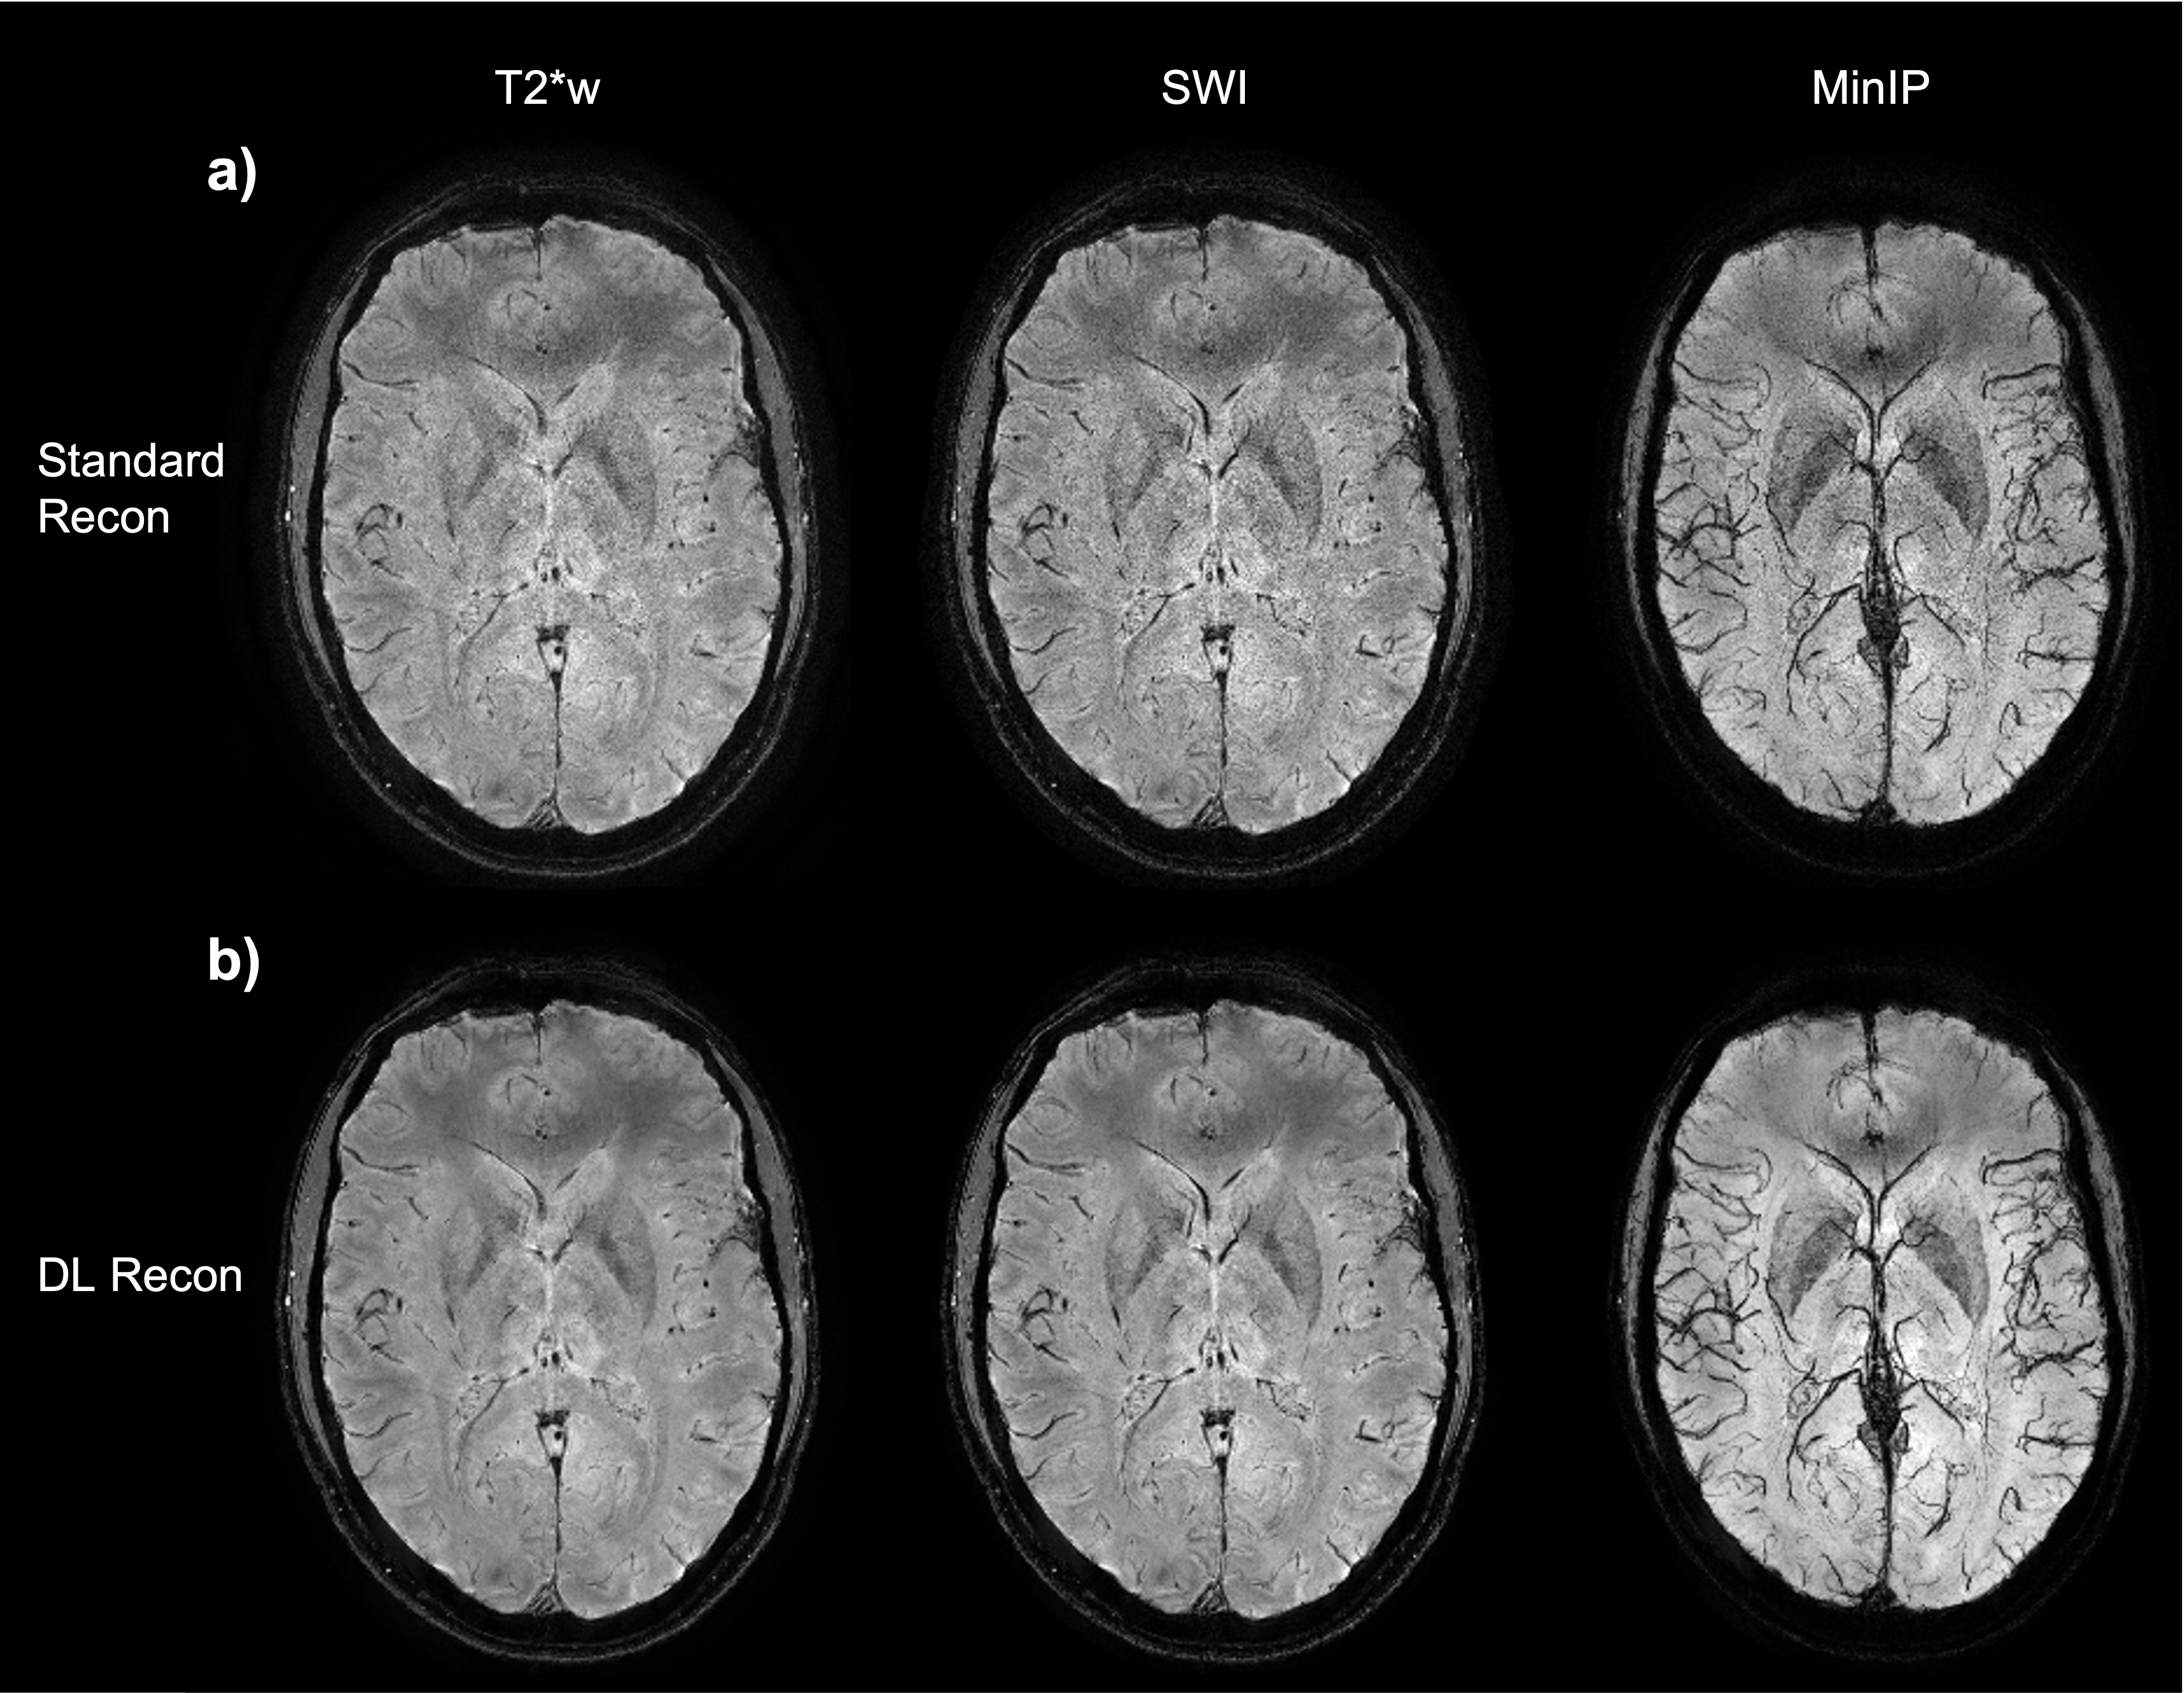
Figure 4: Axial slice from subject 2 at 0.24x0.24x2 mm, a) standard reconstruction (T2*w, SWI, and 12mm MinIP images) b) DL reconstruction with corresponding images.
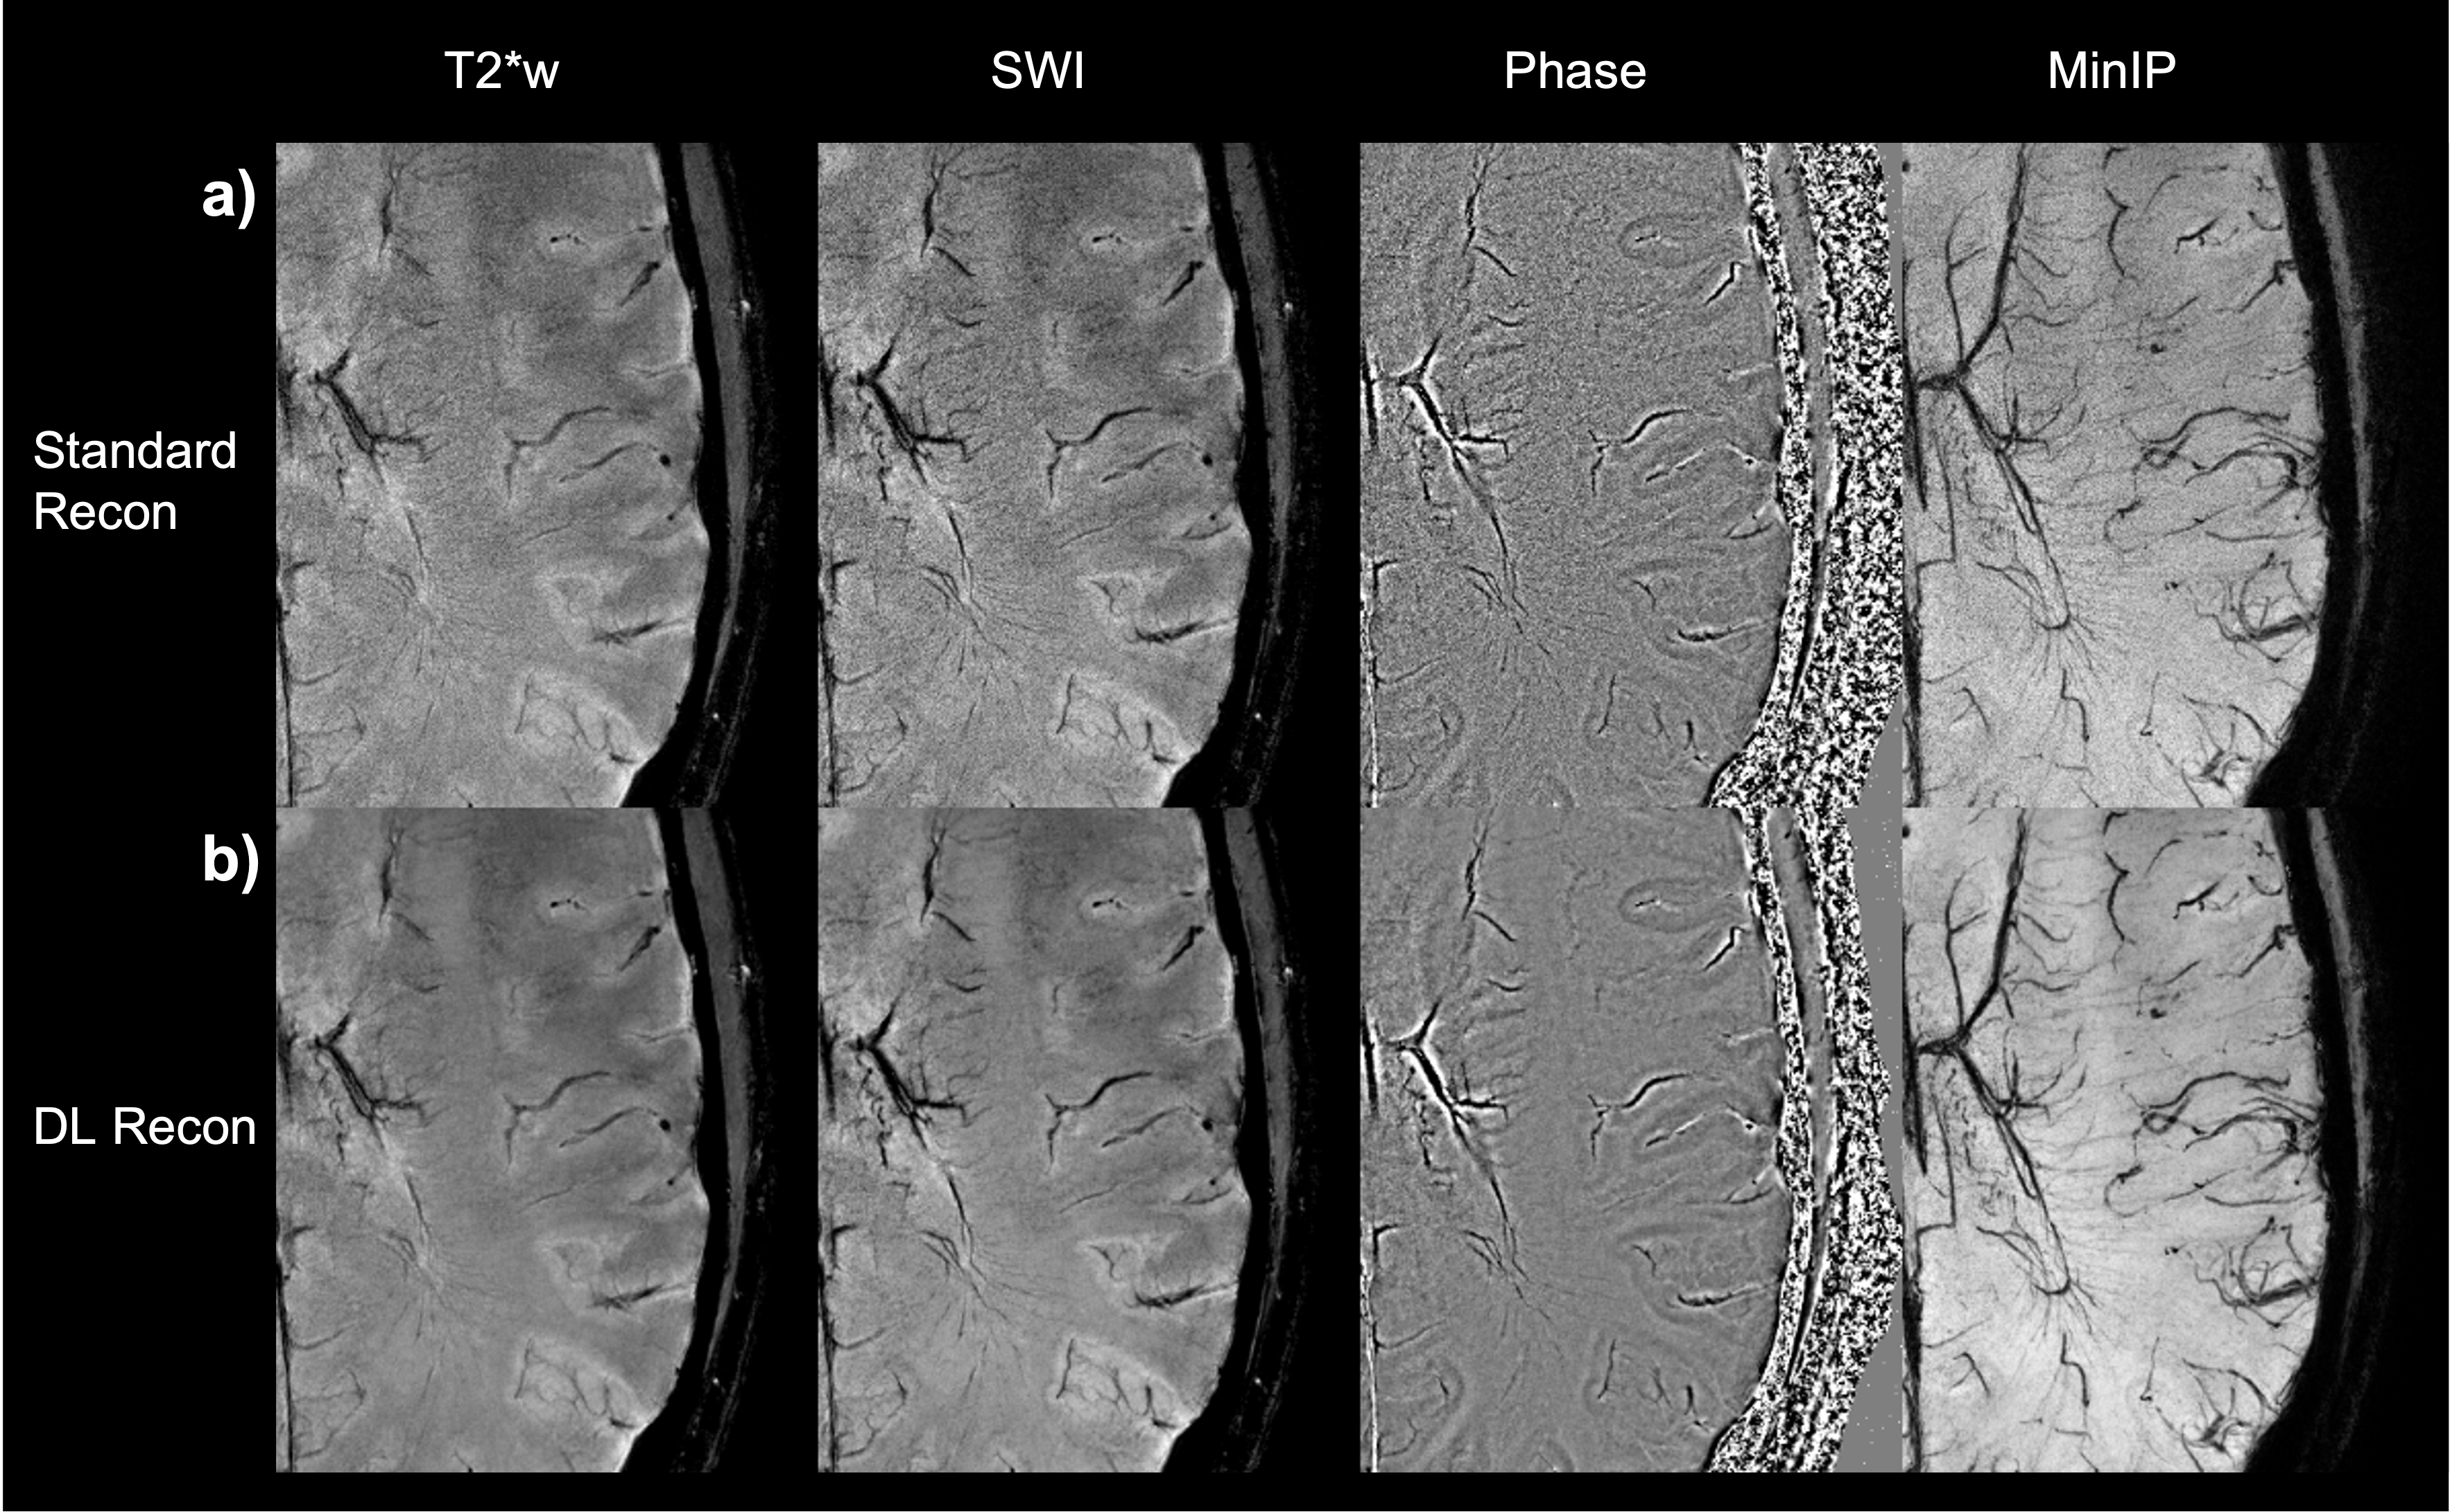
Figure 5: Zoom-in on the axial image from subject 2 at 0.24x0.24x2 mm. The standard reconstruction images are displayed on row a) the magnitude T2*w image; the SW images; coil combined phase images weighted by magnitude squared and a 12mm minimum intensity projection of the SW centered at the same location. The corresponding images reconstructed with DL reconstruction are displayed in row b). Notice that extremely fine vessels are visible.