2518
Application of Deep Learning techniques to Magnetic Resonance Fingerprinting1Department of Mathematics, University of Pavia, Pavia, Italy, 2INFN, Istituto Nazionale di Fisica Nucleare - Pavia Unit, Pavia, Italy, 3Department of Neuroradiology, Advanced Imaging and Radiomics, IRCCS Mondino Foundation, Pavia, Italy, 4Department of Physics, University of Pavia, Pavia, Italy, 5Department of Neuroradiology, IRCCS Mondino Foundation, Pavia, Italy, 6Department of Brain and Behavioural Sciences, University of Pavia, Pavia, Italy, 7Department of Social and Political Science, University of Pavia, Pavia, Italy, 8Department of Physics, University of Milano, Milano, Italy, 9INFN, Istituto Nazionale di Fisica Nucleare - Milano Unit, Milano, Italy, 10Centro Grandi Strumenti, University of Pavia, Pavia, Italy
Synopsis
We developed a Neural Network (NN) for the reconstruction of T1 and T2 parametric maps obtained with the Magnetic Resonance Fingerprinting (MRF) technique. The training phase was realized on experimental inputs, eliminating the use of simulated datasets and theoretical models. The set of optimal hyperparameters of the NN and the supervised training algorithm were established through an optimization procedure. The model achieved similar performances to the traditional reconstruction method, but the number of MRF images required was lower with respect to the dictionary-based method. If translated to the clinic, our results envisage a significant time shortening of MRI investigation.
Introduction
Magnetic Resonance Fingerprinting (MRF) is a technique for performing simultaneous measurements of multiple tissue properties through a single and time-efficient acquisition schedule.1 While the MRF data acquisition protocol is fast when compared to standard mapping techniques such as Inversion-Recovery (IR) and Spin-Echo (SE), the traditional post-processing procedure is relatively slow and requires significant storage capacity.2 The use of Deep Learning (DL) methods is an interesting strategy to overcome these limitations. Very recently published studies verified the feasibility of this approach, training a neural network (NN) on a simulated dataset and applying the results to experimental data.3,4Methods
The dataset used in this work consists of 5 slices of an ex-vivo brain rat phantom, each composed of 128x128 pixels. We tested the two acquisition schedules proposed by Gao5 and Zhao6, performed on the 7 Tesla PharmaScan Scanner (Bruker, Billerica, USA). Reference T1 and T2 maps were acquired through standard IR-SE and SE sequences by varying respectively the inversion time and the echo time. As regards the traditional dictionary-based reconstruction method, the two dictionaries (Gao and Zhao) were generated exploiting the Extended-Phase-Graph formalism7 to simulate the fingerprints for 26710 combinations of T1 (range: 100-2500ms) and T2 (range: 1-200ms). Using the Tensorflow library8, we defined two different architectures of the DL model: a multilayer perceptron (MLP) and a recurrent neural network (RNN). The MLP is composed of a sequence of fully connected layers. The input layer consists of a number of nodes equal to the MRF sequence length, while the output layer consists of 2 nodes for the prediction of T1 and T2 values. The RNN is composed of a long-short term memory (LSTM) block followed by a fully connected layer with 2 nodes for the output predictions. Since the LSTM block works better with short input sequences9, we reshaped the one-dimensional MRF sequence into multiple parallel time series, each 20 time points long. Both the models were trained on 4 slices of the phantom, using the Mean Squared Error (MSE) as loss function. The input data were randomly partitioned into separate subsets (80/20%) for training and validation phases. The slice excluded from the training process was used as an independent test set.In order to find the best configuration of the model for the MRF problem and for the available data, we performed the hyperparameter optimization through the Hyperopt library10. The hyperparameters that were tuned include the architecture of the model (MLP/RNN), some Neural Network parameters and some parameters of the supervised learning algorithm.
Results
We performed 1000 iterations of the optimization algorithm and selected the configuration which minimizes the MSE. In Figure1 the results of the hyperparameters tuning process for the Zhao dataset are represented. We trained the best configuration of the model on both datasets separately. The reconstructed and true T1 and T2 maps of the phantom for the Zhao dataset are shown in the first and second rows of Figure2 respectively. We computed the error map associated with each parameter as the percentage relative error (Figure3) and we summarized the distributions of the error maps in the boxplots of Figure4. Concerning the DL reconstruction method, the mean percentage relative error for the Zhao dataset is equal to 8% ± 17% for T1 (9% ± 13% for the Gao dataset) and 16% ± 30% for T2 (30% ± 38% for the Gao dataset). For the dictionary-based method, the mean value of the error map for the Zhao dataset is equal to 21% ± 16% for T1 (23% ± 13% for the Gao dataset) and 18% ± 29% for T2 (22% ± 29% for the Gao dataset).We evaluated the reconstruction performances of the DL algorithm and of the dictionary-based one with different acquisition sequence lengths of both datasets, Figure5. For the Gao dataset a good agreement between the DL reconstructed and true maps was obtained for a sequence length of at least 60 time-points for T1 (100 for the Zhao dataset) and at least 100 time-points for T2 (100 for the Zhao dataset), compared to the 300 time-points5 necessary for the dictionary-based reconstruction (400 time-points6 for the Zhao dataset).
Discussion
We proposed a DL framework for the reconstruction of T1 and T2 maps acquired with two MRF sequences. We extended current DL-based methods for the analysis of MRF data in two main directions: we performed a supervised training procedure on experimental data excluding the use of MRI signal simulators and we presented an automatic procedure to optimize the structure of the NN and the training process. We compared the DL algorithm with the traditional dictionary-based one. Both the approaches achieved a similar agreement between estimated and true maps. Finally, we showed that the DL method reaches good performances even with shorter sequences than the traditional method. If translated to the clinic, our results envisage a significant time shortening of MRI investigation.Conclusion
We proposed a DL-based method and an automatic hyperparameters optimization strategy for the reconstruction of parametric maps acquired with the MRF methodology. While these results are encouraging, they were obtained on a small dataset. Therefore, further work could validate this framework on a different and possibly larger dataset.Acknowledgements
No acknowledgement found.References
- Ma et al. "Magnetic resonance fingerprinting." Nature 495.7440 (2013): 187-192.
- Bipin Mehta et al. "Magnetic resonance fingerprinting: a technical review." Magnetic resonance in medicine 81.1 (2019): 25-46.
- Cohen, Ouri, Bo Zhu, and Matthew S. Rosen. "MR fingerprinting deep reconstruction network (DRONE)." Magnetic resonance in medicine 80.3 (2018): 885-894.
- Fang, Zhenghan, et al. "Deep learning for fast and spatially constrained tissue quantification from highly accelerated data in magnetic resonance fingerprinting." IEEE transactions on medical imaging 38.10 (2019): 2364-2374.
- Gao et al. "Preclinical MR fingerprinting (MRF) at 7T: effective quantitative imaging for rodent disease models." NMR in Biomedicine 28.3 (2015): 384-394.
- Zhao et al. "Optimal experiment design for magnetic resonance fingerprinting: Cramer-Rao bound meets spin dynamics." IEEE transactions on medical imaging 38.3 (2018): 844-861.
- Weigel. "Extended phase graphs: dephasing, RF pulses, and echoes‐pure and simple." Journal of Magnetic Resonance Imaging 41.2 (2015): 266-295.
- Abadi, Martín, et al. "Tensorflow: A system for large-scale machine learning." 12th {USENIX} symposium on operating systems design and implementation ({OSDI} 16). 2016.
- Hoppe, Elisabeth, et al. "Magnetic Resonance Fingerprinting Reconstruction Using Recurrent Neural Networks." GMDS. 2019.
- Bergstra, James, Dan Yamins, and David D. Cox. "Hyperopt: A python library for optimizing the hyperparameters of machine learning algorithms." Proceedings of the 12th Python in science conference. Vol. 13. 2013.
Figures
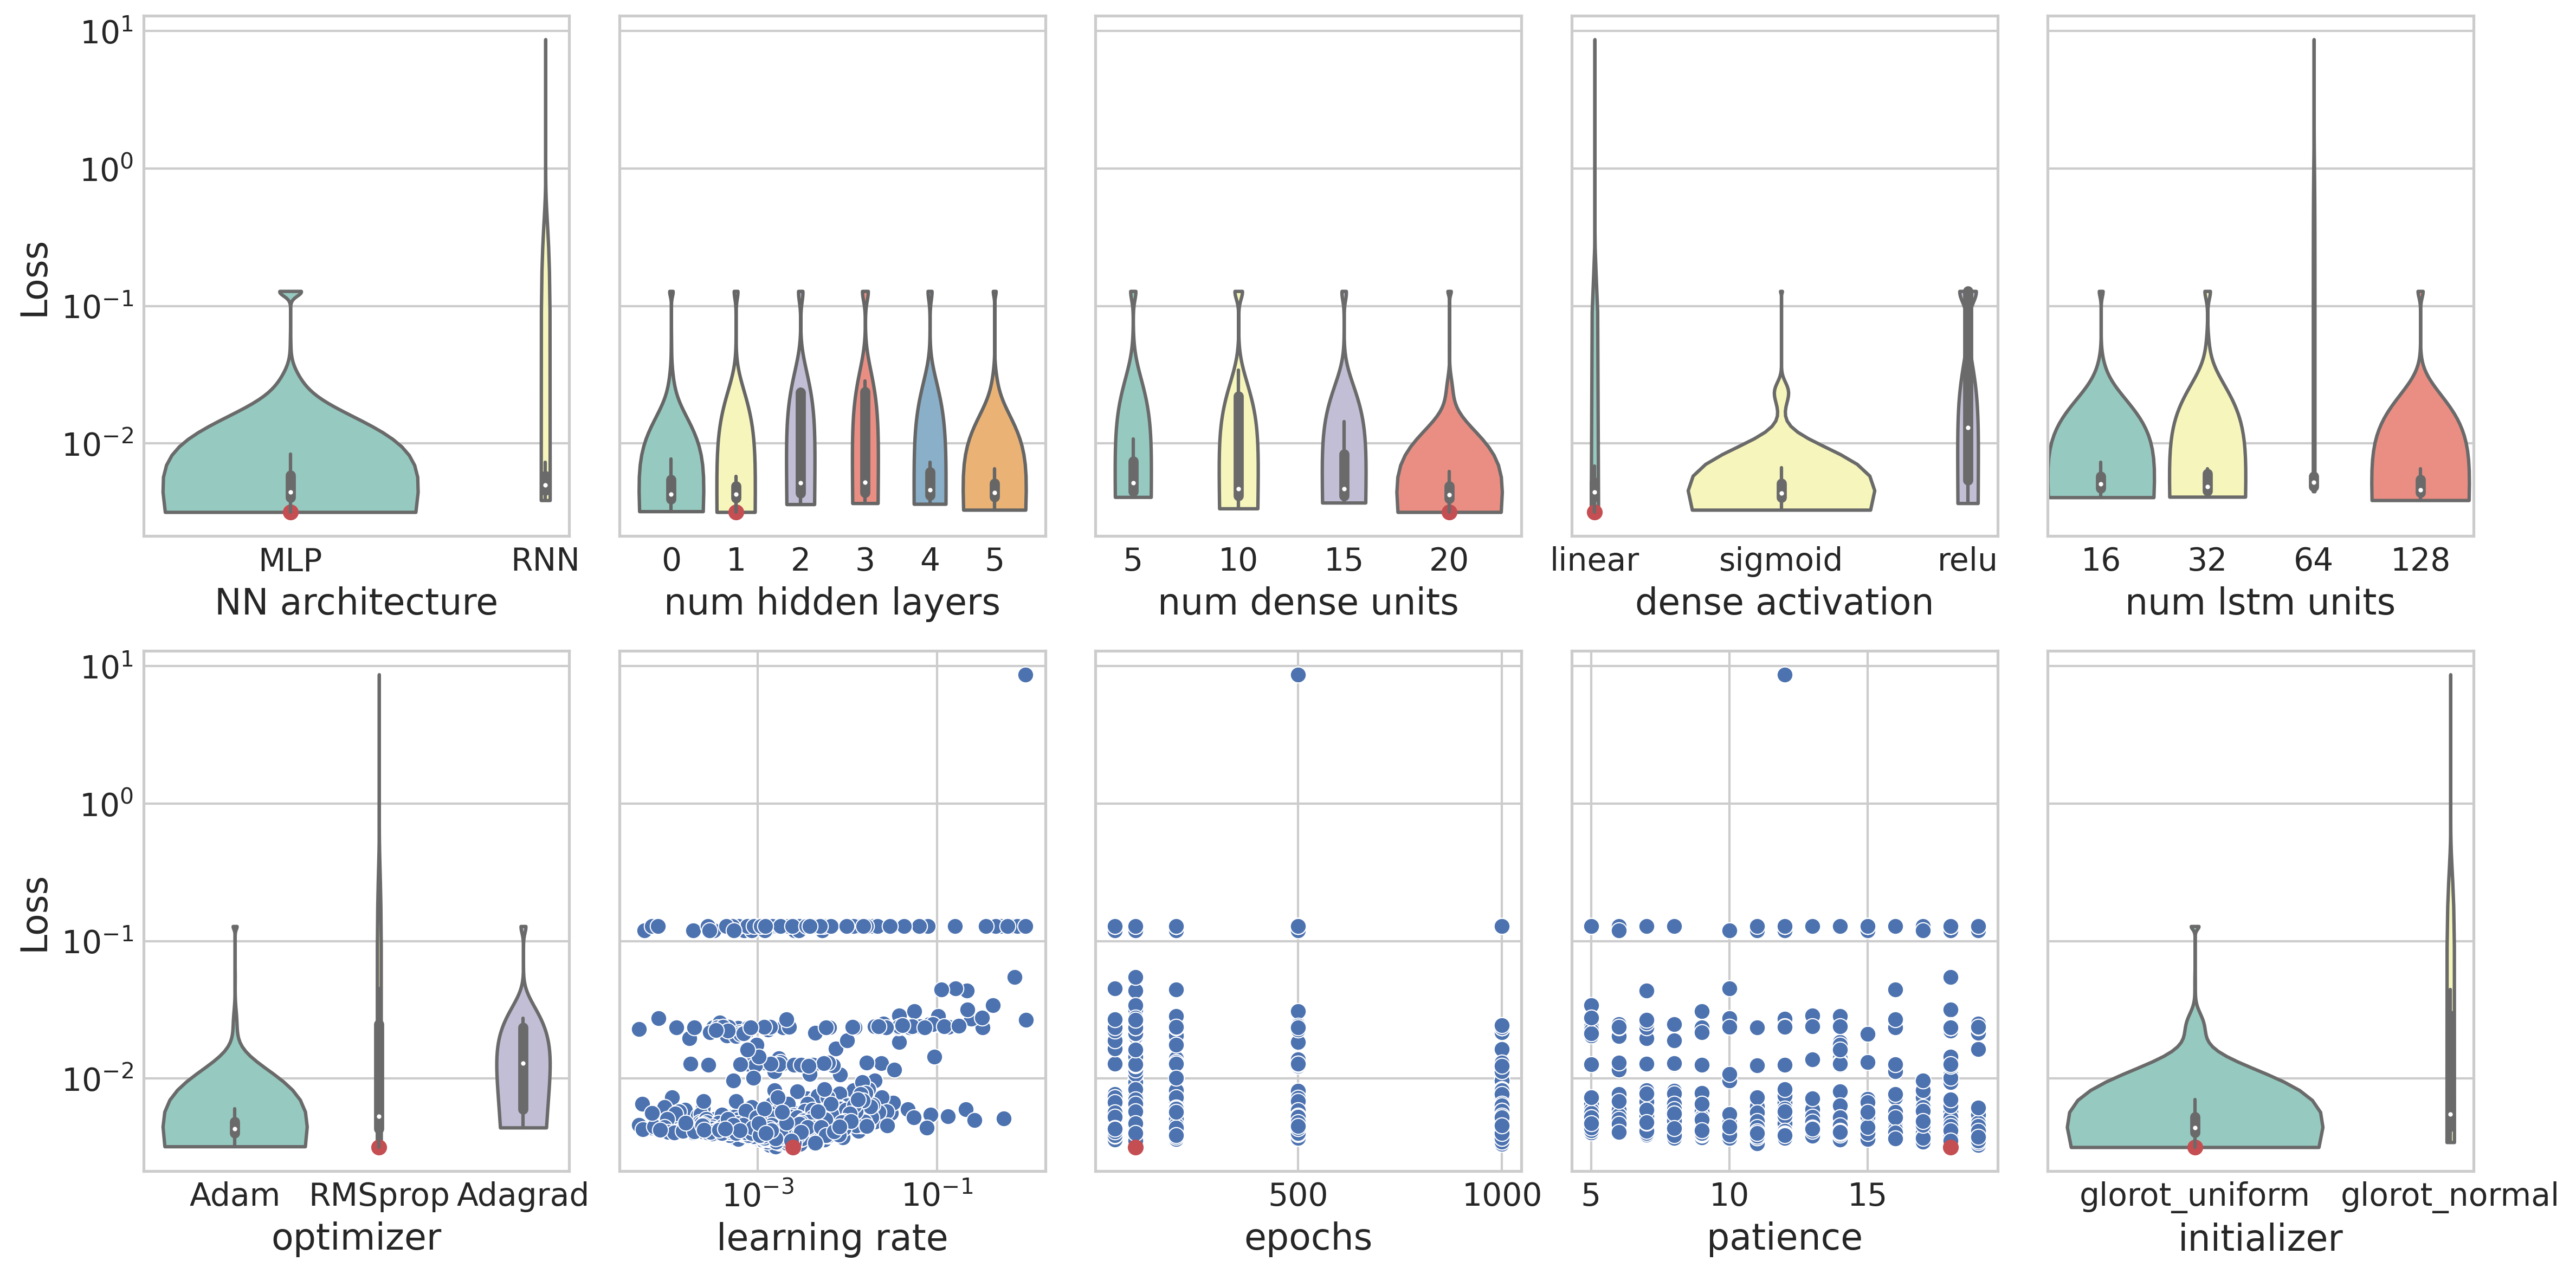
Figure 1 Results of the optimization process for the Zhao dataset as a function of each hyperparameter tuned. We used violin plots and scatter plots to graphically represent the distribution of the loss (MSE) values. Red dots highlight the best configuration.
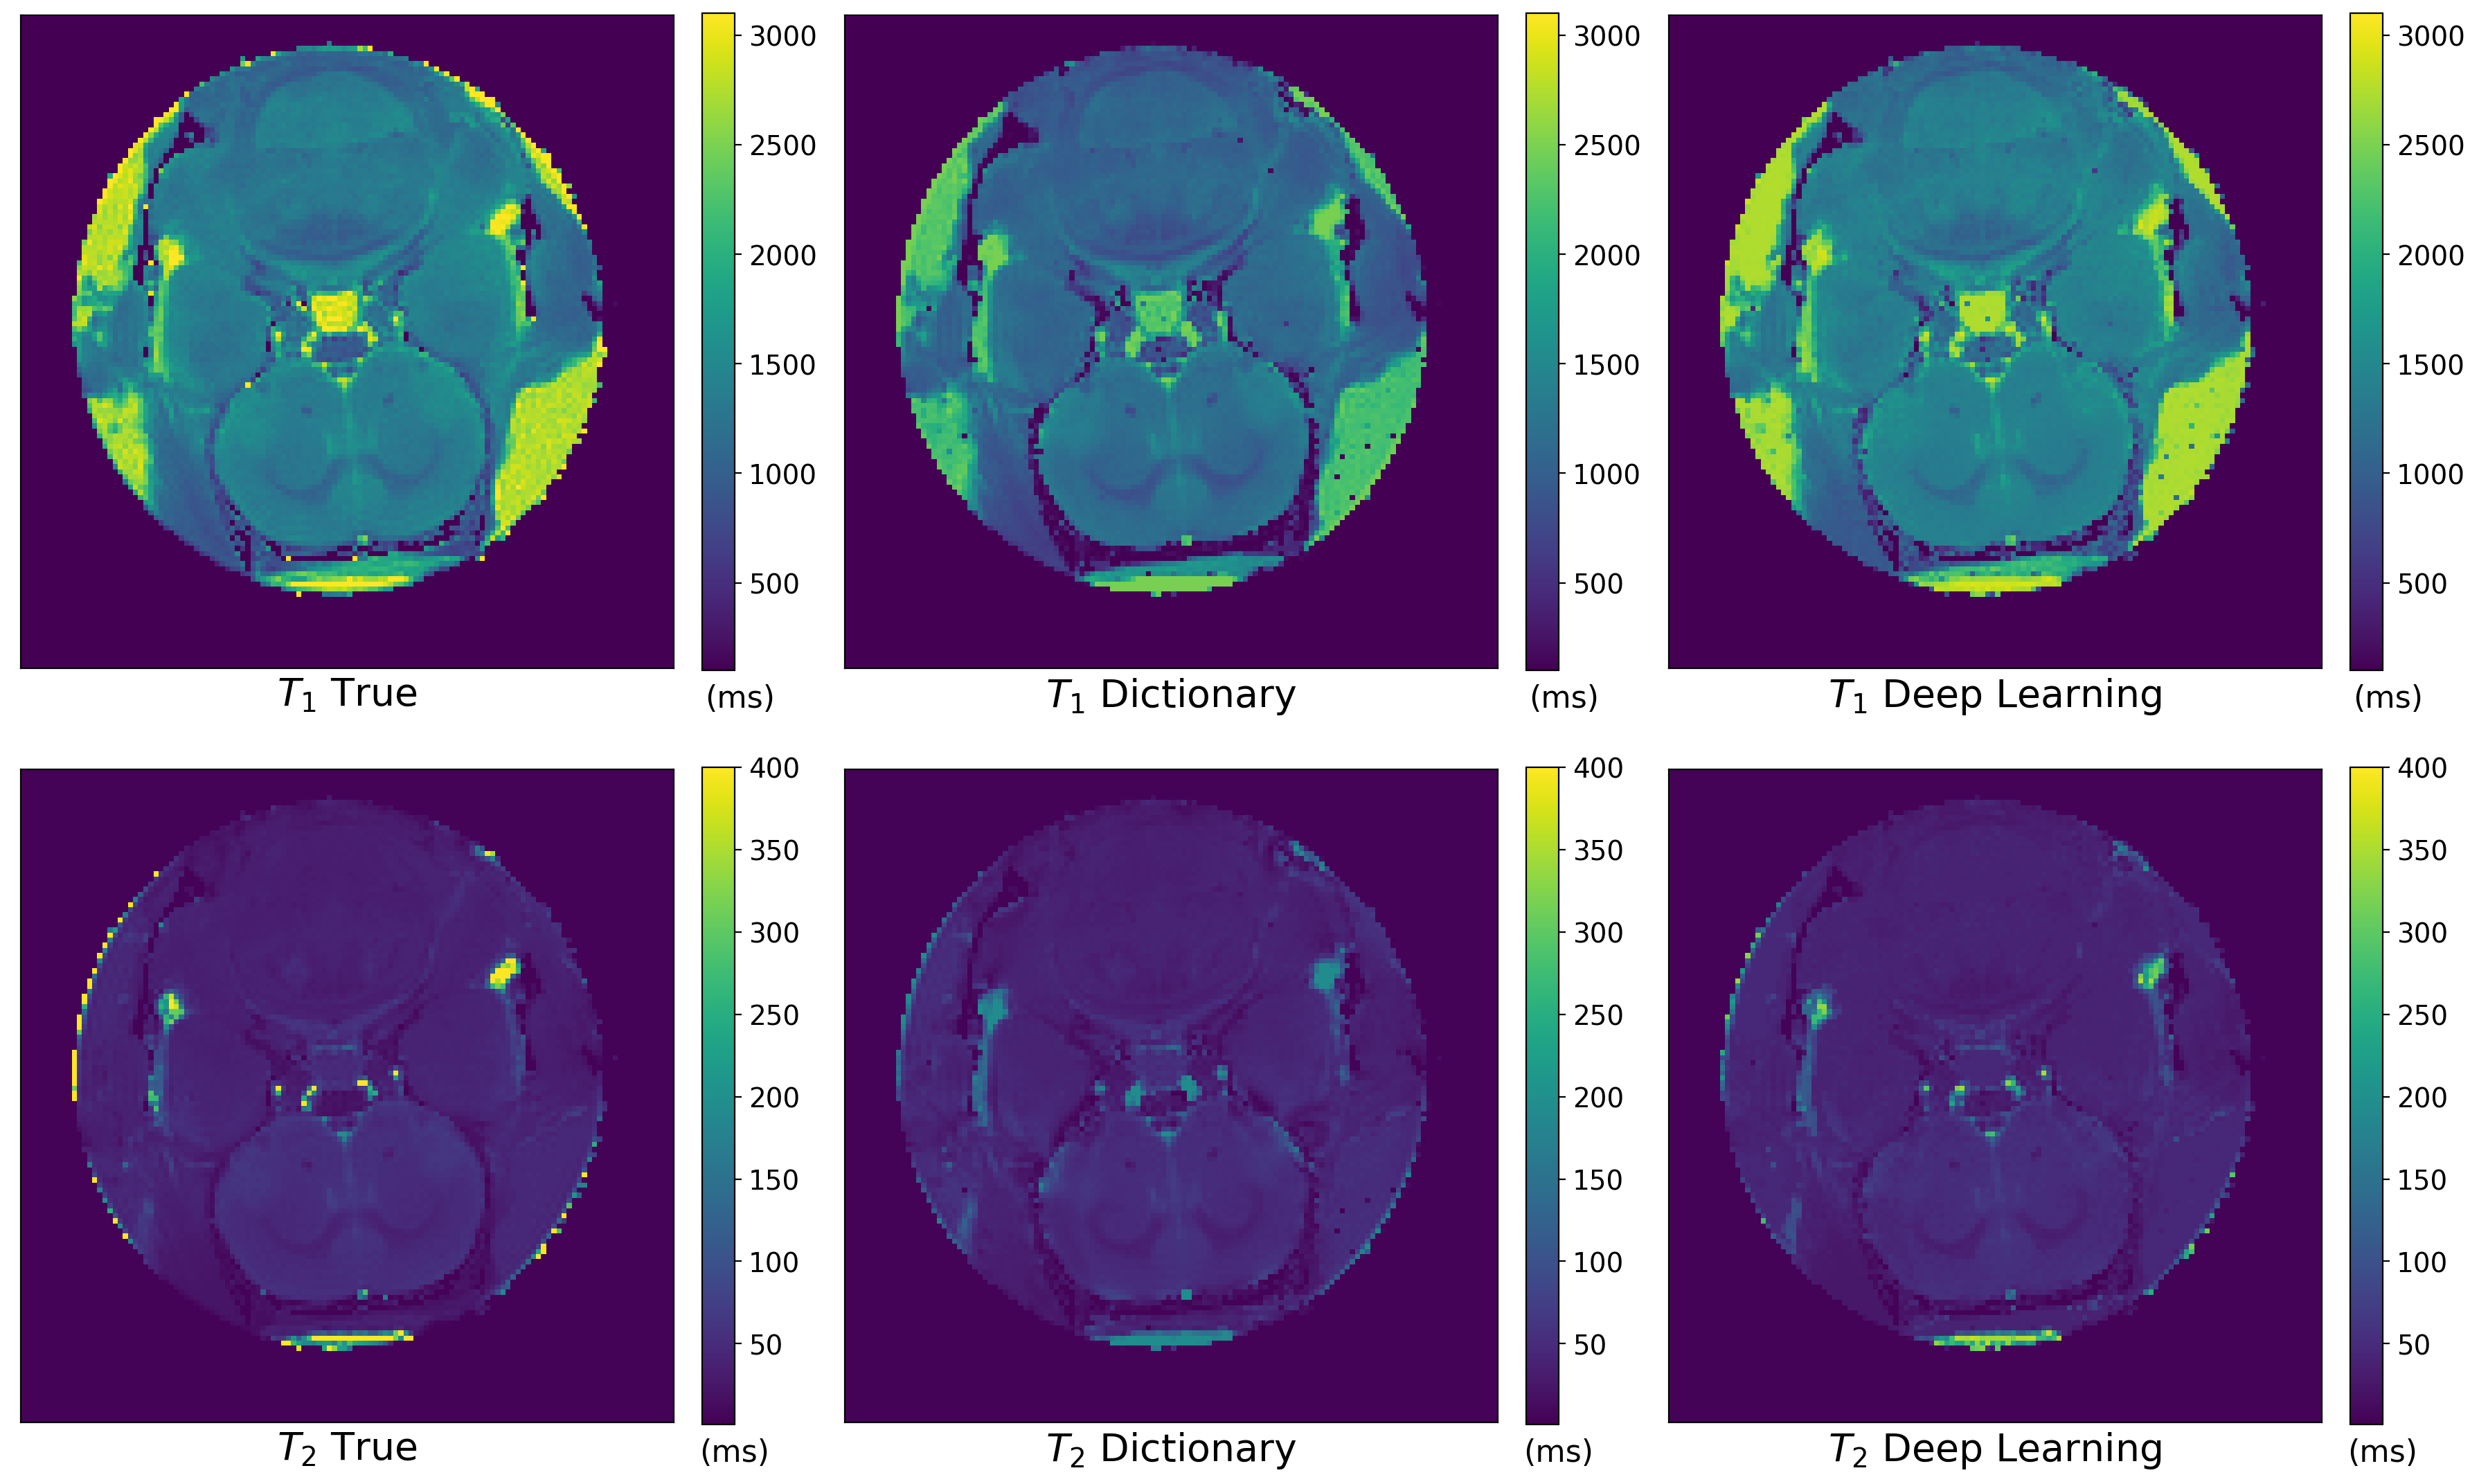
Figure 2 Comparison between the T1 and T2 true maps (first column) for the Zhao dataset, those reconstructed with the traditional dictionary-based method (second column) and those generated with the DL method (third column).
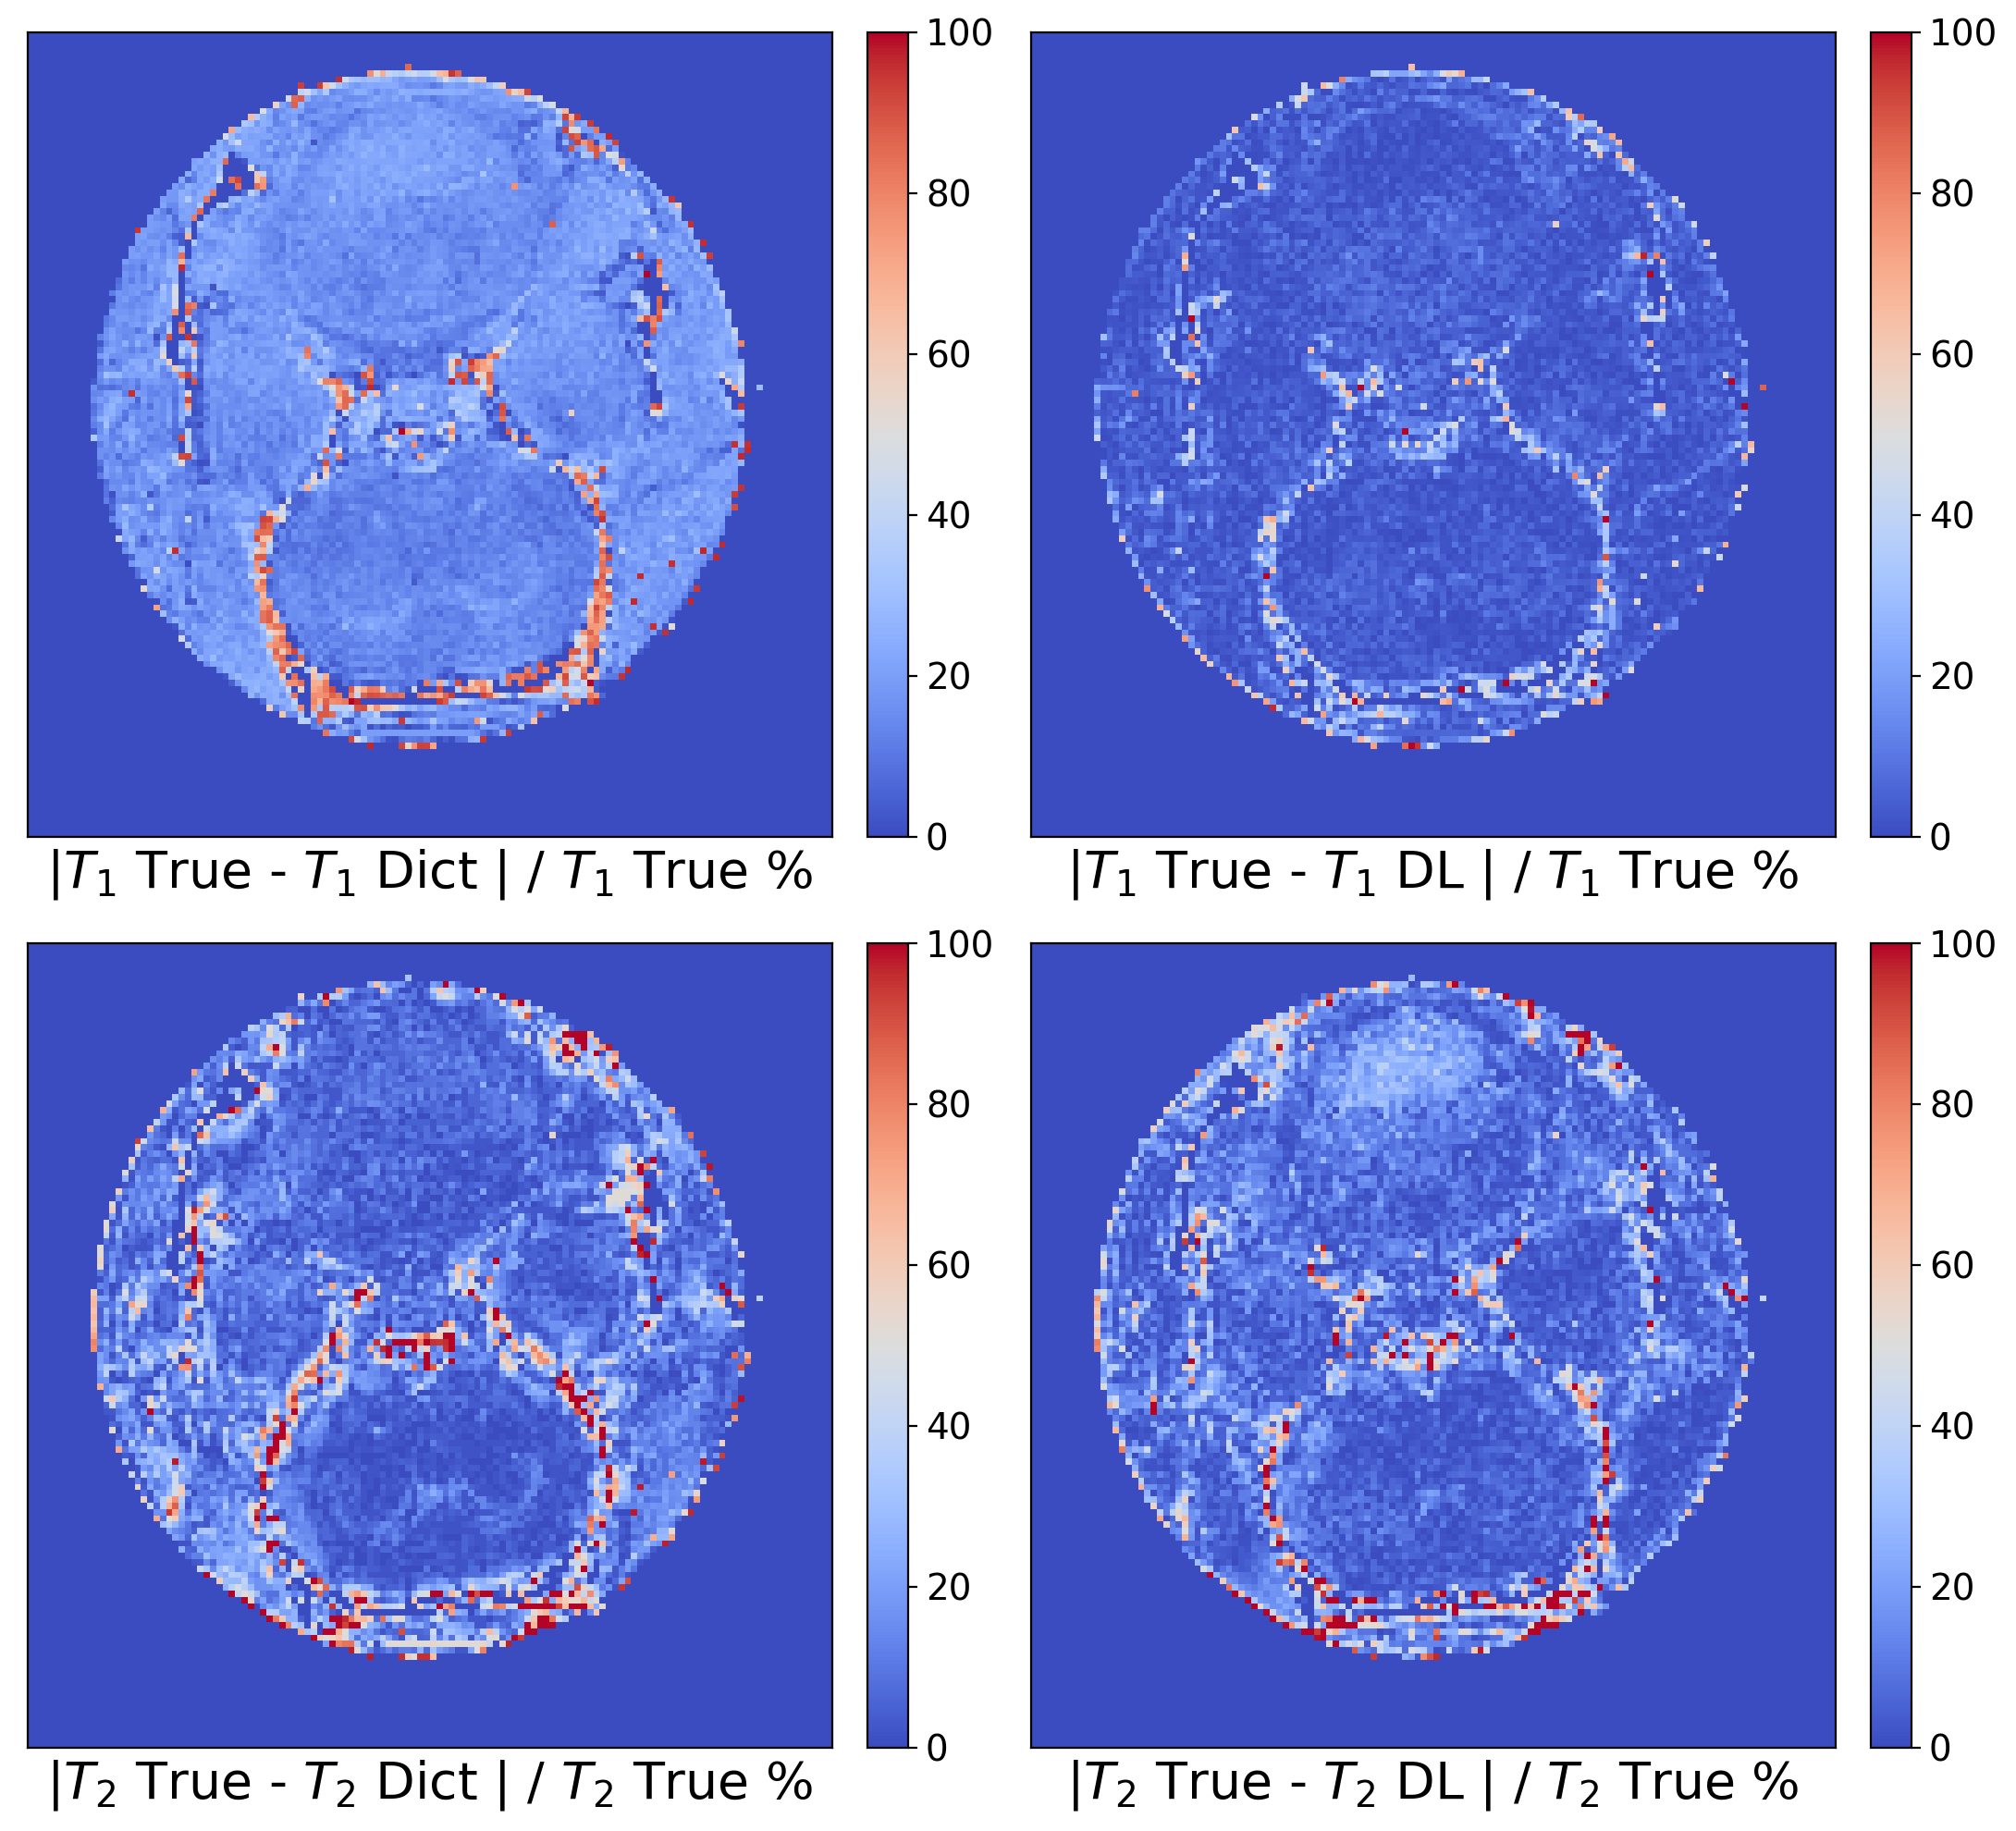
Figure 3 Error maps for T1 and T2 of the Zhao dataset computed pixel-by-pixel as the percentage relative error. The first column represents the results achieved by the dictionary-based method (Dict) and the second column those obtained by the DL method.
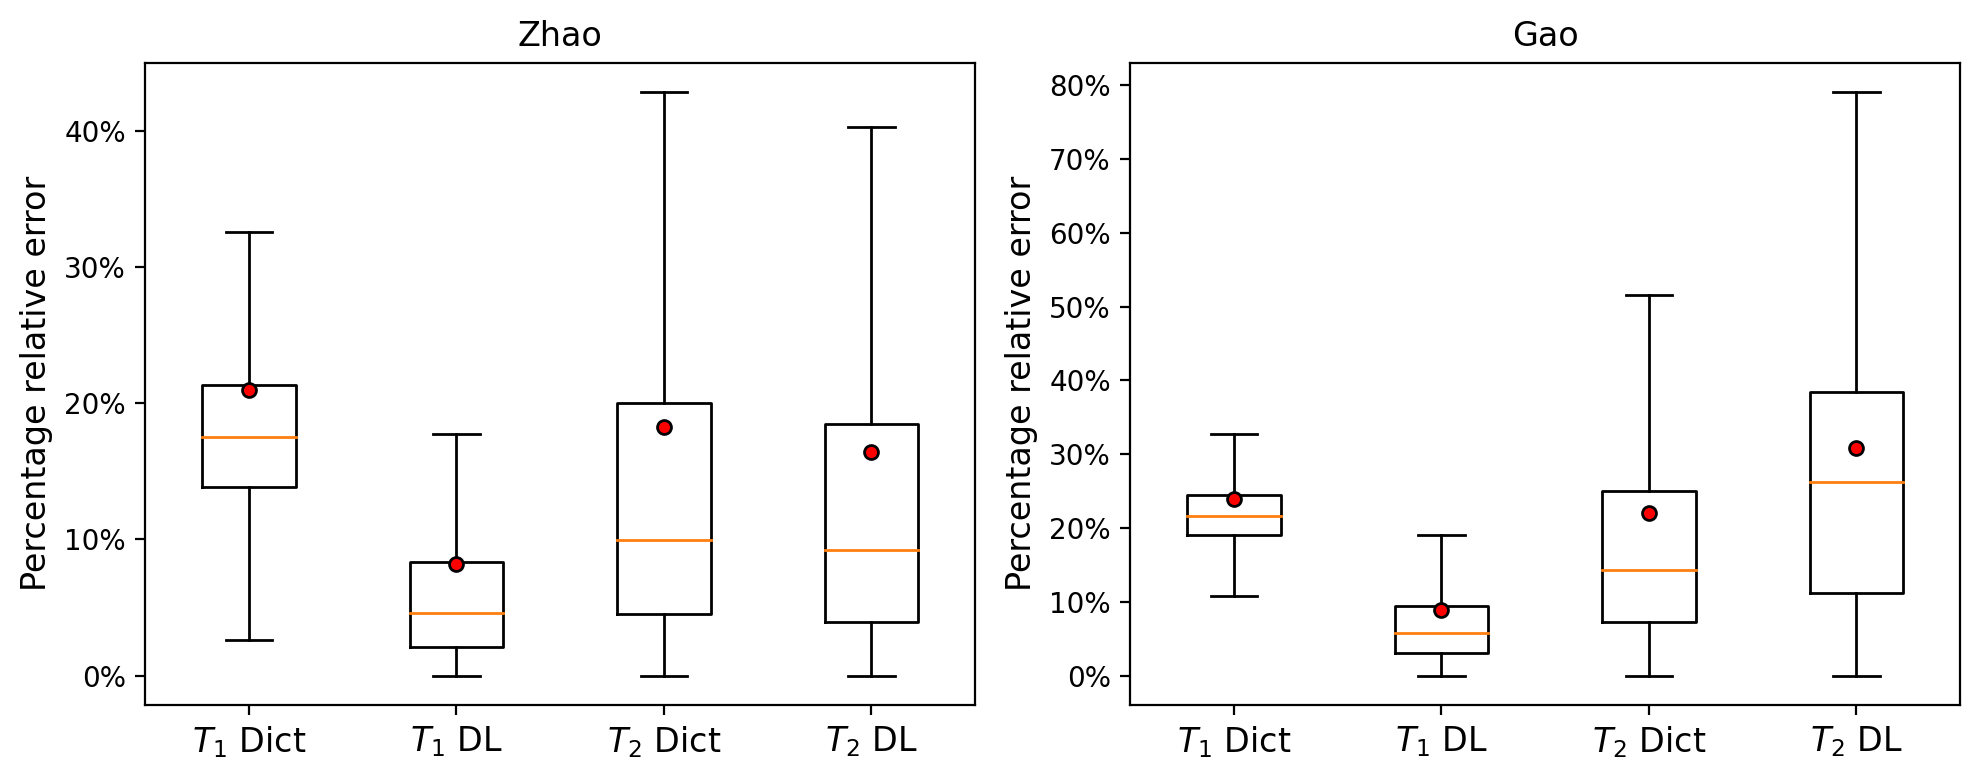
Figure 4 Boxplots of the percentage relative errors of the T1 and T2 maps reconstructed with the DL methodology and with the dictionary-based (Dict) method for the Zhao and Gao dataset respectively. Outlier values were excluded from the plot. Red dots represent the mean values of the distributions.
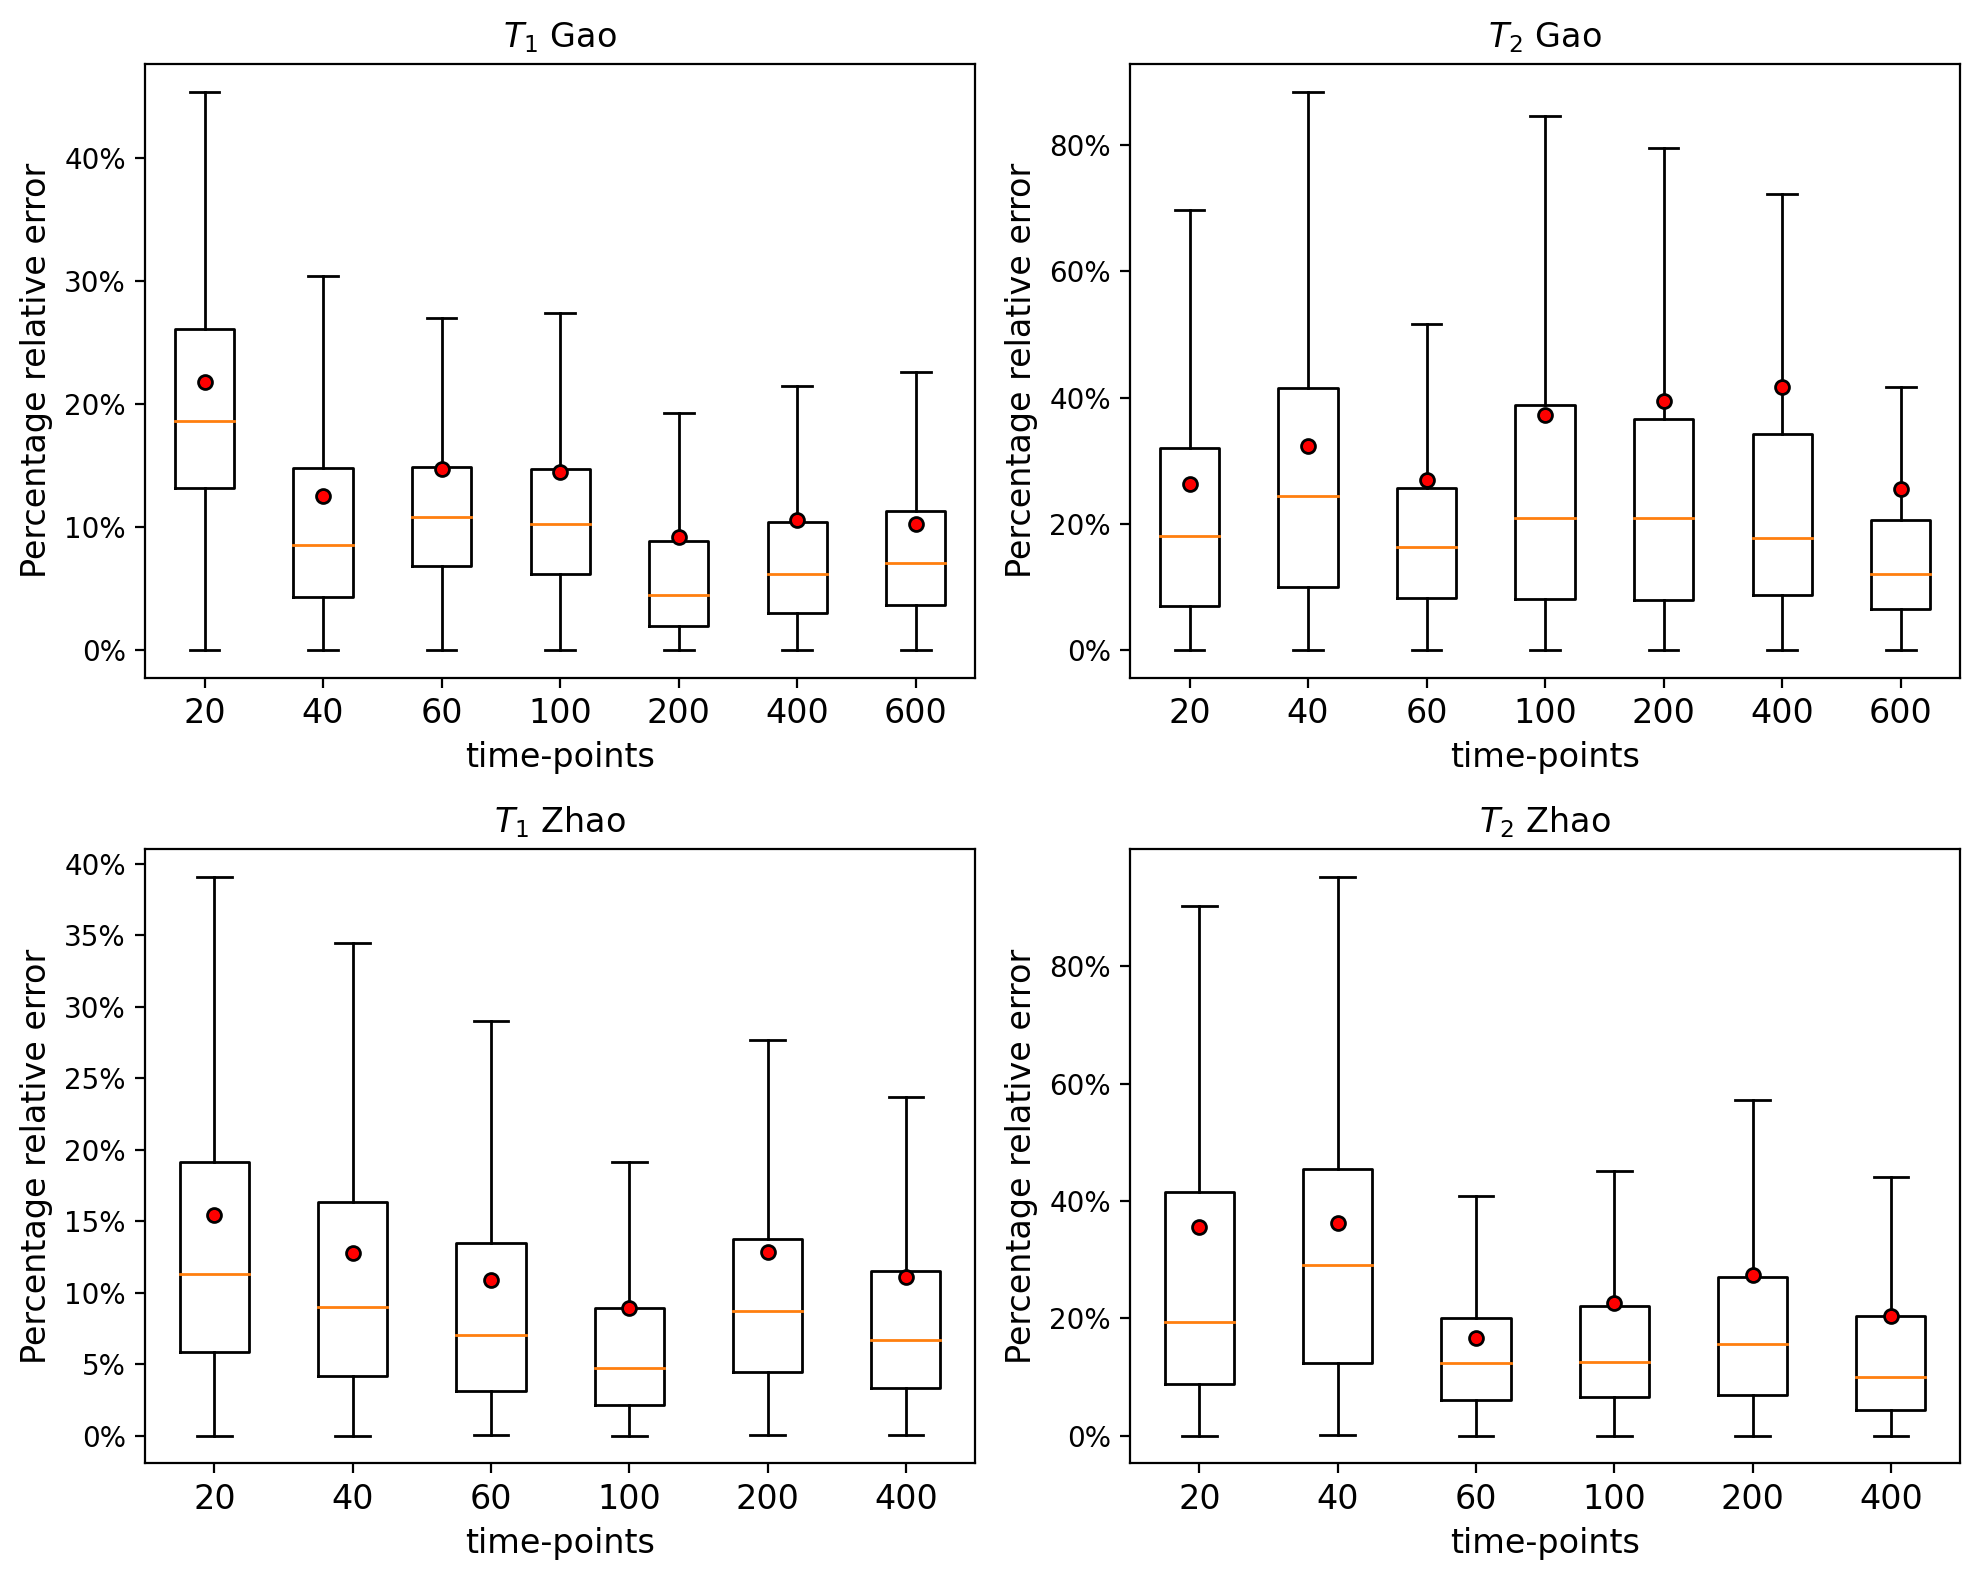
Figure 5 Percentage relative errors of T1 and T2 test maps as a function of different sequence lengths of 20, 40, 60, 100, 200, 400 and 600 time-points for the Gao acquisition schedule (first row) and of 20, 40, 60, 100, 200 and 400 time-points for the Zhao (second row) acquisition schedule. Outlier values were excluded from the plot. Red dots represent the mean values of the distributions.