2510
Tailored MR fingerprinting of pediatric brain tumor patients1Columbia Magnetic Resonance Research Center, Columbia University, New York, NY, United States, 2Dayananda Sagar College of Engineering, Bangalore, India, 3Columbia University Irving Medical Center, New York, NY, United States
Synopsis
We demonstrated the utility of tailored MR fingerprinting (TMRF) of pediatric patients with brain tumor to 1) differentiate tumor from healthy tissue using quantitative maps; 2) tailor TMRF sequence to include T2 fluid-attenuated inversion recovery (FLAIR) contrast that could potentially substitute T2 FLAIR sequence used in routine pediatric tumor protocol. The mean土SD difference in T1 and T2 values between tumor and normal tissues for 3 patients were 1.05土0.09 and 0.05土0.02 seconds respectively. The TR and flip angle trains were tailored to include T2 FLAIR contrast for adult imaging. Current and future work includes optimizing T2 FLAIR for the pediatric population.
PURPOSE
To demonstrate the utility of tailored MR Fingerprinting (TMRF) to image pediatric brain tumors to differentiate tumors from normal tissue based on changes in T1 and T2 values. TMRF provides multi-contrast, non-synthetic, qualitative, and quantitative images simultaneously1-4. The TMRF sequence was further tailored to include non-synthetic T2 fluid-attenuated inversion recovery (FLAIR) contrast in addition to existing T1w, T1 FLAIRw, T2w and T1, T2 maps. The modified TMRF sequence can potentially substitute the acquisition of the T2 FLAIR from the routine pediatric brain tumor protocol leading to a reduction in total scan time while producing non-synthetic contrasts and quantitative tissue parametric maps.METHODS
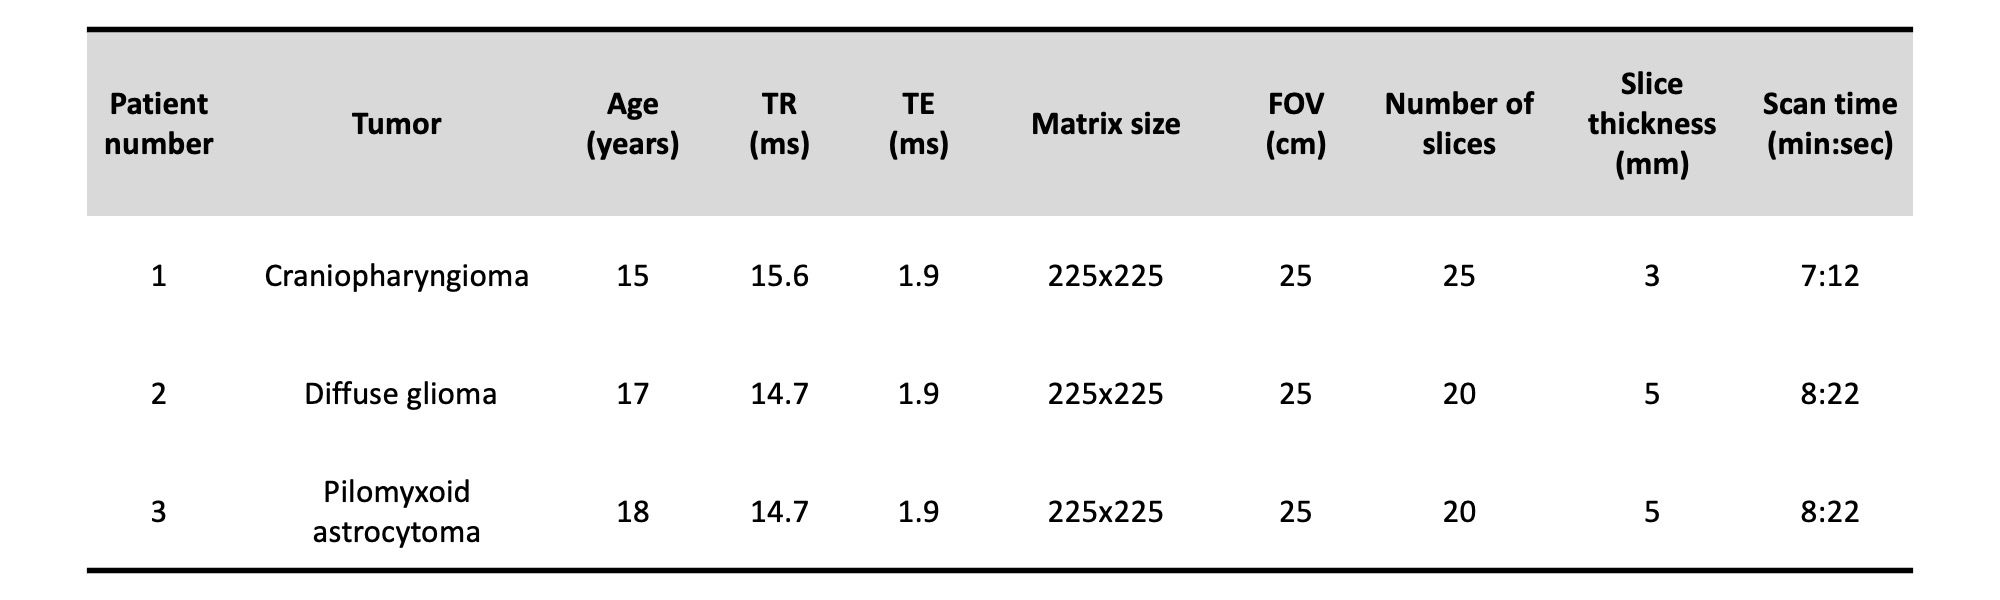
We previously demonstrated TMRF on NIST/ISMRM MRI phantom and healthy volunteers2-5. In this study, we scanned 3 pediatric patients with brain tumors on 3T GE Discovery MR750W with 8 channel head coil after obtaining consent from their guardians. We included TMRF as an add-on sequence to the existing routine brain tumor protocol and scanned prior to contrast injection. Figure 1 shows the schematic representation of routine pediatric brain tumor protocol with sequences used before (light green) and after (dark green) the contrast injection, which takes ~32 minutes to scan. Modified TMRF with T2 FLAIR (brown box) provides qualitative (light orange) and quantitative (dark orange) maps in about ~8 minutes. The 1st patient was scanned with original TMRF sequence2 and the remaining 2 patients were scanned with modified TMRF where we tailored the sequence to include T2 FLAIR by tweaking the repetition time (TR) and flip angle (FA) trains (figure 2 (a,b)) with minimum TE of 1.9ms. The original TMRF sequence was of 1000 time points (~5 minutes for 20 slices). The time points which corresponded to all three contrasts were within 200 time points. Hence, we retained the TR and FA until the 500th time point and tailored the remaining 250 to obtain T2 FLAIR contrast. The last 250 time points were discarded to reduce the scan time. The modified TMRF consists of 750 time points which take ~8 minutes for 20 slices. Table 1 shows the tumor type, acquisition parameters for 3 patients. The modified TMRF sequence was tested on phantom (tap water and cylindrical unified GE phantom) and NIST/ISMRM phantom to verify the qualitative images and quantitative maps, respectively. The qualitative images were compared with the gold standard T2 FLAIR sequence and quantitative maps were compared with the previously published TMRF study5. TMRF was optimized and tested on a healthy human. We used the modified MR fingerprinting deep reconstruction network (DRONE) method6 to reconstruct quantitative maps (in vitro and in vivo). The mean and standard deviation (SD) of the T1 and T2 values of the tumor and normal tissue were plotted for 3 patients by manually drawing the region of interest (ROI) on the slice (T1 map) where the tumor was hyperintense. The same slice and ROIs were used for the T2 map. For qualitative image reconstruction, all 750 time point images were reconstructed using a sliding window. The time point for T2 FLAIR (597th time point) was chosen manually after visually inspecting the contrast along with prior knowledge of simulation (figure 2 (c)). However, the obtained images were noisy and therefore were denoised using the built-in deep learning denoising function in MATLAB (The Mathworks Inc.).RESULTS AND DISCUSSION
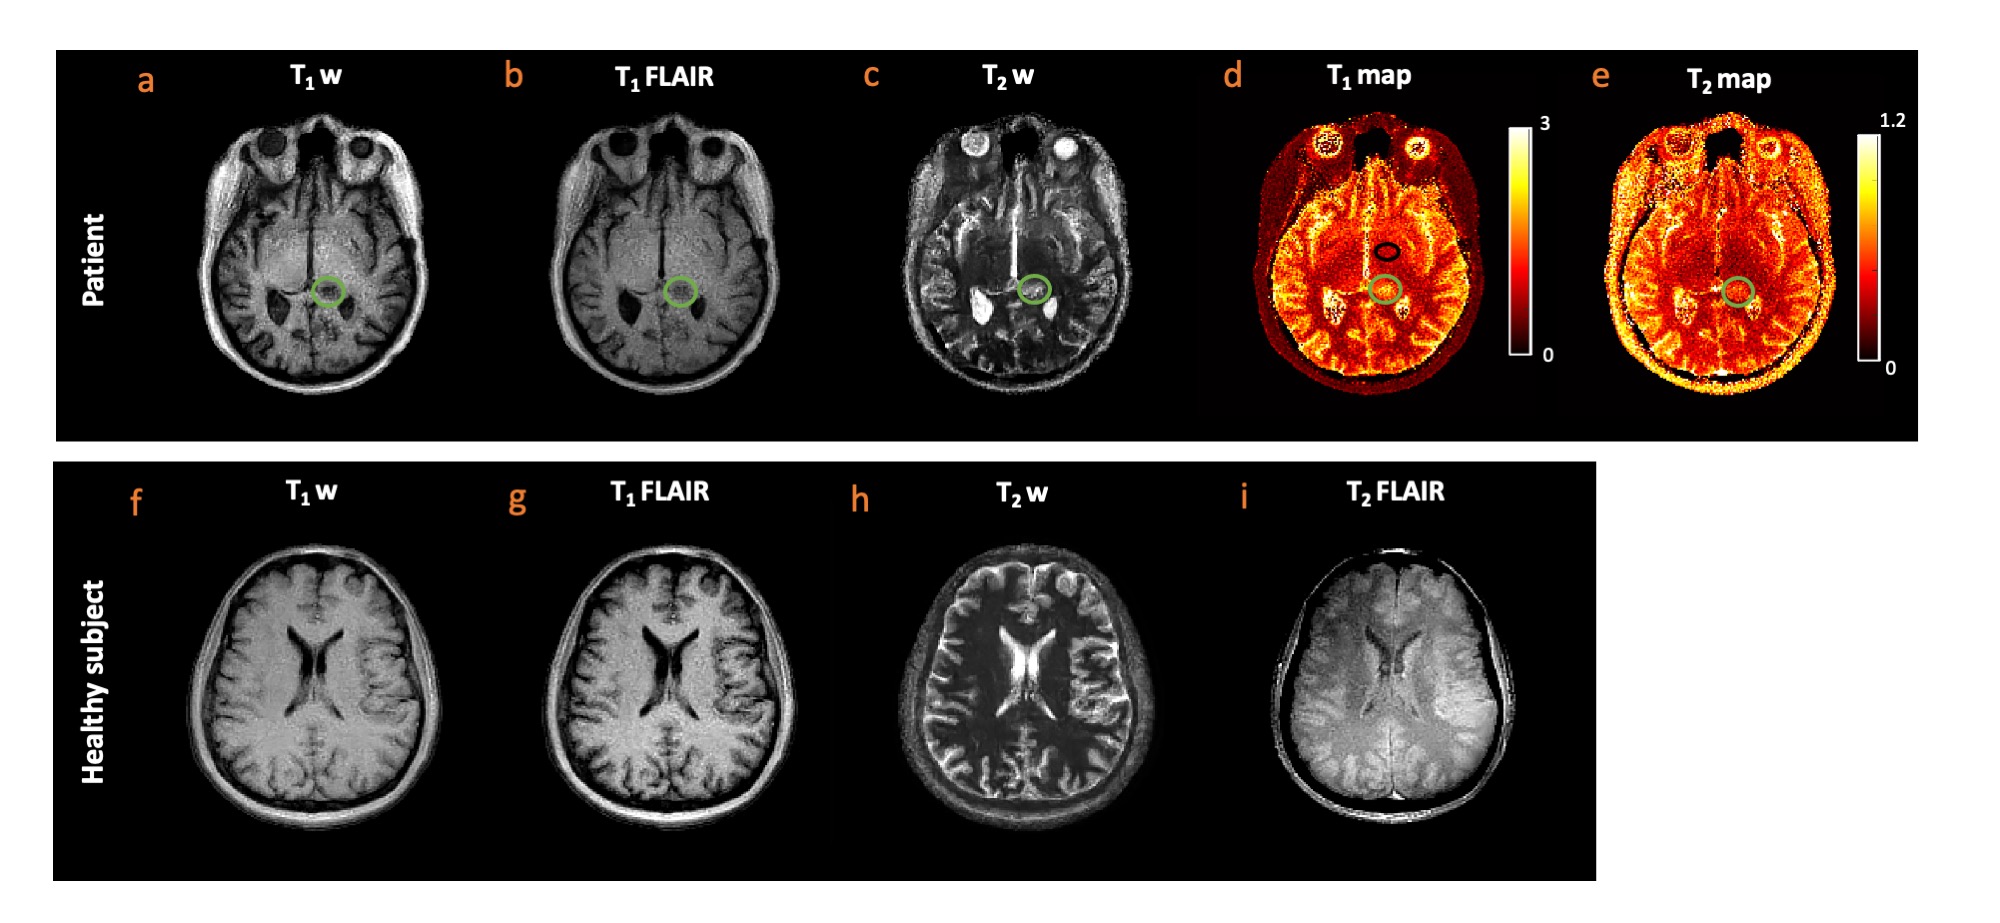
Figure 2 (a-c) shows the TR, FA, and EPG simulation for four tissue types. The colored arrows in figure 2 (c) indicate the contrast time points picked after visual inspection. Figure 2 (d,e) shows the T2 FLAIR contrast images (obtained from gold standard and TMRF) and quantitative maps from TMRF, respectively. The qualitative image indicates that water is relatively suppressed and is similar to the gold standard. All T1 and T2 values of the 14 spheres from the NIST phantom (figure 2 (e)) are in the same range as the previously reported5. Figure 3 (a-c) shows the representative qualitative images and figure 3 (d,e) shows the T1 and T2 map obtained from a patient with diffuse glioma (green ROI). The black ROI shown in the T1 map represents the healthy region. Figure 3 (f-i) shows all 4 contrasts obtained from a healthy subject. The gray matter and white matter contrast in T2 FLAIR need improvement. The inversion time (TI) for T2 FLAIR contrast was optimized for the adult brain and has to be further optimized for the pediatric brain. Figure 4 (a,b) shows the mean and SD of T1 and T2 values of the tumor and healthy tissue for all 3 patients. The mean土SD difference in T1 and T2 values between tumor and normal tissues for 3 patients were 1.05土0.09 and 0.05土0.02 seconds respectively. It can be observed that the tumor region has higher T1 and T2 values compared to healthy tissue.CONCLUSION
The quantitative maps from TMRF of pediatric tumors aids in distinguishing tumors from the normal tissue. Current work involves acquiring more data to attain statistical significance. T2 FLAIR was added to the existing contrasts by tailoring the sequence to potentially replace the standard T2 FLAIR sequence from routine brain tumor protocol. Current and future work includes improving the T2 FLAIR contrast and optimizing the TI for the pediatric population.Acknowledgements
This work was supported, in part, by GE-Columbia research partnership grant and also performed at Zuckerman Mind Brain Behavior Institute MRI Platform, a shared resource, and Columbia MR Research Center site.References
1. Sairam Geethanath et al. Rapid, simultaneous non-synthetic multi-contrast and quantitative imaging using Tailored MR Fingerprinting (TMRF) - ISMRM 2019
2. Pavan Poojar et. al., Natural, multi-contrast and quantitative imaging of the brain using tailored MR Fingerprinting, ISMRM 2020.
3. Poojar, Pavan, et al.. "A faster and improved tailored Magnetic Resonance Fingerprinting." ISMRM 2021
4. Pavan Poojar et. al., In vivo repeatability of Tailored MR Fingerprinting, ISMRM, 2021
5. Enlin Qian et a. Two-site repeatability study of Tailored Magnetic Resonance Fingerprinting (TMRF), ISMRM 2020
6. Cohen, O., et al. MR Fingerprinting Deep RecOnstruction NEtwork (DRONE). Magnetic Resonance in Medicine, 2018
Figures