2509
Spectral principal axes system (SPAS) and tuning of tensor-valued encoding for time-dependent anisotropic diffusion1Centre for Functional and Diagnostic Imaging and Research, Copenhagen University Hospital Amager and Hvidovre, Danish Research Centre for Magnetic Resonance, Copenhagen, Denmark, 2Random Walk Imaging, Lund, Sweden
Synopsis
Tensor-valued diffusion encoding can be confounded by time-dependent diffusion (TDD). Matching sensitivity to TDD or tuning of b-tensors with different shapes is needed for unbiased microstructure assessment. We present a method for tuning linear tensor encoding (LTE) to spherical tensor encoding (STE), which could be optimized for different hardware constraints. Furthermore, we introduce the spectral principle axes system (SPAS), representing spectral anisotropy of STE. The SPAS LTEs could provide an alternative to tuning and enable disentangling effects of microscopic anisotropy and TDD, useful to correlate cell shape and size.
Introduction
Tensor-valued diffusion encoding employs different b-tensor shapes to probe microstructure information unconfounded by macroscopic anisotropy1-9. It can for example be used to separate isotropic and anisotropic sources of diffusional variance (kurtosis)4 or quantify microscopic anisotropy1,2,10. These experiments can be confounded by time-dependent diffusion (TDD)11,12. Spectral domain analysis13-16 can be used to account for TDD also in tensor-valued encoding17,18, where encoding sensitivity to TDD can be gauged in terms of tuning and spectral anisotropy. While tuning affects signals at low b-values and is given by the spectral trace18-21, spectral anisotropy may add apparent kurtosis due to anisotropic diffusion and cause spherical tensor encoding (STE) to loose rotational invariance22,23. Linear tensor encoding (LTE) can be tuned to STE in special cases simply by using a single gradient channel from STE17. However, a more general approach is desired, particularly when free waveforms are optimized with respect to hardware limitations24,25.We show some principles for tuning LTE to STE with the possibility for rudimentary waveform optimizations. STE projections along the spectral principal axes system (SPAS)26 offer an interesting tuning alternative and can simultaneously maximize differences in TDD sensitivities. This approach could be useful to disentangle effects of cell size and anisotropy.
Theory
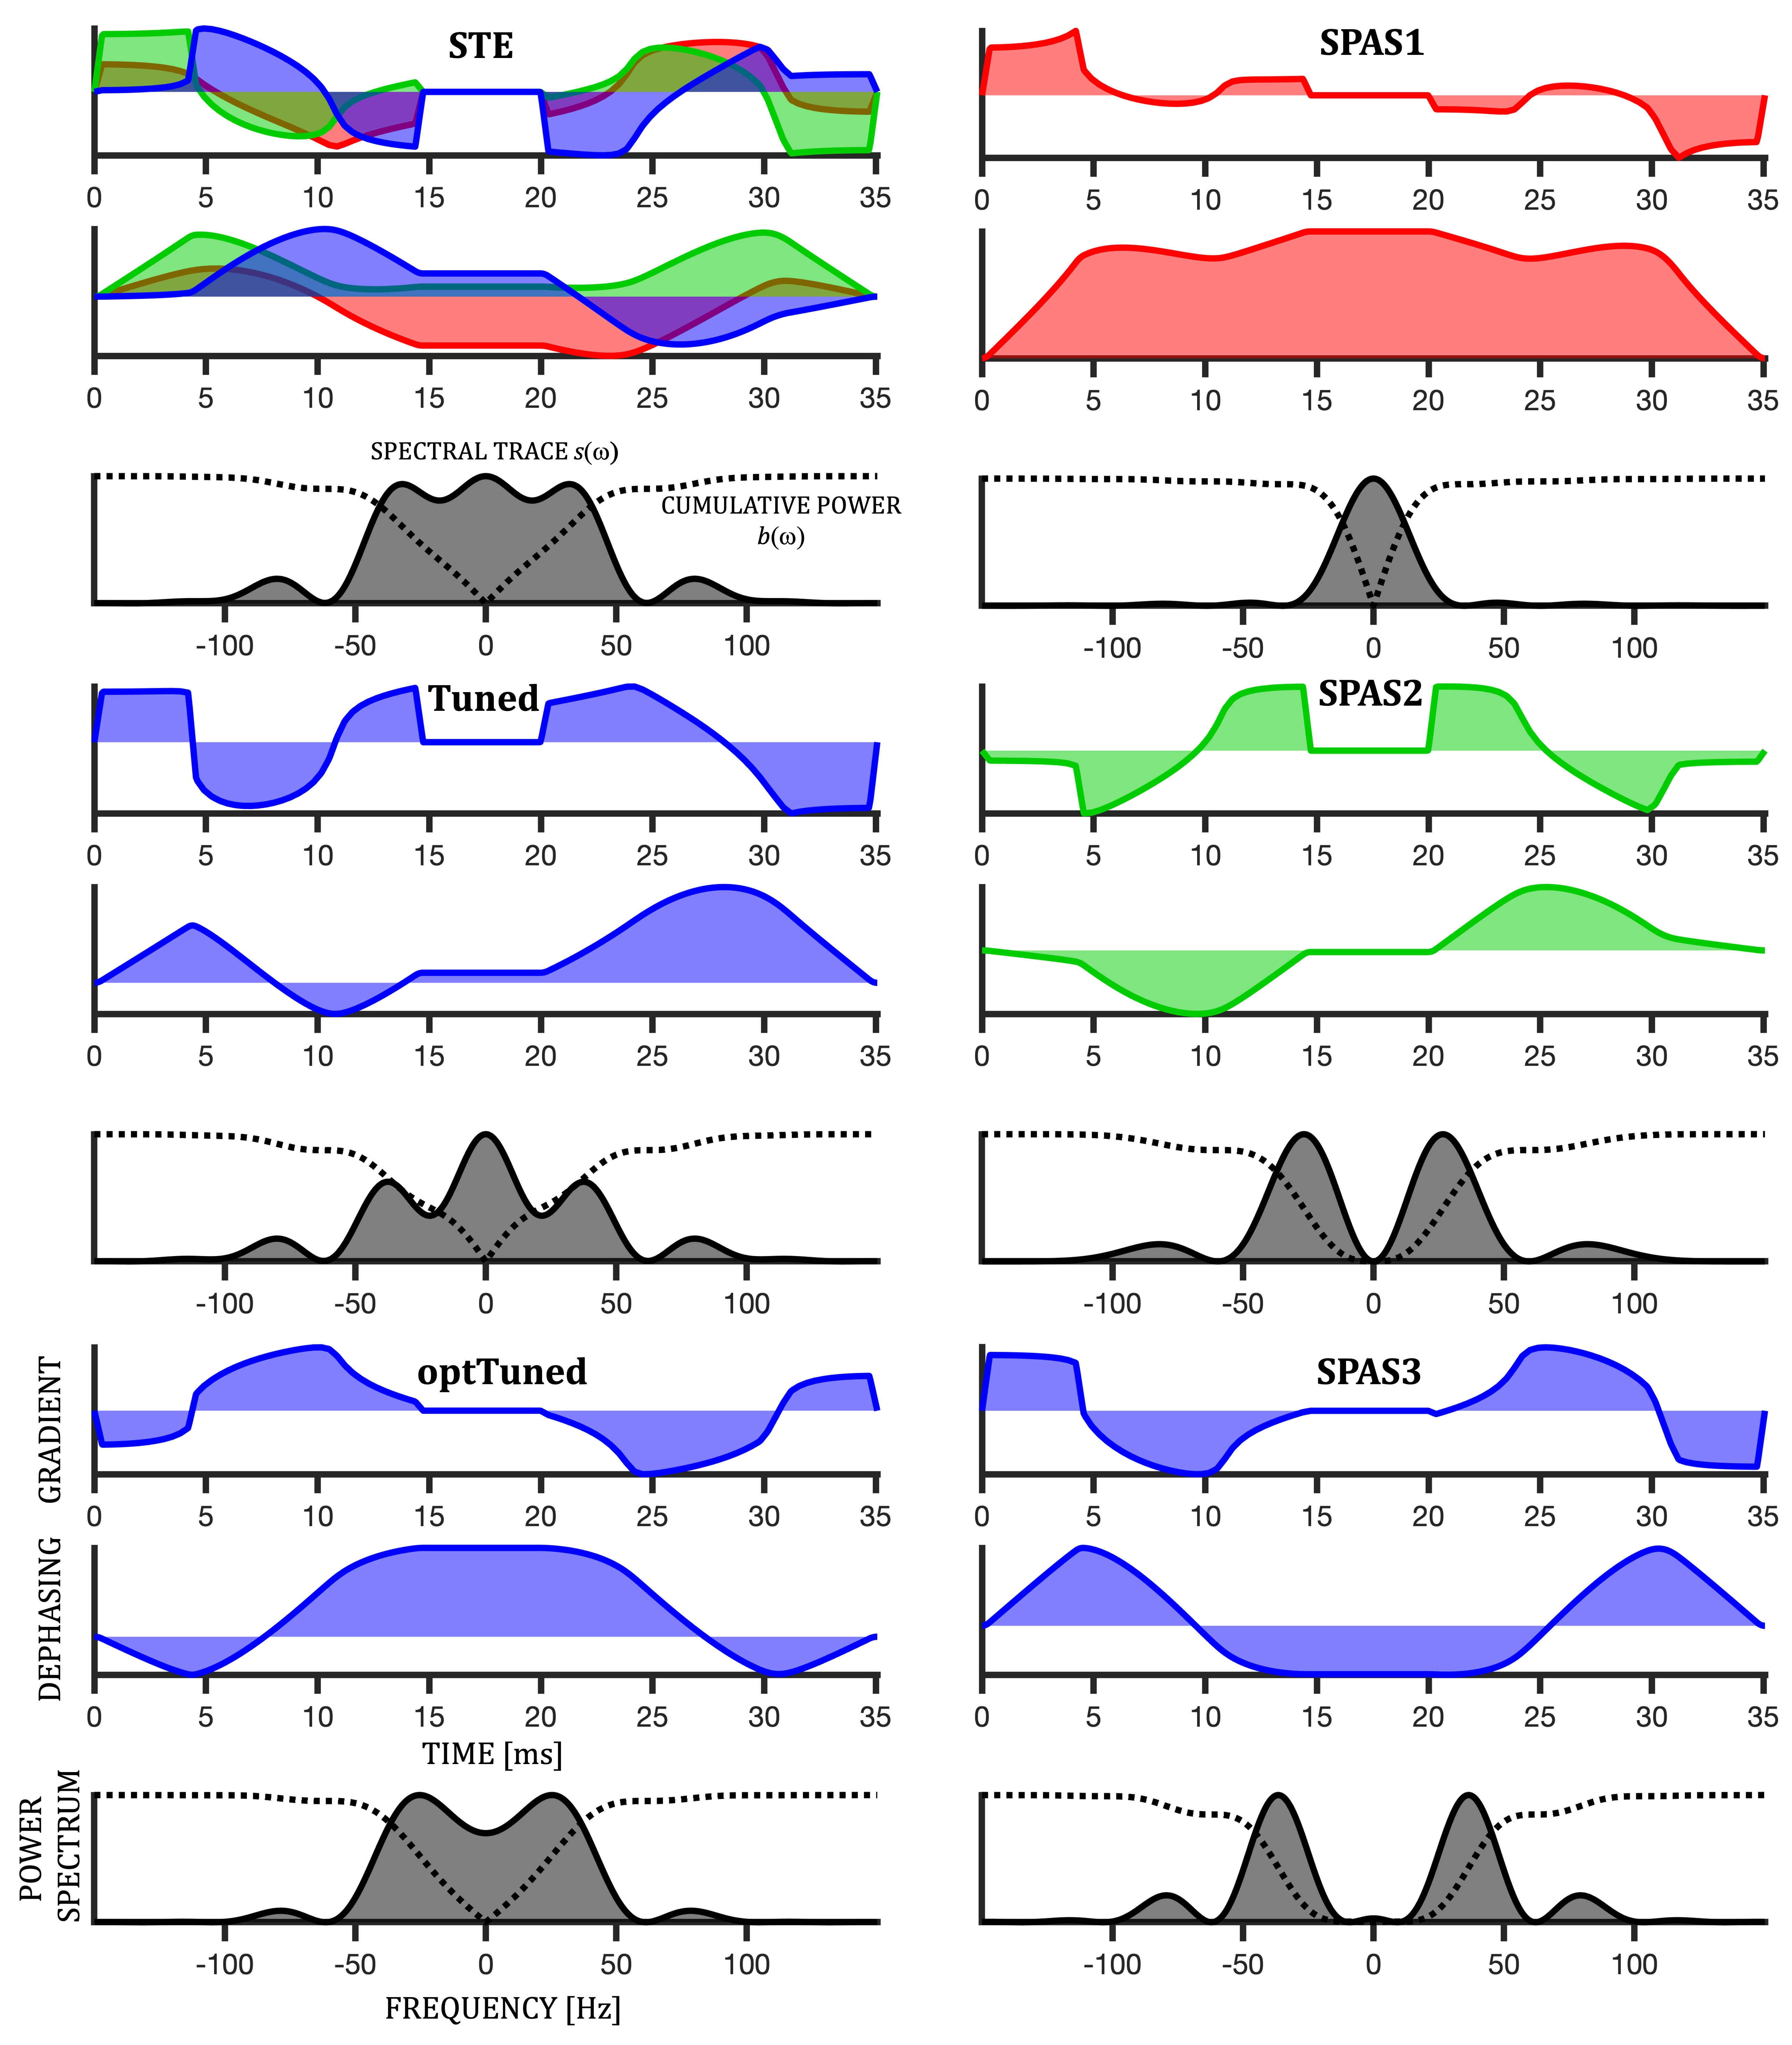
Apparent diffusivity ($$$D$$$) can be calculated based on the cross-power spectral densities $$$s_{ij}(\omega)$$$, defined in terms of the Fourier transforms of dephasing waveforms $$$\mathbf{q}(t)$$$18 (see Fig. 1), $$s_{ij}(\omega) \equiv q_i(\omega)\bar{q}_j(\omega).$$The cumulative encoding power is given by $$ b_{ij}(\omega) =\frac{1}{\pi}\int_{0}^{\omega}s_{ij}(\omega’)d\omega’$$ and the b-tensor is given by the total power, $$$b_{ij}(\infty)$$$. The apparent mean diffusivity (MD), given by signal attenuation at low b-values for a powdered sample, is determined by the spectral trace $$s(\omega) \equiv \sum_{i=1}^{3} s_{ii}(\omega)$$ as $$b\,\text{MD} = \frac{1}{\pi}\int_{0}^{\infty}s(\omega)\,\lambda_\text{iso}(\omega)\,d\omega,$$ where the isotropic diffusion spectrum $$$\lambda_\text{iso}(\omega) = \frac{1}{3}\sum_n \lambda_n(\omega)$$$ is given by the average compartment eigenspectra and the b-value is given by $$b=\frac{1}{\pi}\int_{0}^{\infty}s(\omega)d\omega.$$
The spectral trace is the key waveform property that needs to be considered for tuning, since different b-tensors are required to yield equal MD values. Given a b-tensor, e.g. for STE, a tuned LTE can be found by considering projections of the power spectra along unit vectors $$$\bf{u}$$$, $$s_{\mathbf{u}}(\omega) = \sum_{i,j} s_{ij}(\omega)u_i u_j.$$ Projections yielding $$$D_{\mathbf{u}}\approx \text{MD}$$$ are good candidates for extracting tuned LTE waveforms as $$$g_\text{LTE}(t) = \mathbf{g}_\text{STE}(t)\cdot\mathbf{u}.$$$
Methods
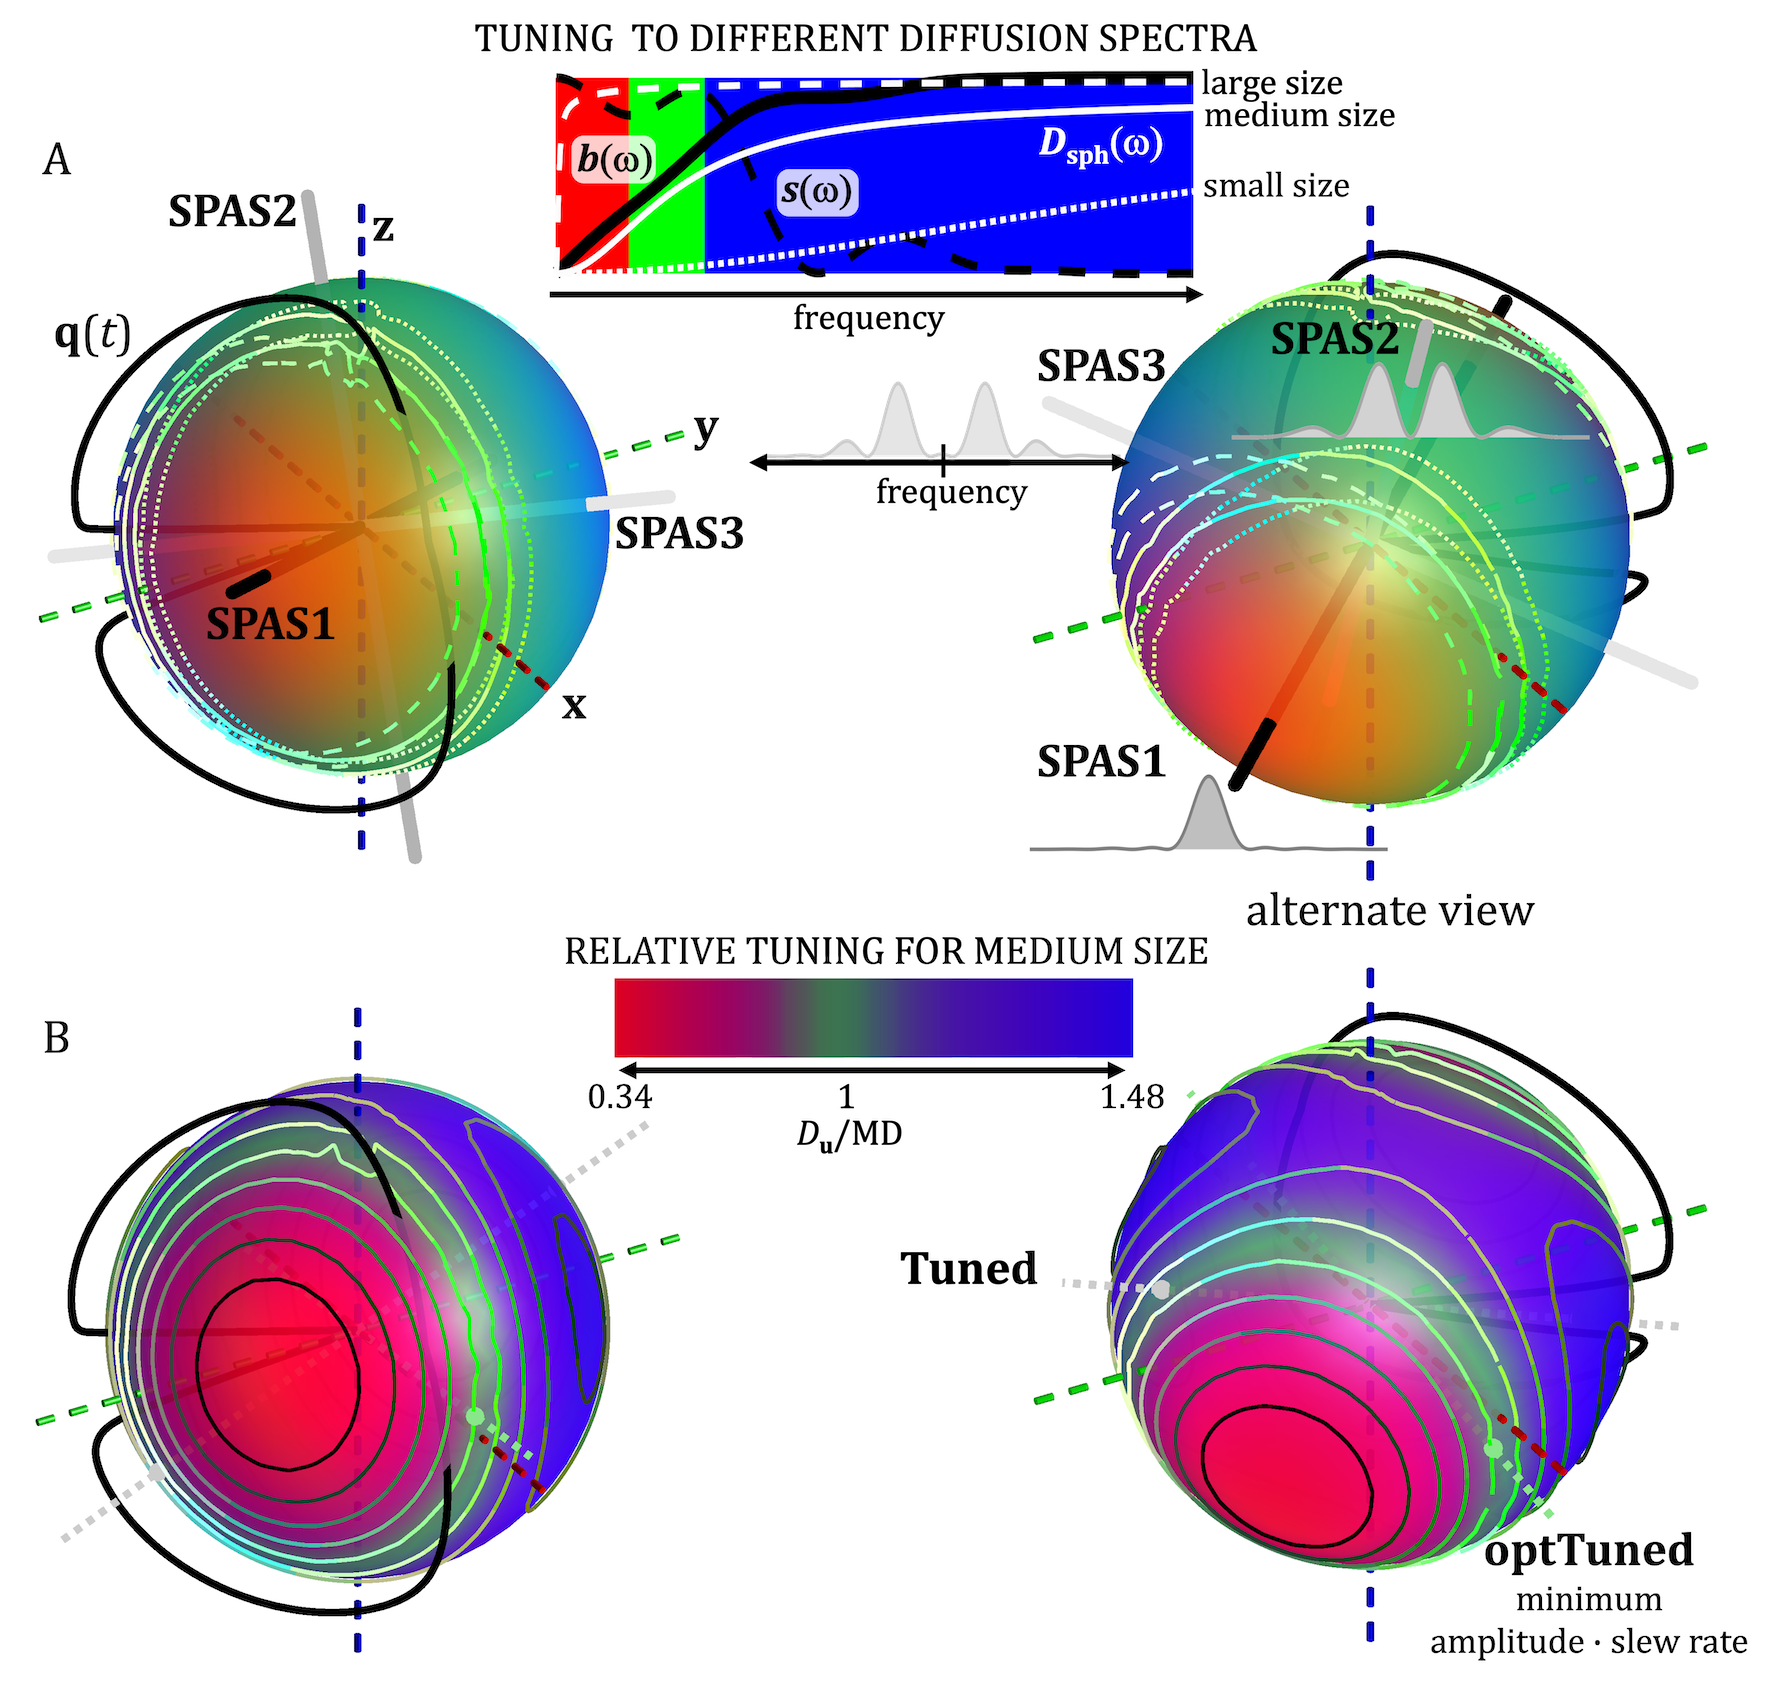
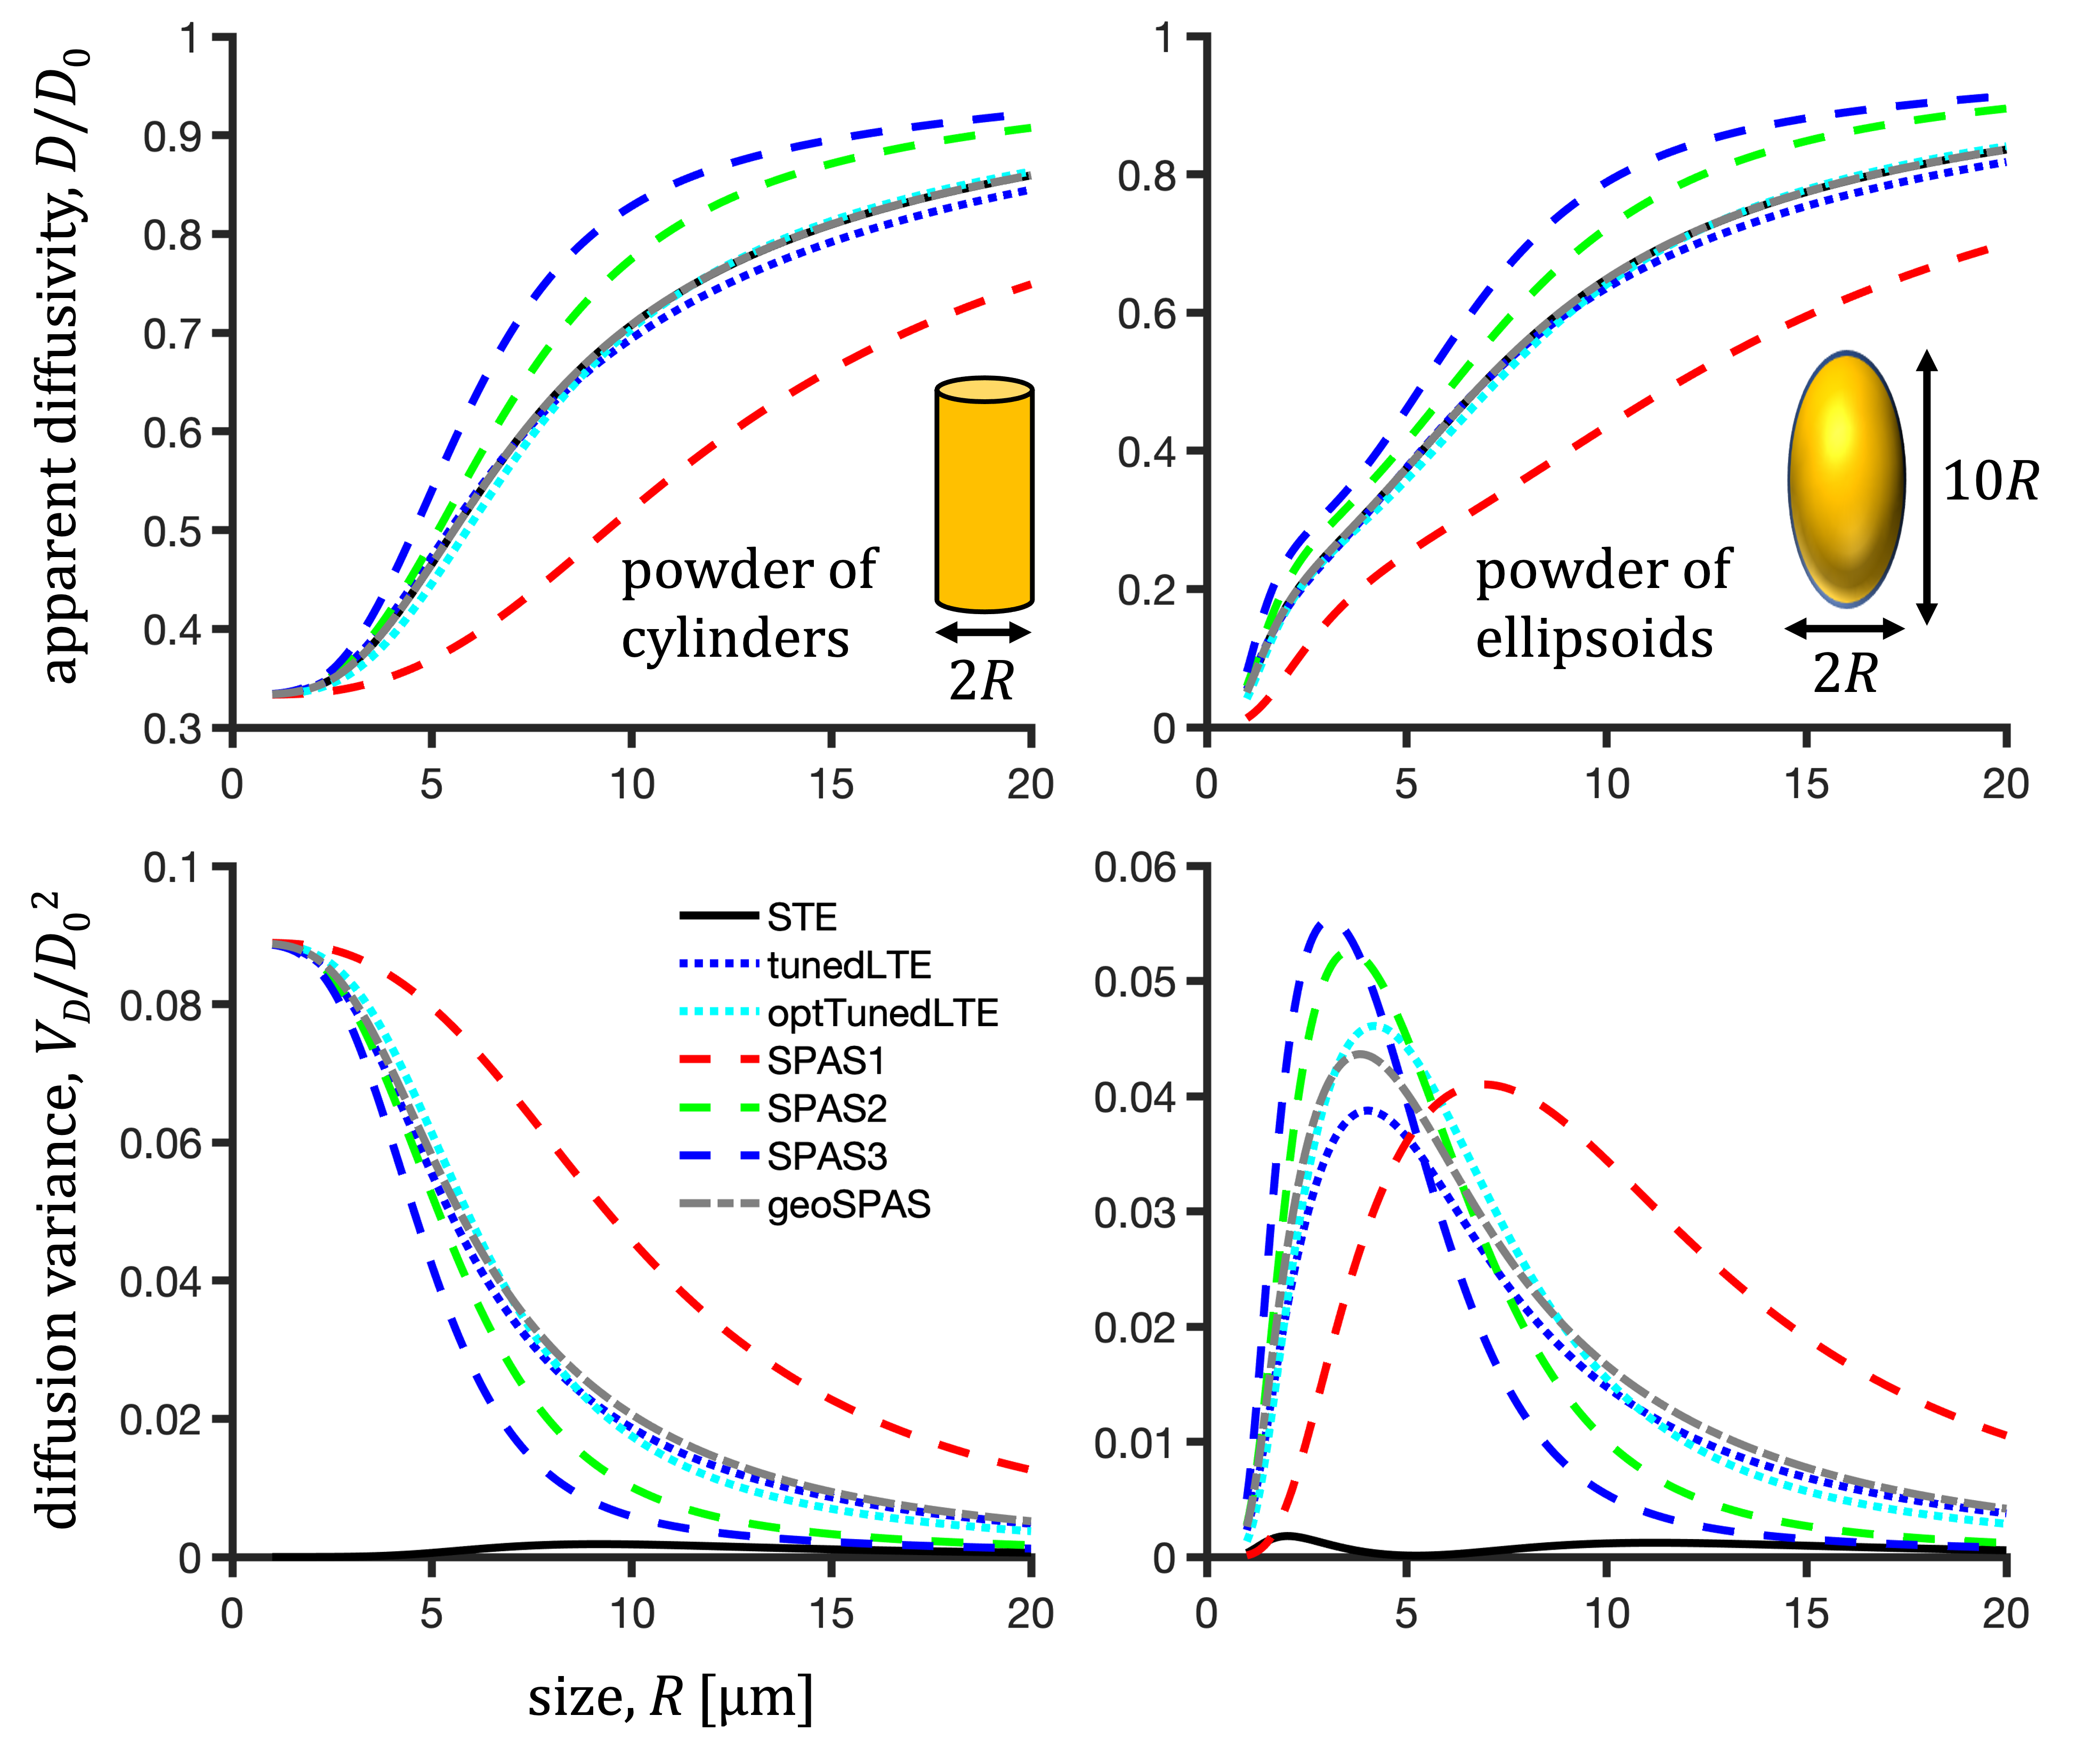
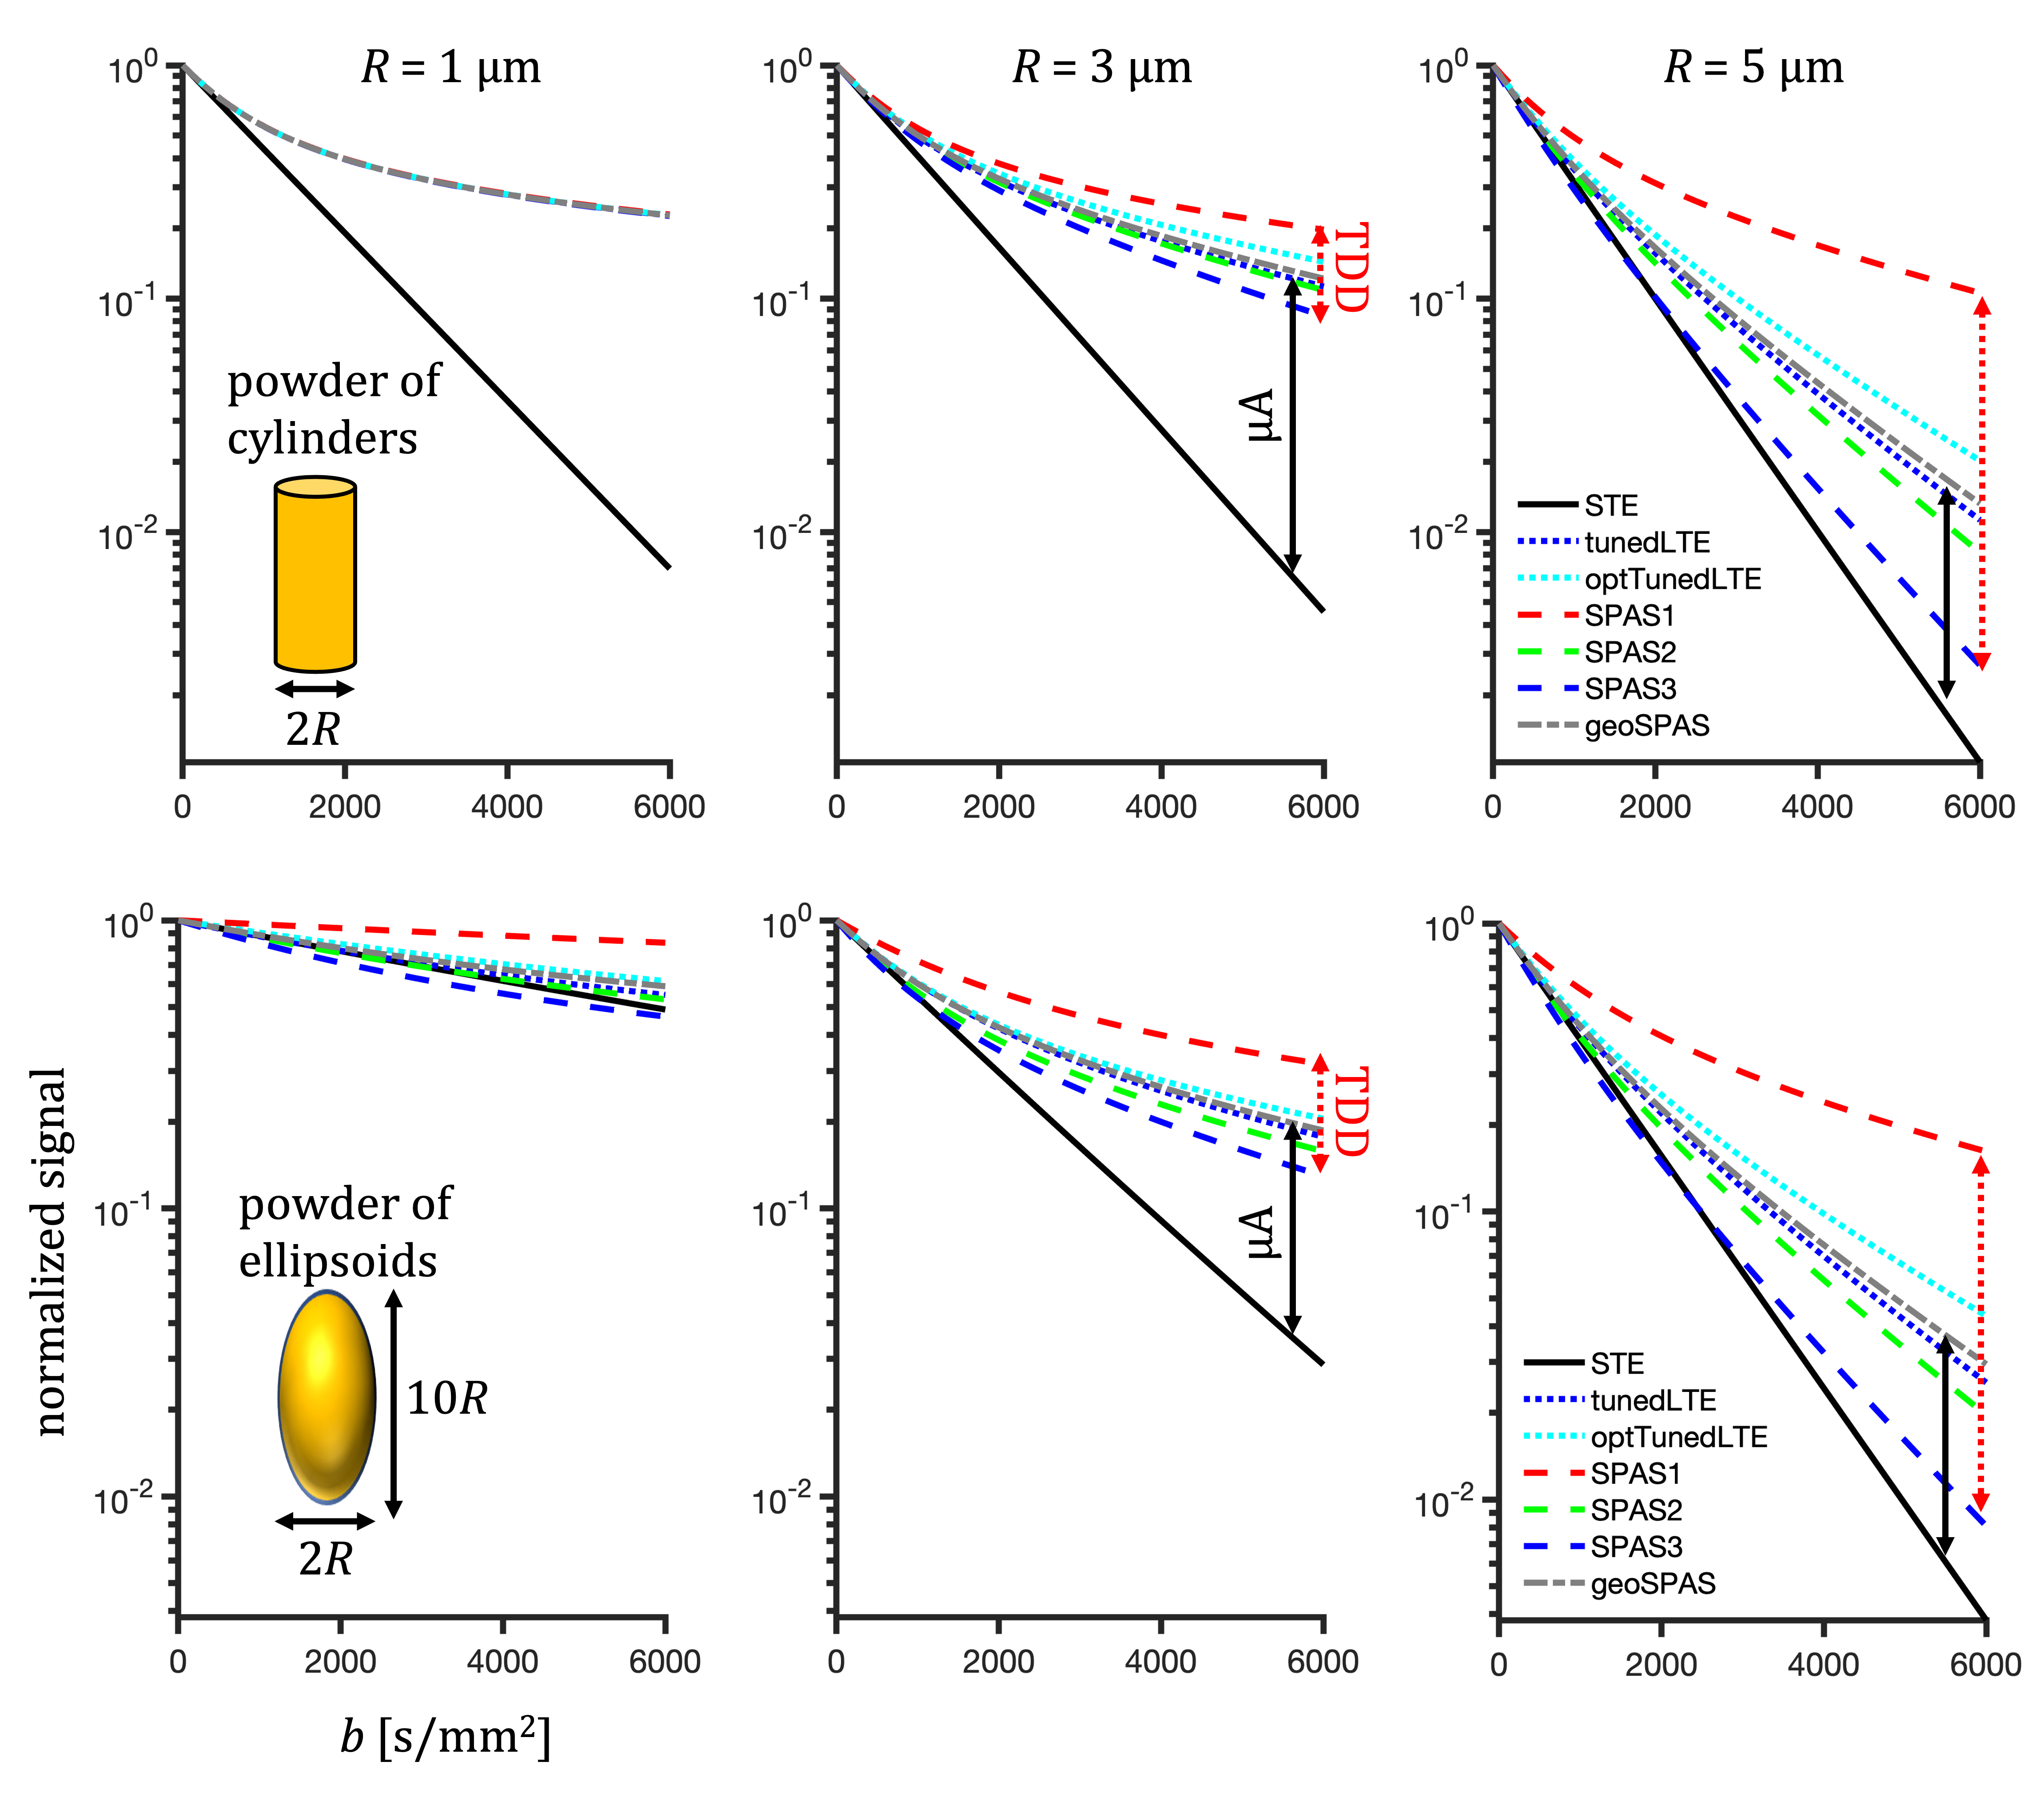
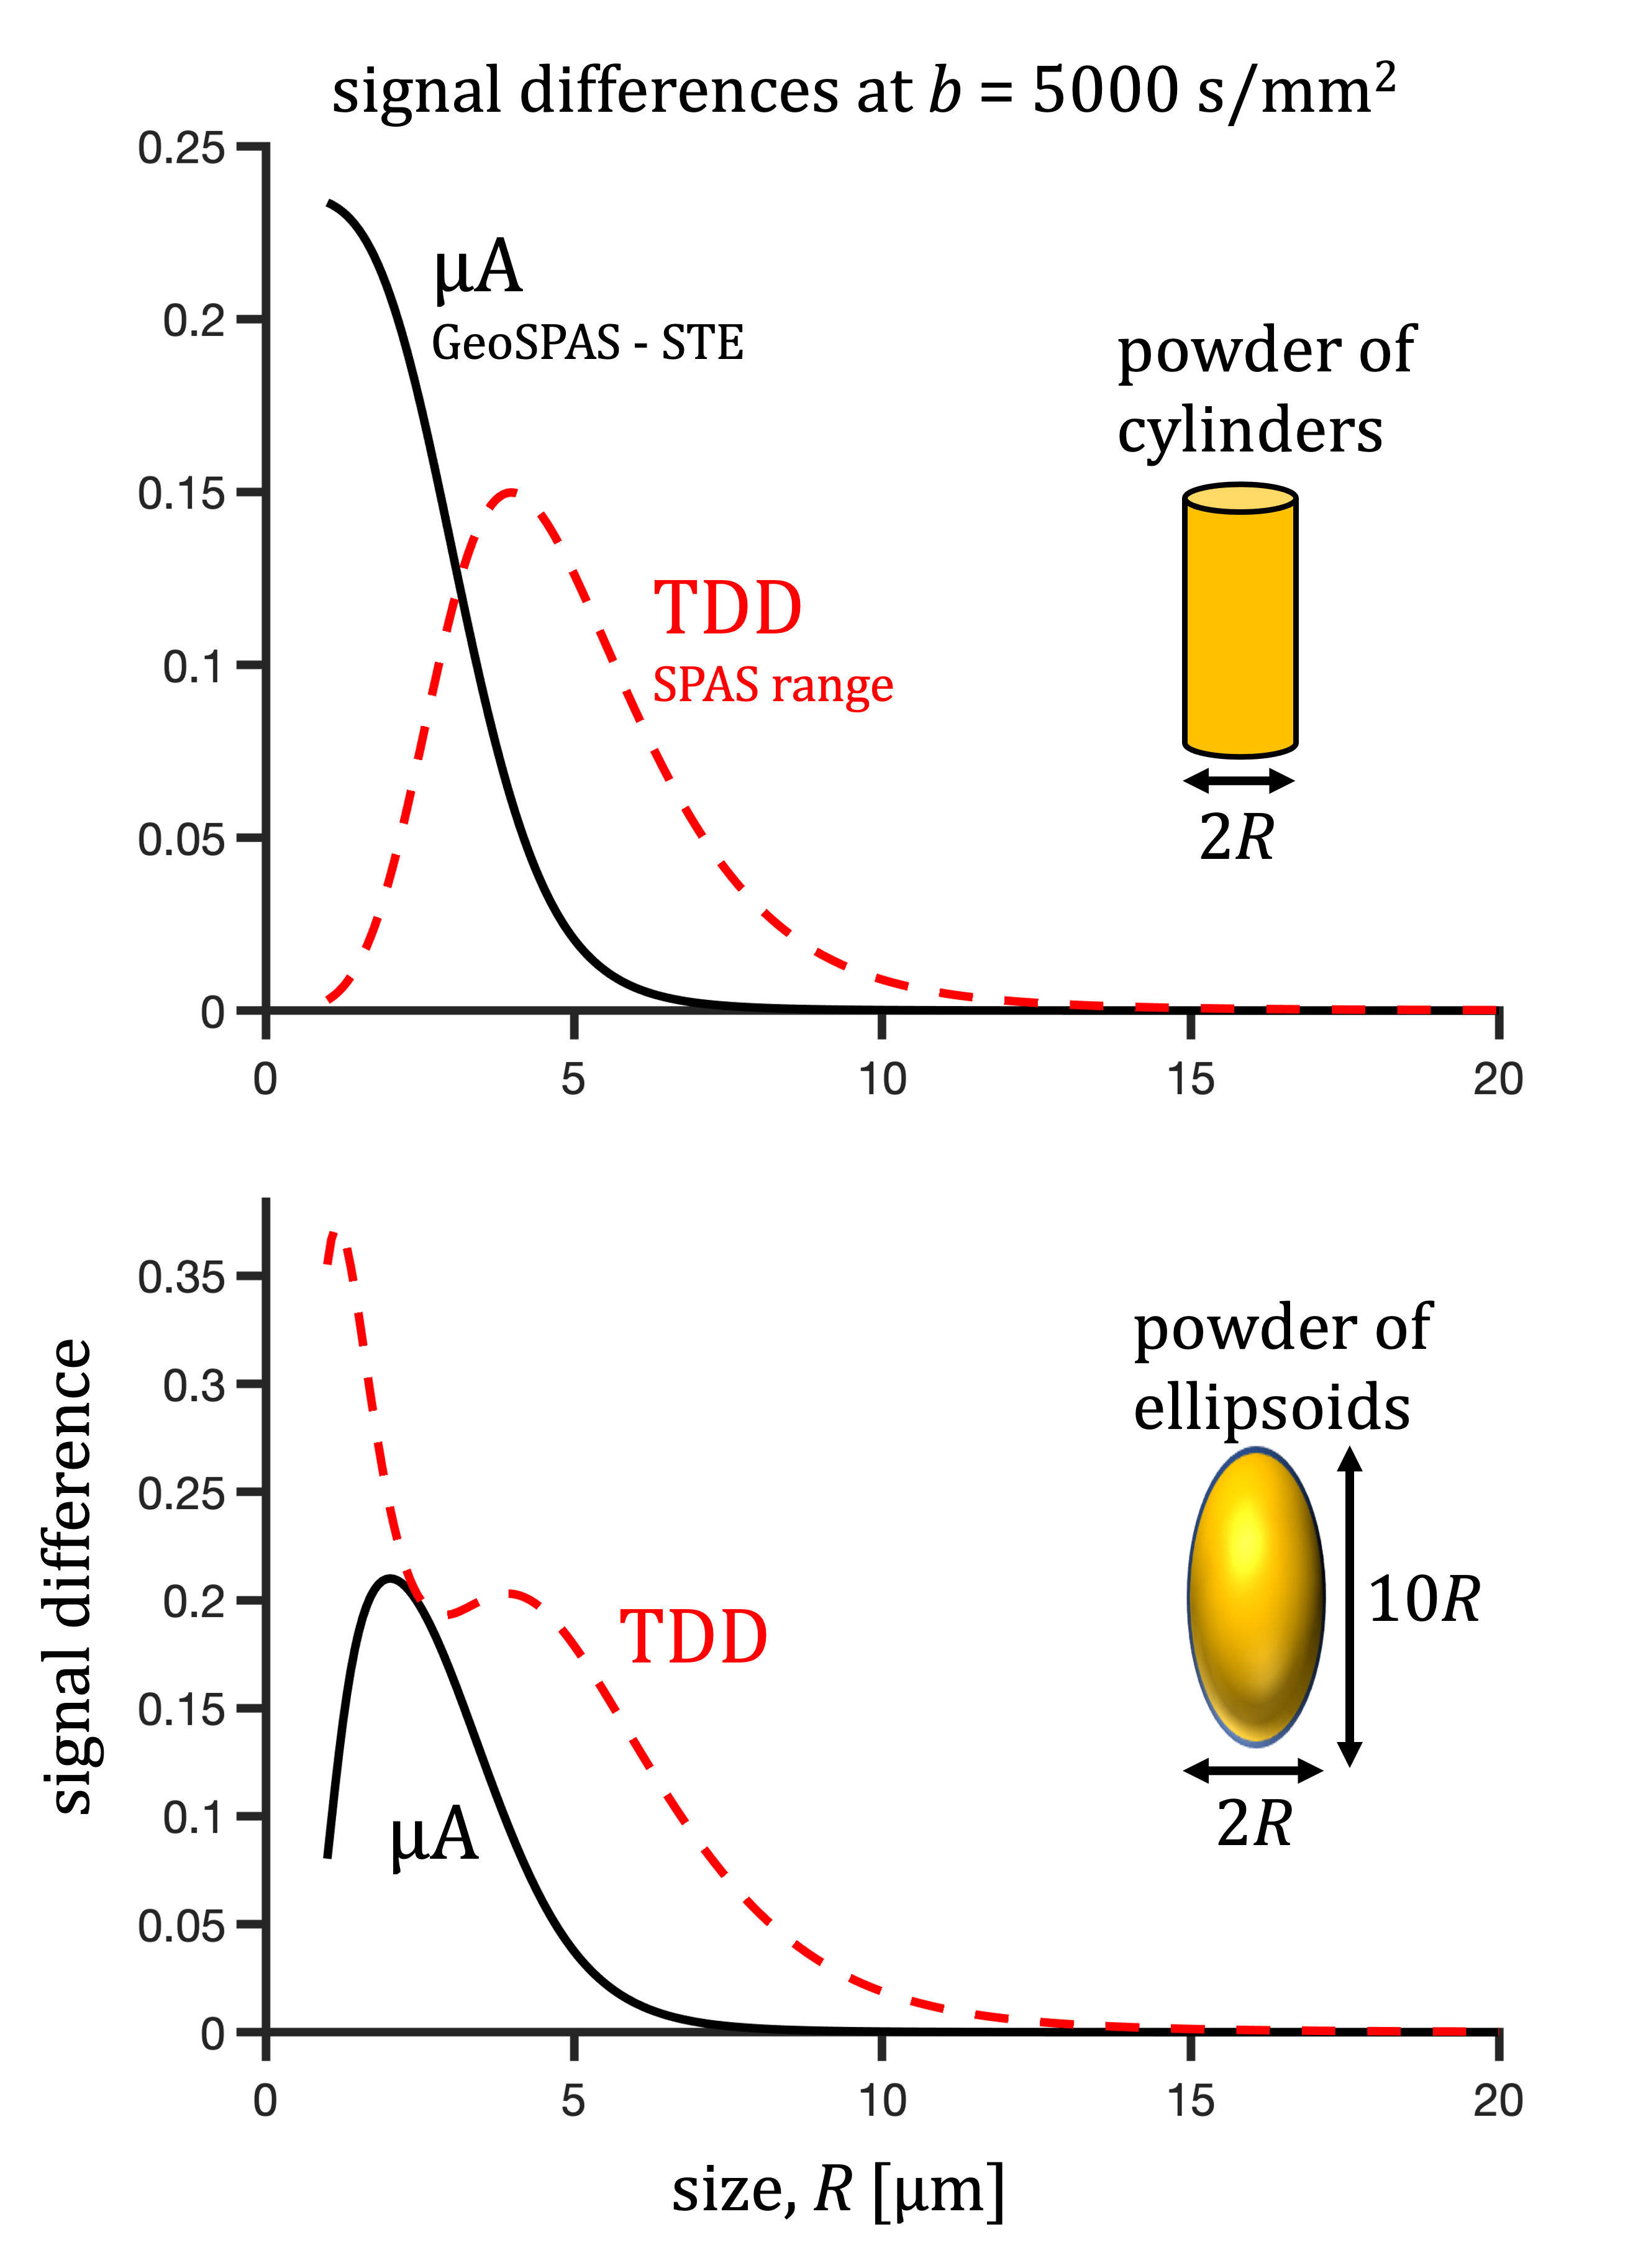
STE (Fig. 1) was generated with an open-source numerical optimization of gradient waveforms (NOW) (https://github.com/filip-szczepankiewicz/NOW)24,25. 1000 noncolinear projections are used with color weights given by the encoding power within frequency bands determined by the $$$b(\omega)$$$ reaching 1/3 and 2/3 of total power $$$b$$$ (Fig. 2A). The low-frequency band is used to obtain the SPAS as eigenvectors of the low-frequency filtered b-tensor26. For tuning, $$b\,D_{\mathbf{u}} = \frac{1}{\pi}\int_{0}^{\infty}s_{\mathbf{u}}(\omega) \,D_\text{sph}(\omega)\,d\omega$$ was used, where $$$ D_\text{sph}(\omega)$$$ was calculated for spheres with $$$D_0^2R^{-4}$$$ of 4938, 167, 2 $$$\text{s}^{-2}$$$. Relative tuning, $$$ D_{\mathbf{u}}/\text{MD}$$$ for the medium restriction size was used to determine the Tuned and optTuned LTEs, where the later one was selected from the 10% best tuned projections with lowest value of $$$|g_\mathbf{u}|_\text{max} \, |\dot{g}_\mathbf{u}|_\text{max}$$$. For the various waveforms (Fig. 1), $$$D$$$ were calculated for powders of cylinders and ellipsoids with varying sizes and 1000 noncolinear rotations to obtain mean and variance results (Fig. 3). The geoSPAS results represent the geometric average from the SPAS LTEs. Signals were calculated by averaging mono-exponential attenuations (Figs. 4,5).Results and discussion
The suggested tuning could be applied to different TDD conditions including restricted diffusion and incoherent flow. For restricted diffusion, the results indicate a robust tuning to STE (see different tuning contours in Fig. 2A). Different projections along the tuning contours could be selected for "optimized" waveform properties, such as gradient magnitude and slew rate27 (Fig. 2B). Contour lines in Fig. 2A are tinted with cyan for smaller values of the product $$$|g_\mathbf{u}|_\text{max} \, |\dot{g}_\mathbf{u}|_\text{max}$$$ and with white for ideal tuning with $$$D_{\mathbf{u}}=\text{MD}$$$.Projections along the SPAS26 reflect spectral anisotropy of STE18 and maximize the TDD sensitivity range. As indicated by calculations (Figs. 3 and 4), geometrically averaged SPAS LTE could provide an alternative to the tuned LTEs. The STE and SPAS LTEs could be used to disentangle effects of microscopic anisotropy1-8 and TDD (Fig. 5).
While exact correspondence between the tuned and GeoSPAS LTEs is not expected at high b-values, our preliminary calculations indicate that the mismatch is not expected to be significant. Experimental implementation does however require further considerations, such as the effects of background and crusher gradients, and the higher hardware demands of the SPAS encoding.
Conclusion
Tuning TDD effects in tensor-valued encoding is desired for unbiased microstructure assessments. The suggested tuning strategy could provide further specificity by disentangling effects of anisotropy and TDD. LTE could be optimized for different hardware constraints on expense of some tuning. When hardware permits, the SPAS waveforms could substitute tuned LTE and provide additional sensitivity to TDD. Experimental implementation will be the subject of future work.Acknowledgements
This project was funded by the European Research Council (ERC) under the European Union’s Horizon 2020 research and innovation programme (grant agreement No 804746). SL is supported also by Random Walk Imaging.References
1. Lasič, S., Szczepankiewicz, F., Eriksson, S., Nilsson, M. & Topgaard, D. Microanisotropy imaging: quantification of microscopic diffusion anisotropy and orientational order parameter by diffusion MRI with magic-angle spinning of the q-vector. Front. Phys. 2, 1–14 (2014).
2. Szczepankiewicz, F. et al. Quantification of microscopic diffusion anisotropy disentangles effects of orientation dispersion from microstructure: applications in healthy volunteers and in brain tumors. Neuroimage 104, 241–52 (2015).
3. Westin, C.-F. et al. Q-space trajectory imaging for multidimensional diffusion MRI of the human brain. Neuroimage 135, 345–362 (2016).
4. Szczepankiewicz, F. et al. The link between diffusion MRI and tumor heterogeneity: Mapping cell eccentricity and density by diffusional variance decomposition (DIVIDE). Neuroimage 142, 522–532 (2016).
5. Topgaard, D. Multidimensional diffusion MRI. J. Magn. Reson. 275, 98–113 (2017).
6. Topgaard, D. NMR methods for studying microscopic diffusion anisotropy. in Diffusion NMR of confined systems: fluid transport in porous solids and heterogeneous materials, New Developments in NMR no. 9 (ed. Valiullin, R.) (Royal Society of Chemistry, 2017).
7. Topgaard, D. Diffusion tensor distribution imaging. NMR Biomed. 32, 1–12 (2019).
8. Nilsson, M. et al. Tensor-valued diffusion MRI in under 3 minutes: an initial survey of microscopic anisotropy and tissue heterogeneity in intracranial tumors. Magn. Reson. Med. 83, 608–620 (2020).
9. de Almeida Martins, J. P. et al. Computing and visualising intra-voxel orientation-specific relaxation–diffusion features in the human brain. Hum. Brain Mapp. 1–19 (2020). doi:10.1002/hbm.25224
10. Jespersen, S. N., Lundell, H., Sønderby, C. K. & Dyrby, T. B. Orientationally invariant metrics of apparent compartment eccentricity from double pulsed field gradient diffusion experiments. NMR Biomed. 26, 1647–1662 (2013).
11. Woessner, D. E. N.M.R. spin-echo self-diffusion measurements on fluids undergoing restricted diffusion. J. Phys. Chem. 67, 1365–1367 (1963).
12. Stejskal, E. O. & Tanner, J. E. Spin Diffusion Measurements: Spin Echoes in the Presence of a Time-Dependent Field Gradient. J. Chem. Phys. 42, 288 (1965).
13. Latour, L. L., Svoboda, K., Mitra, P. P. & Sotak, C. H. Time-dependent diffusion of water in a biological model system. Proc. Natl. Acad. Sci. U. S. A. 91, 1229–1233 (1994).
14. Stepišnik, J. Time-dependent self-diffusion by NMR spin-echo. Phys. B 183, 343–350 (1993).
15. Parsons, E. C., Does, M. D. & Gore, J. C. Modified oscillating gradient pulses for direct sampling of the diffusion spectrum suitable for imaging sequences. Magn. Reson. Imaging 21, 279–285 (2003).
16. Lundell, H., Sønderby, C. K. & Dyrby, T. B. Diffusion weighted imaging with circularly polarized oscillating gradients. Magn. Reson. Med. 73, 1171–1176 (2015).
17. Lundell, H. et al. Multidimensional diffusion MRI with spectrally modulated gradients reveals unprecedented microstructural detail. Sci. Rep. 9, 1–12 (2019).
18. Lundell, H. & Lasič, S. Diffusion Encoding with General Gradient Waveforms. in Advanced Diffusion Encoding Methods in MRI: New Developments in NMR Volume 24 (ed. Topgaard, D.) 12–67 (Royal Society of Chemistry, 2020). doi:10.1039/9781788019910-00012
19. Lasič, S., Lundell, H. & Topgaard, D. The tuned trinity of b-tensors. in Proc. Intl. Soc. Mag. Reson. Med. 27 3490 (2019).
20. Lasic, S. et al. Time-dependent and anisotropic diffusion in the heart: linear and spherical tensor encoding with varying degree of motion compensation. in Proc. 28th Intl. Soc. Magn. Reson. Med. 4300 (2020).
21. Lasic, S. et al. Time-dependent anisotropic diffusion in the mouse heart: feasibility of motion compensated tensor-valued encoding on a 7T preclinical scanner. in Proc. 29th Intl. Soc. Magn. Reson. Med. 3651 (2021).
22. De Swiet, T. M. & Mitra, P. P. Possible Systematic Errors in Single-Shot Measurements of the Trace of the Diffusion Tensor. J. Magn. Reson. Ser. B 111, 15–22 (1996).
23. Jespersen, S. N., Olesen, J. L., Ianuş, A. & Shemesh, N. Effects of nongaussian diffusion on “isotropic diffusion” measurements: An ex-vivo microimaging and simulation study. J. Magn. Reson. 300, 84–94 (2019).
24. Sjölund, J. et al. Constrained optimization of gradient waveforms for generalized diffusion encoding. J. Magn. Reson. 261, 157–168 (2015).
25. Szczepankiewicz, F. & Sjölund, J. Cross-term-compensated gradient waveform design for tensor-valued diffusion MRI. J. Magn. Reson. 328, 106991 (2021).
26. Lasic, S., Szczepankiewicz, F., Nilsson, M., Dyrby, T. B. & Lundell, H. The spectral tilt plot (STP) – new microstructure signatures from spectrally anisotropic b-tensor encoding. in Proc. 29th Intl. Soc. Magn. Reson. Med. 0297 (2021). doi:10.1002/mrm.27959
27. Szczepankiewicz, F., Westin, C. F. & Nilsson, M. Gradient waveform design for tensor-valued encoding in diffusion MRI. J. Neurosci. Methods 348, 109007 (2021).
Figures