2508
Quantification of microvascular properties of gliomas using DSC – Hybrid EPI based MR Vascular Fingerprinting compared with Vessel Size Imaging1Radiology and Nuclear Medicine, Erasmus MC, Rotterdam, Netherlands, 2Radiology, Leiden University Medical Center, Leiden, Netherlands, 3Medical Imaging, TU Delft, Delft, Netherlands
Synopsis
This study uses an MRVF approach to analyze the time evolution of a DSC hybrid -EPI (HEPI) sequence that simultaneously acquires gradient and spin echo images. HEPI properties are incorporated from the scanner into simulations including contrast agent extravasation, diffusion, and MR signal evolution and for varying the outcome parameters: CBV, mean vessel-size, and leakage. In vivo data of six glioma patients are used to compare MRVF output maps to those obtained from conventional VSI modelling. The results show reasonable agreement. Also, the noise sensitivity of both techniques was investigated.
INTRODUCTION
Perfusion parameters derived from Dynamic Susceptibility Contrast (DSC) MRI are increasingly utilized as image-based biomarkers for management of patients with glioma1. Of particular interest is relative cerebral blood volume (rCBV), which is the most widely used parameter for predicting tumor grade and has the potential to predict overall survival of glioma patients2. Hybrid EPI (HEPI)3 is a fast acquisition technique that combines gradient (GRE) and spin echo (SE) read-outs which are sensitive to all vessels (micro and macro) and only microvasculature, respectively. Using HEPI for DSC imaging can therefore provide additional information of blood vessel architecture, including estimates of vessel radius (R)4. To disentangle R and rCBV, a vascular fingerprinting5 (MRVF) approach based on DSC HEPI acquisition is proposed in this work. Quantitative information retrieved about the underlying microvasculature of glioma using a HEPI dictionary specific for the DSC technique is compared with those obtained using conventional Vessel Size Imaging (VSI) processing6. To test the hypothesis that MRVF is more robust to noise than VSI, R and rCBV are estimated after adding noise to the raw in-vivo data.METHODS
HEPI-DSC images were acquired at 3T (MR750, GE) from 6 patients with confirmed diagnosis of glioma (Table 1). Dynamic images (TR/TEGRE/TESE 1.5s/20ms/70ms, 15 slices) were acquired during bolus injection of 7.5ml of GBCA (Gadovist, Bayer, GE) after a preload of equal size7,8. We imported the HEPI sequence as played out on the scanner into a simulation (DCESim) tool9 that simulates CA extravasation, diffusion, and MR signal. A dictionary was created by simulating a 2D voxel with 5 vessels having 10, 50 and 40 logarithmically spaced values of permeability (k) [0, 7*10-3] s-1, R [5, 150] µm and rCBV [0.5, 10]% respectively9,10. For each dictionary atom the simulation included a time range of 400s to cover pre-bolus and delay, followed by 100s of the main bolus and HEPI-acquisition. The dictionary was matched to the patient data using a separate scaling factor for the GRE and SE parts to compensate for baseline signal differences between dictionary and in-vivo signals. The vessel parameters corresponding to the match from the dictionary to the data are retrieved. Conventional VSI modelling to obtain rCBV and R maps was done after conversion of GRE & SE time courses into changes in transverse relaxation rates over time6. Here, leakage correction was included as previously described11. Structural Similarity Index Measure (SSIM) was used to assess the similarity between the corresponding parameter maps obtained using MRVF and VSI. To perform noise analysis, independent Gaussian random noise was added to three of the patient datasets and the absolute percentage difference was calculated as error measure.RESULTS
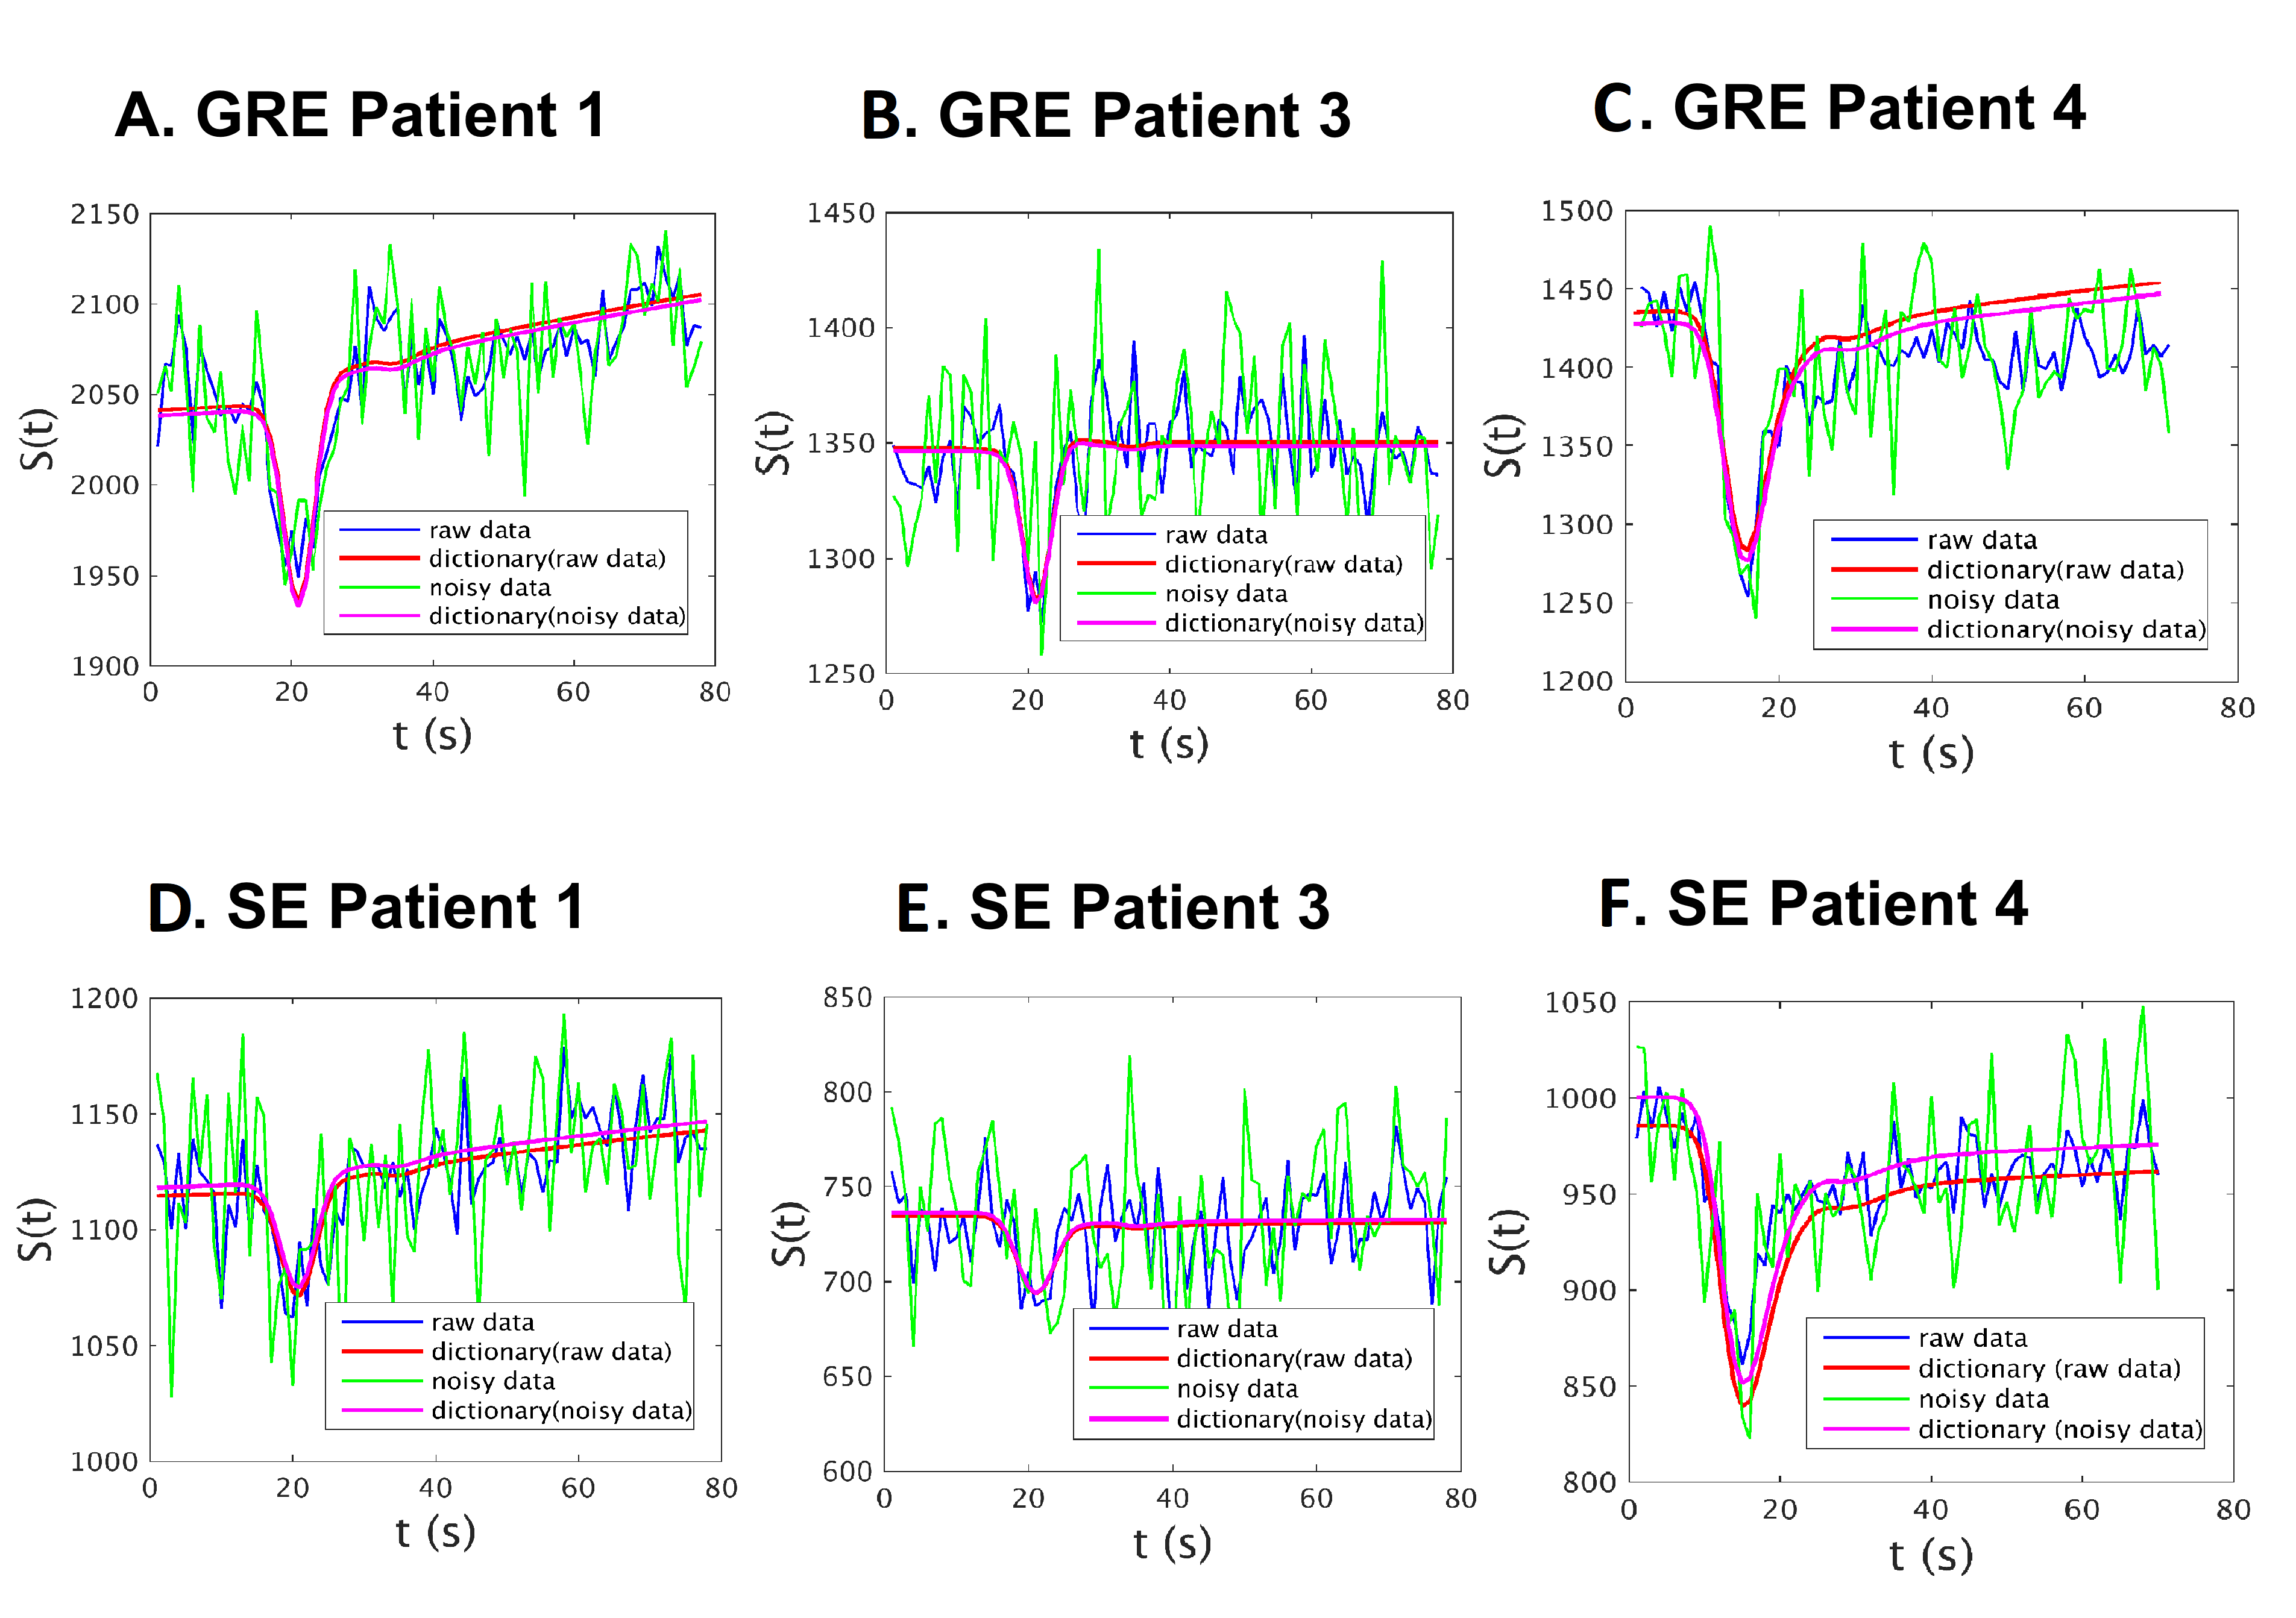
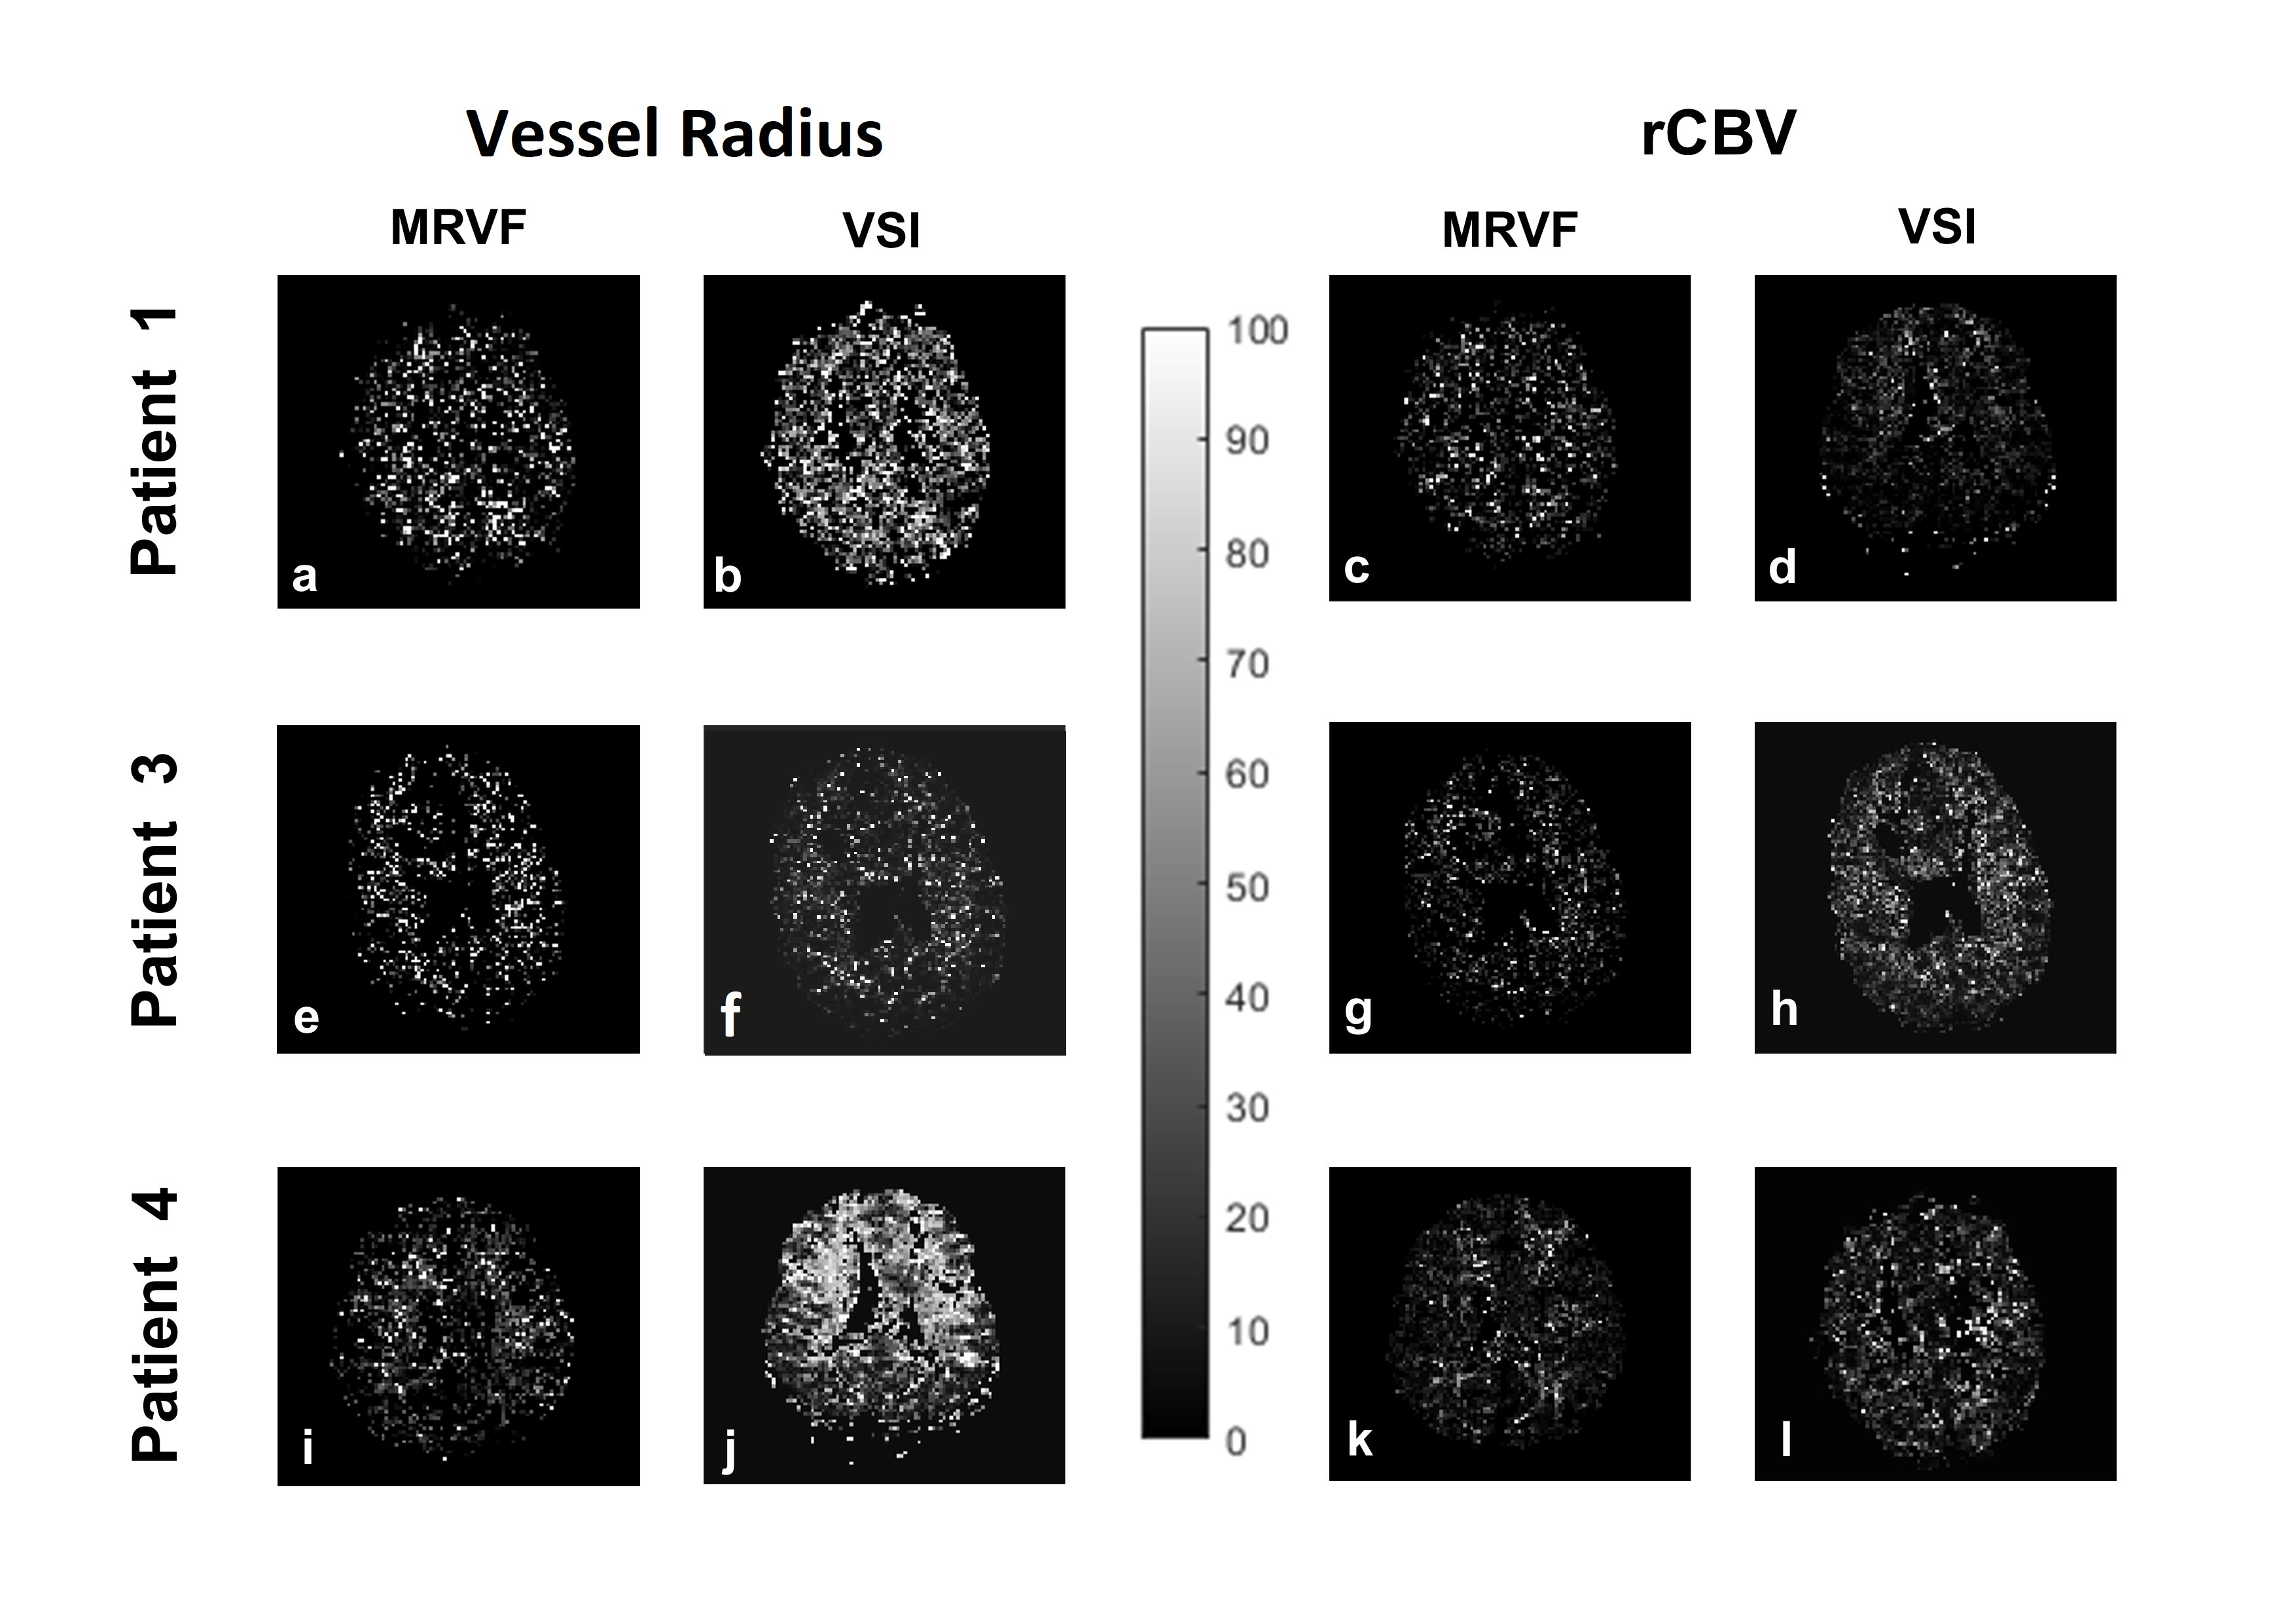
The vessel parameters of the dictionary match to the in-vivo data are shown in Table 1 for a representative voxel within the tumor region for each of the datasets. Non-zero permeability values were obtained only for the enhancing tumor voxels as seen on T1-Gd. Figure 1 shows for each patient a representative T2 FLAIR image with the R and rCBV parametric maps obtained using the two methods. It is observed that both techniques show similar patterns, although the tumor rCBV in patient 3 is more hyper-intense for MRVF than for VSI. R estimates are comparatively noisy in MRVF maps due to very small differences in the HEPI signals simulated for varying R above 70µm. The SSIM values are shown in Table 1, illustrating that both the techniques are similar as concluded from the moderate to high SSIM-values. Figure 2 shows GRE (A,B,C) and SE (D,E,F) signals for a representative tumor voxel in three of the datasets, before and after adding noise, and their corresponding dictionary match. R and rCBV maps were also estimated using both the techniques from the noisy data. They were compared with the corresponding maps from the raw in-vivo data by evaluating the percentage error values between them which are shown in Figure 3. Low percentage error values were obtained for the rCBV maps in both the techniques, while the difference values for R were comparatively higher for VSI compared to MRVF.DISCUSSION
The proposed DSC-HEPI based fingerprinting approach retrieves quantitative information on microvasculature of gliomas with the advantage of acquiring a single time course during passage of a bolus of contrast agent compared to the conventional MRVF based on pre- and post-contrast asymmetric spin-echo data5. Time-course data show good correspondence between dictionary and in-vivo data. We compared the quantitative maps of R and rCBV from MRVF to VSI values and found similar patterns, although some differences should be noted. In the experiments MRVF and VSI appeared to be robust against noise in estimating rCBV, while the apparent improved robustness of MRVF in estimating R needs to be further studied.Acknowledgements
No acknowledgement found.References
1. Shiroishi, Mark S., et al. "Principles of T2*‐weighted dynamic susceptibility contrast MRI technique in brain tumor imaging." Journal of Magnetic Resonance Imaging 41.2 (2015): 296-313.
2. Calamante, Fernando, et al. "Measuring cerebral blood flow using magnetic resonance imaging techniques." Journal of cerebral blood flow & metabolism 19.7 (1999): 701-735.
3. P. F. Ferreira, P. D. Gatehouse, and D. N. Firmin, “Myocardial first-pass perfusion imaging with hybrid-EPI: Frequency-offsets and potential artefacts,” J. Cardiovasc. Magn. Reson., 2012, doi: 10.1186/1532-429X-14-44.
4. Troprès, I. et al. Vessel size imaging. Magn. Reson. Med. 45, 397–408 (2001).
5. Christen, Thomas, et al. "MR vascular fingerprinting: A new approach to compute cerebral blood volume, mean vessel radius, and oxygenation maps in the human brain." Neuroimage 89 (2014): 262-270.
6. E. Kellner et al., “MR evaluation of vessel size imaging of human gliomas: Validation by histopathology,” J. Magn. Reson. Imaging, 2015, doi: 10.1002/jmri.24864
7. S. R. van der Voort et al., “Predicting the 1p/19q codeletion status of presumed low-grade glioma with an externally validated machine learning algorithm,” Clin. Cancer Res., 2019, doi: 10.1158/1078-0432.CCR-19-1127.
8. Paulson, Eric S., and Kathleen M. Schmainda. "Comparison of dynamic susceptibility-weighted contrast-enhanced MR methods: recommendations for measuring relative cerebral blood volume in brain tumors." Radiology 249.2 (2008): 601-613.
9. Pannetier, Nicolas Adrien, et al. "A simulation tool for dynamic contrast enhanced MRI." PloS one 8.3 (2013): e57636.
10. Beaumont, Marine, et al. "Characterization of tumor angiogenesis in rat brain using iron-based vessel size index MRI in combination with gadolinium-based dynamic contrast-enhanced MRI." Journal of Cerebral Blood Flow & Metabolism 29.10 (2009): 1714-1726.
11. J. L. Boxerman, K. M. Schmainda, and R. M. Weisskoff, “Relative cerebral blood volume maps corrected for contrast agent extravasation significantly correlate with glioma tumor grade, whereas uncorrected maps do not,” Am. J. Neuroradiol., 2006.
Figures
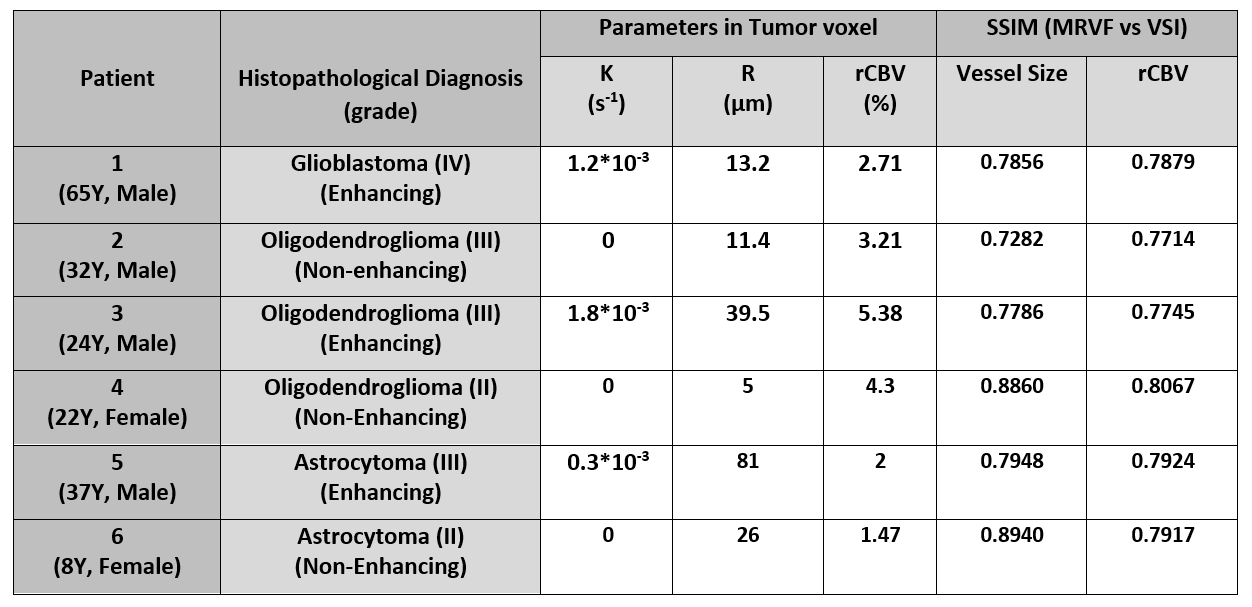
Table 1: Diagnosis of the patient datasets and the vessel parameters, k, R and rCBV values obtained from the match of the HEPI signals in a tumor voxel. The last two columns show the SSIM obtained between MRVF and VSI for R and rCBV maps for each of the dataset.
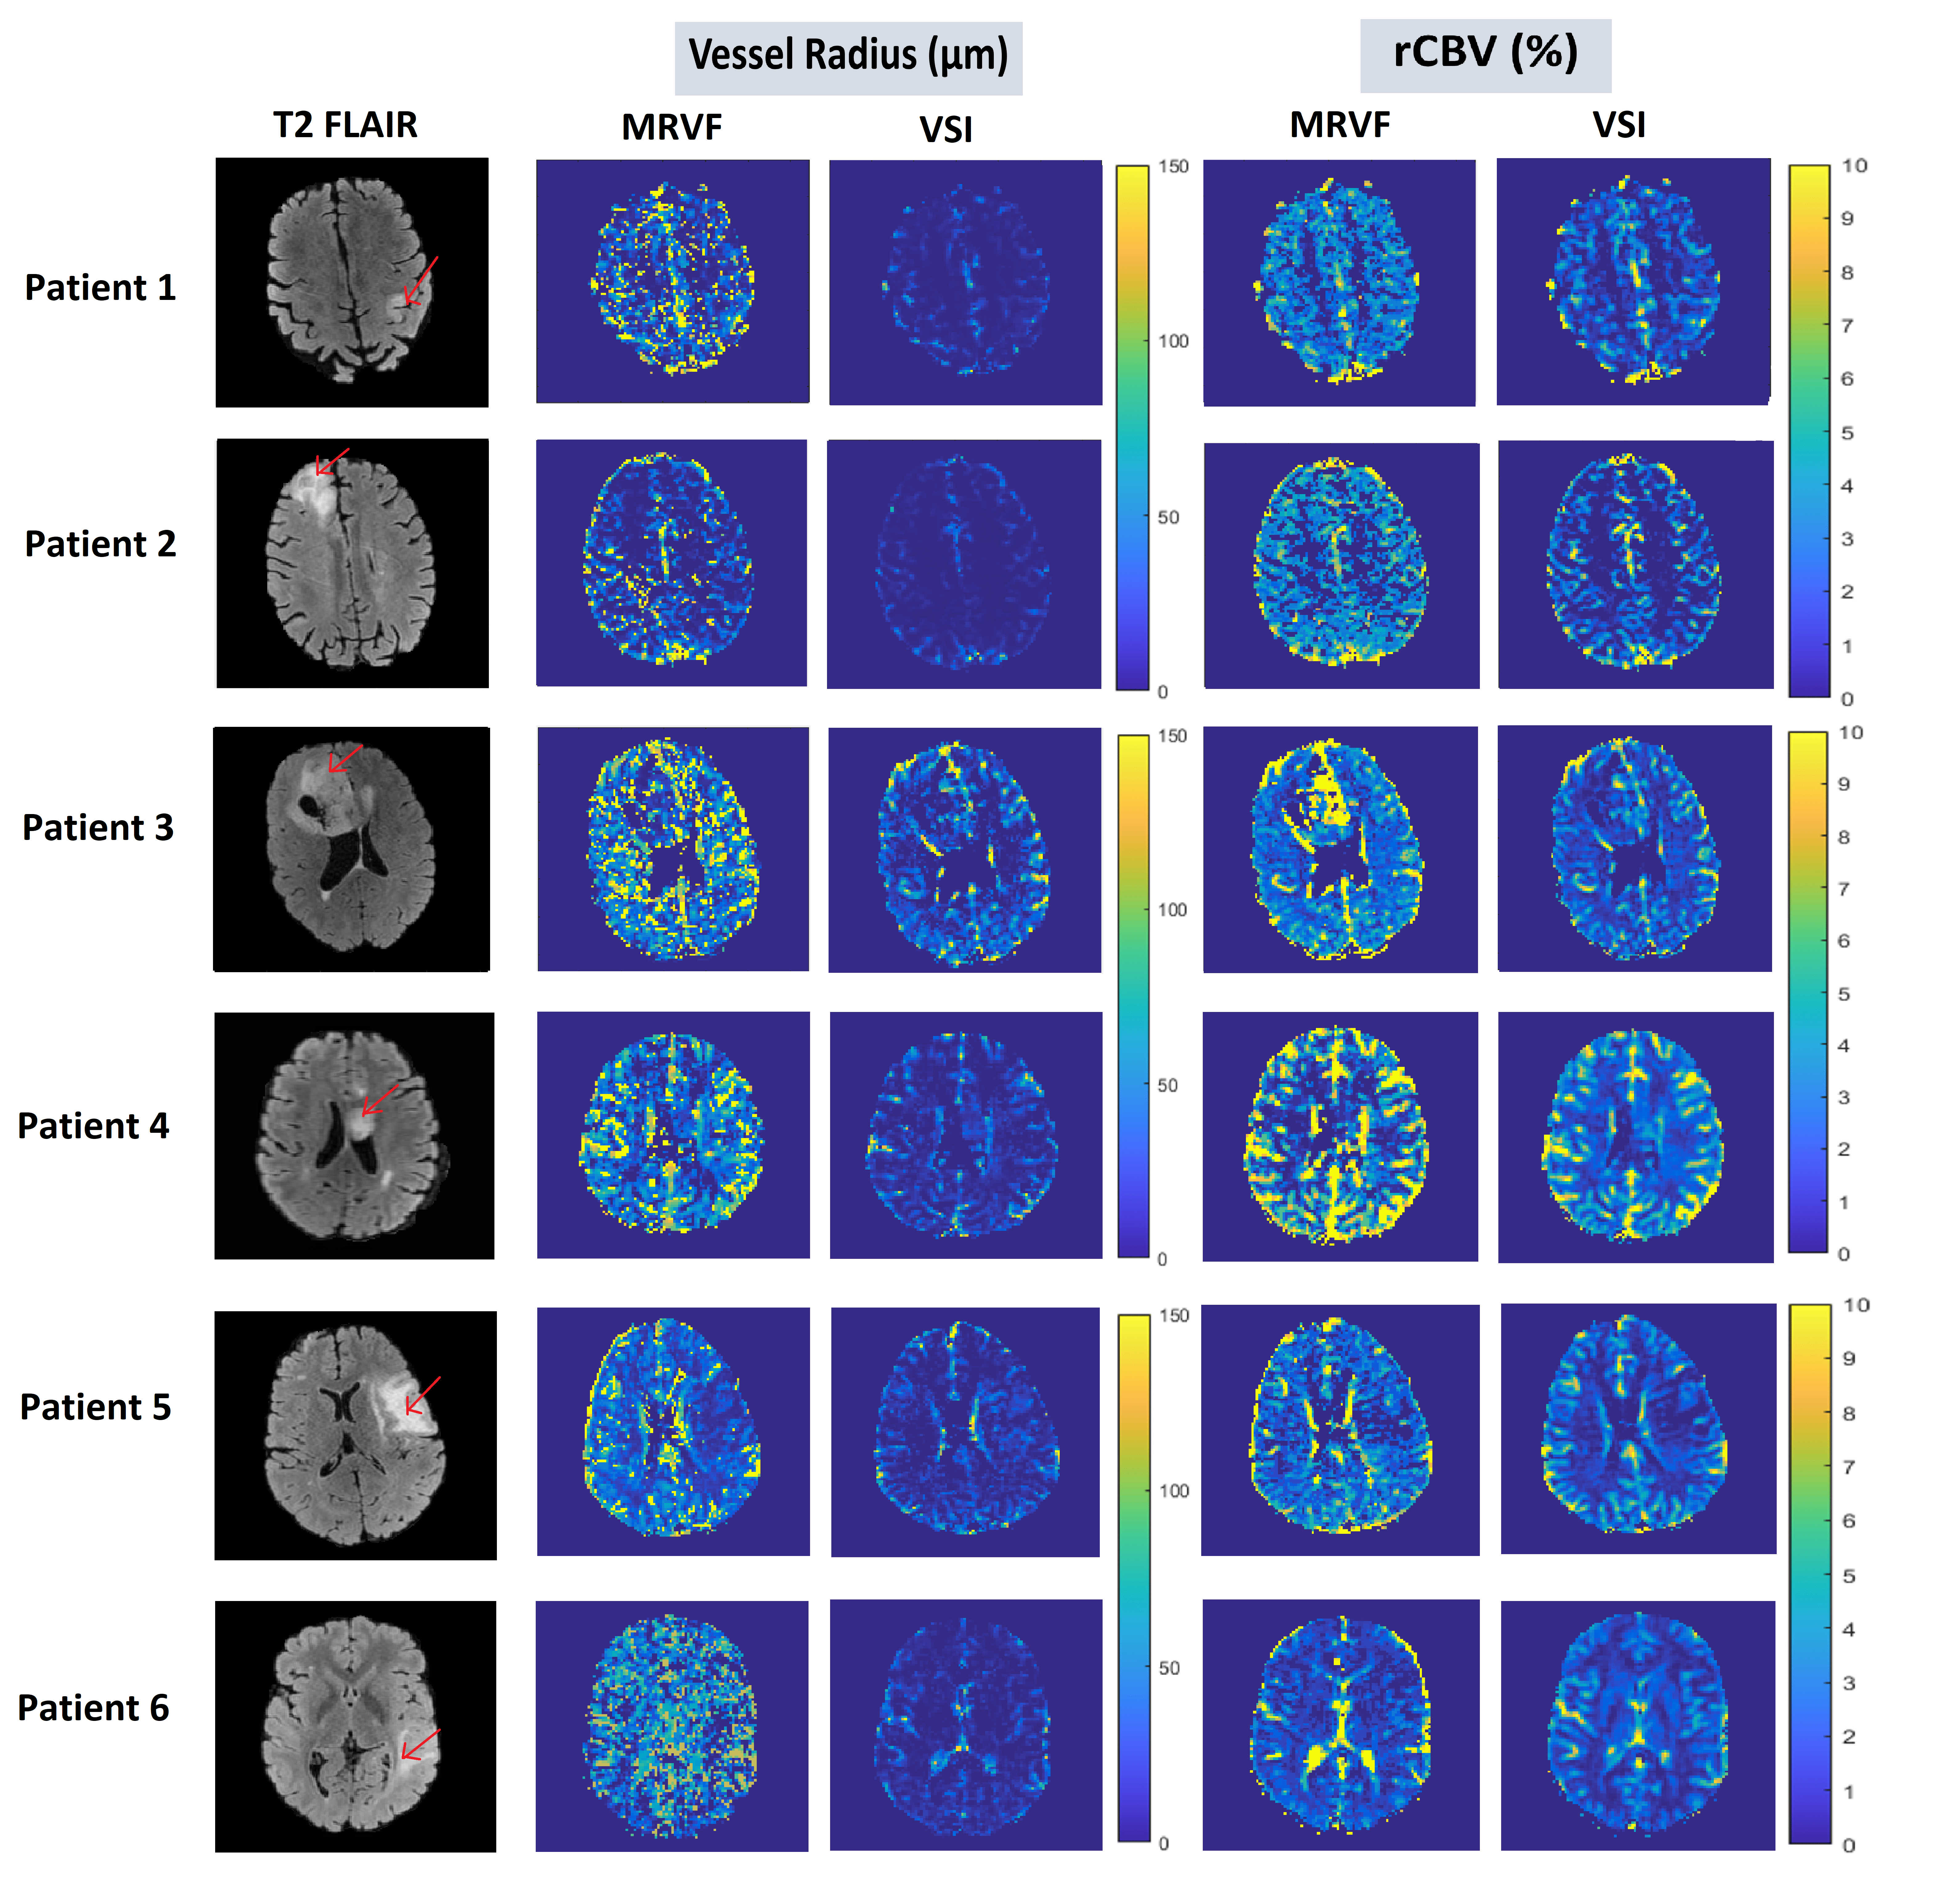
Figure 1: T2 FLAIR images of 6 patient datasets of slices showing the glioma (marked by the red arrows) and the corresponding vessel radius and rCBV maps obtained using the MRVF and the VSI methods.