2502
Inhomogeneous MT (ihMT) MRI in a glioblastoma mouse model1Division of MR Research, Radiology, Beth Israel Deaconess Medical Center, Harvard Medical School, Boston, MA, United States, 2Department of Medicine, Beth Israel Deaconess Medical Center, Harvard Medical School, Boston, MA, United States, 3Sackler School of Graduate Studies, Tufts University School of Medicine, Boston, MA, United States, 4Department of Pathology, Beth Israel Deaconess Medical Center, Harvard Medical School, Boston, MA, United States, 5Cancer Research Institute, Beth Israel Deaconess Medical Center, Harvard Medical School, Boston, MA, United States
Synopsis
Inhomogeneous MT (ihMT) MRI was applied in a genetic mouse model of glioblastoma to assess its potential to provide useful complementary information regarding the true extent of tumor infiltration. Data were acquired to produce maps of MT and ihMT ratios, which were analyzed based on regions of interest relative to brain tissue contralateral to the tumor and progression with time. The tumor was characterized by significantly lower MT and ihMT. Reduction in peripheral white matter ihMT was taken to indicate demyelinating processes associated with glioblastoma. Thus, ihMT might be used to inform on disease progression in tumor adjacent brain tissue.
Introduction
Clinical treatment of glioblastoma usually involves MRI informed and/or guided resection, followed by radio- and chemo-therapy. A challenge lies in ensuring satisfactory resection of all the tumor with minimal excision of otherwise healthy brain tissue. Diffusion MRI has been utilized to improve resection and outcomes based on sensitivity to white matter (WM) tracts1. The majority of WM is composed of heavily myelinated neurons and consequently contains more myelin than gray matter (GM). Myelinated axons are essential for saltatory conduction. Inhomogeneous MT (ihMT) has been validated as a myelin sensitive technique in both WM and GM2, and thus might provide complementary information on tumor extent prior to neurosurgery. In this work, we demonstrate the first application of ihMT for glioblastoma MRI in a genetic mouse model and analyze related metrics in the developing tumor and surrounding brain tissue.Methods
The glioblastoma model was induced in mice (n=3) following stereotactic intracranial injection of a lentivirus that induces overexpression of mutant EGFR-vIII and deletion in Ink4a/Arf and PTEN genes3–5, at day 0. MRI was conducted at day 29 and every 7 days thereafter until mice reached a humane endpoint for euthanasia. Two mice underwent MRI at day 36, and one at day 43. Studies were approved by the local Institutional Animal Care and Use Committee.Data were acquired with an ihMTRAGE sequence6 implemented on 9.4T horizontal-bore scanner (Biospec 94/20, Bruker, USA), and 4-channel mouse brain array coil. Preparations for ihMT experiments were achieved with four, 3ms Tukey MT pulses 3.1ms apart, repeated every 180ms for 1080ms with B1,RMS=6.7 μT. 3D volumes were acquired with the following types of preparation pulses: zero-power, cosine modulated (CM), single positive offset +Δ(=+10kHz), frequency alternating (FA), single negative -Δ, and FA, in a cycle repeated five times. Use of 3ms MT pulses for FA ihMT was employed to improve myelin specificity, while CM ihMT was more sensitive2. FA was acquired twice per cycle to increase SNR, and +Δ and -Δ to account for MT asymmetry7. Parameters for the acquisition that followed were: 0.2mm in-plane; 0.8mm through-plane resolution; TE/TR/TRsegment=2/7/2200ms; 40 readouts per segment for a 3D volume scan time of 46.2s.
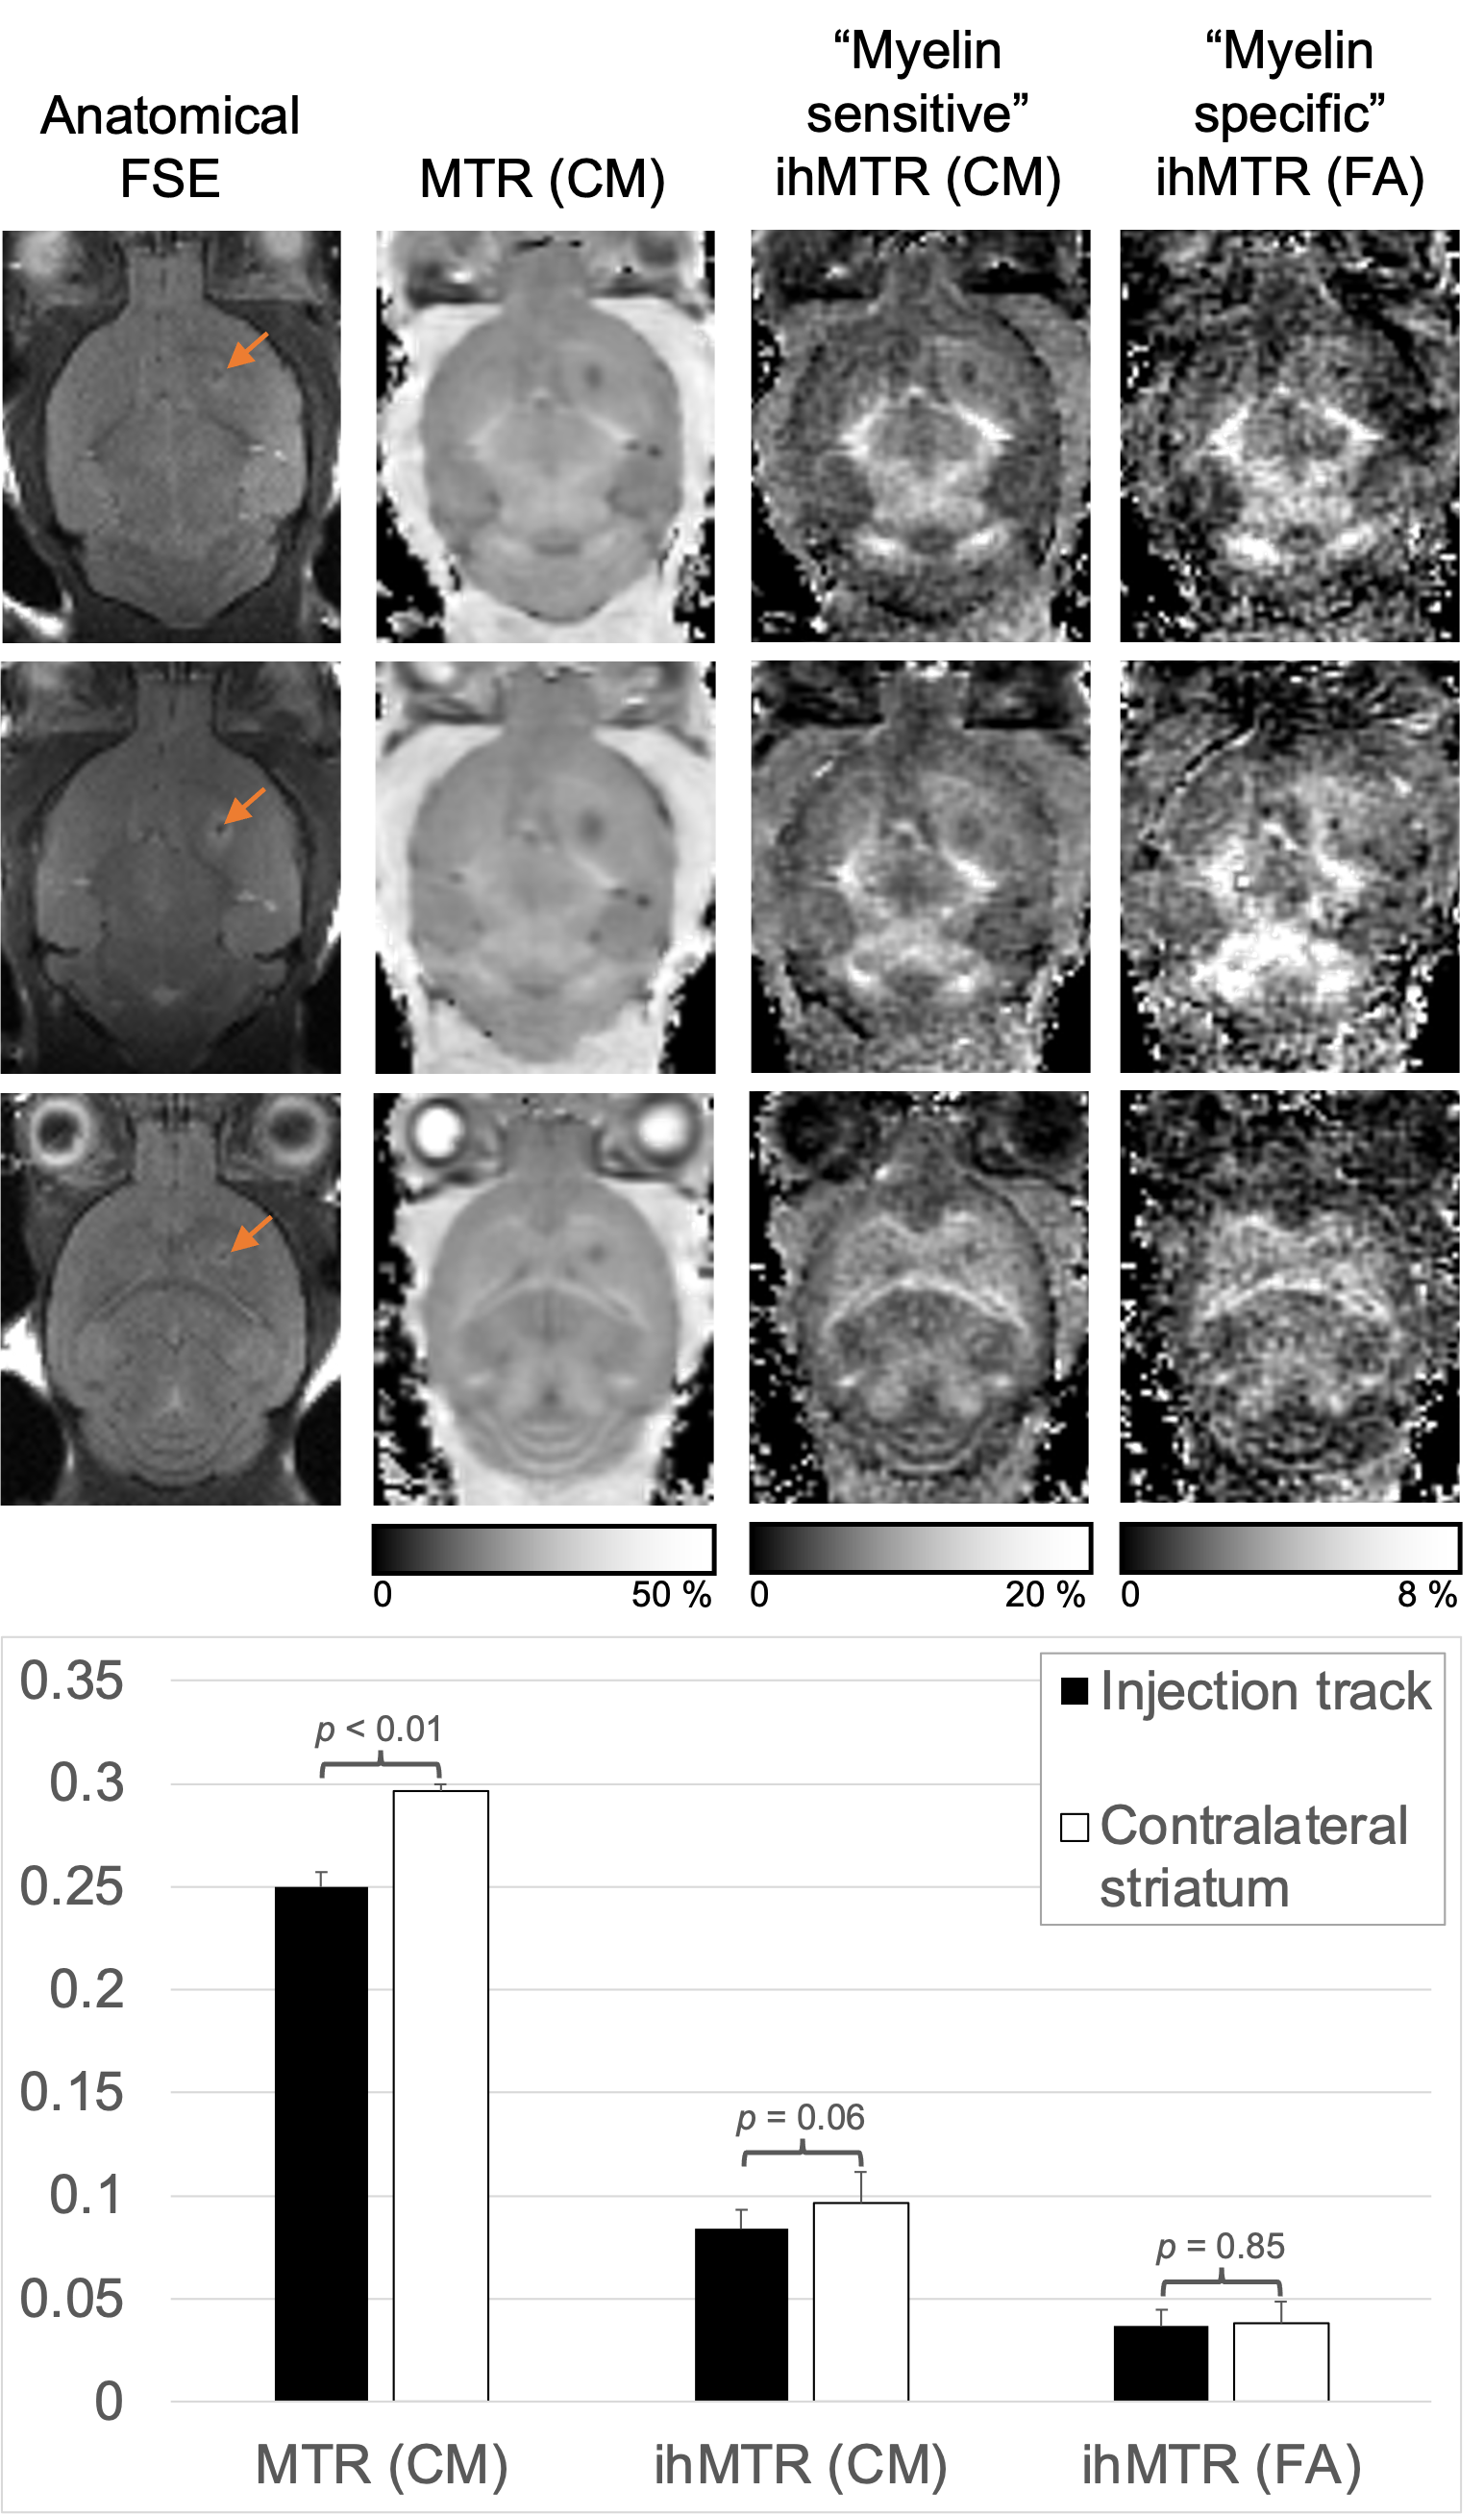
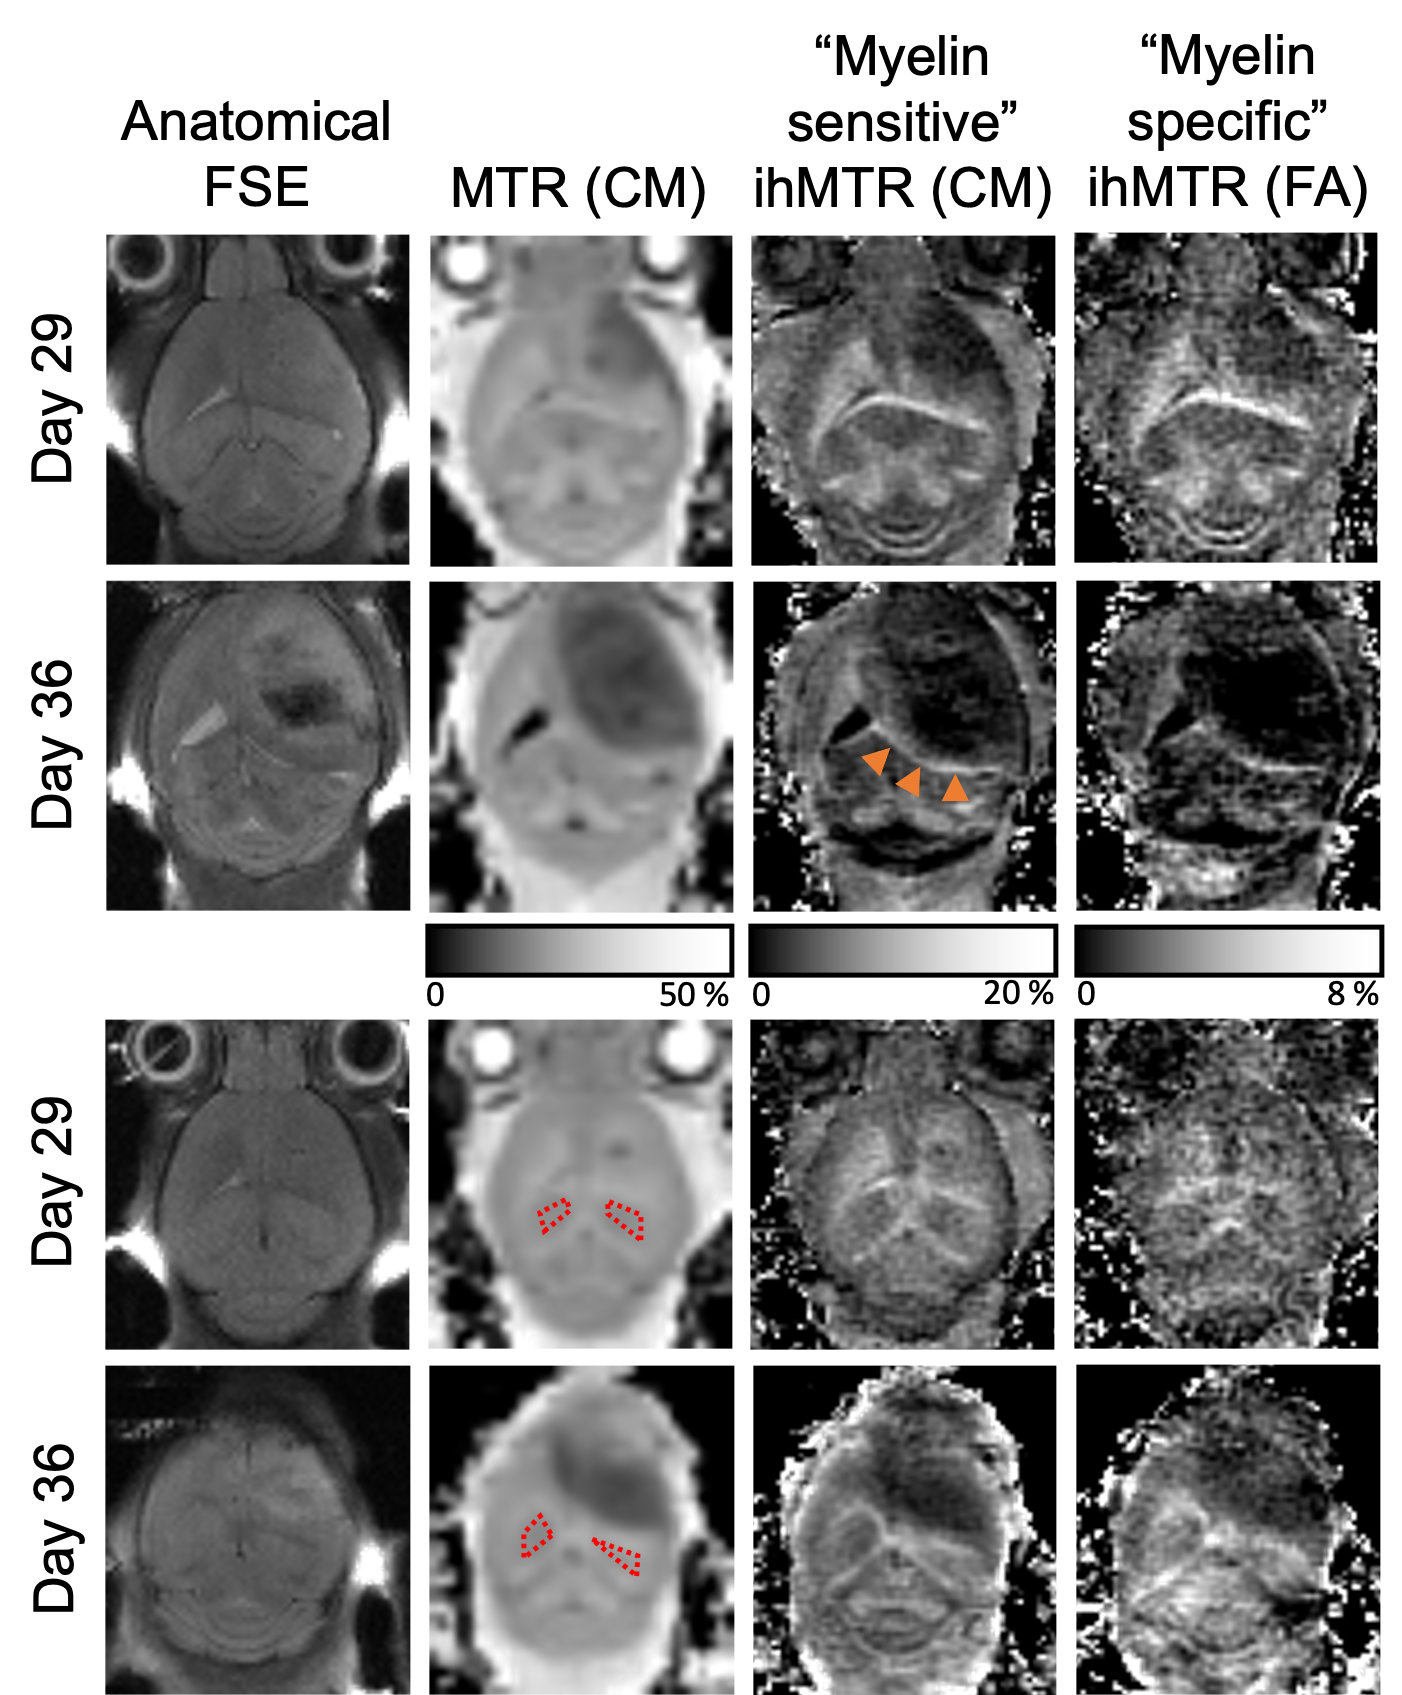
Rigid registration of differently prepared volumes was applied, following zero-filling to double the in-plane resolution and filtering in Matlab (R2018a, Mathworks, USA). MTR (using the zero-power and CM data) and ihMTR maps were calculated as in literature2,6-7, and analysis with manually drawn of regions of interest (ROIs). ROIs were drawn in the striatum to look at the injection track, in the hippocampal formation (HF) and internal capsule (IC), and around the tumor (based on MTR maps).
Short TR, 2D fast spin-echo (FSE) data, with: 0.1mm in-plane; 0.8mm slice thickness; TEeffective/TR=23/863ms, were also acquired for anatomical reference.
Results
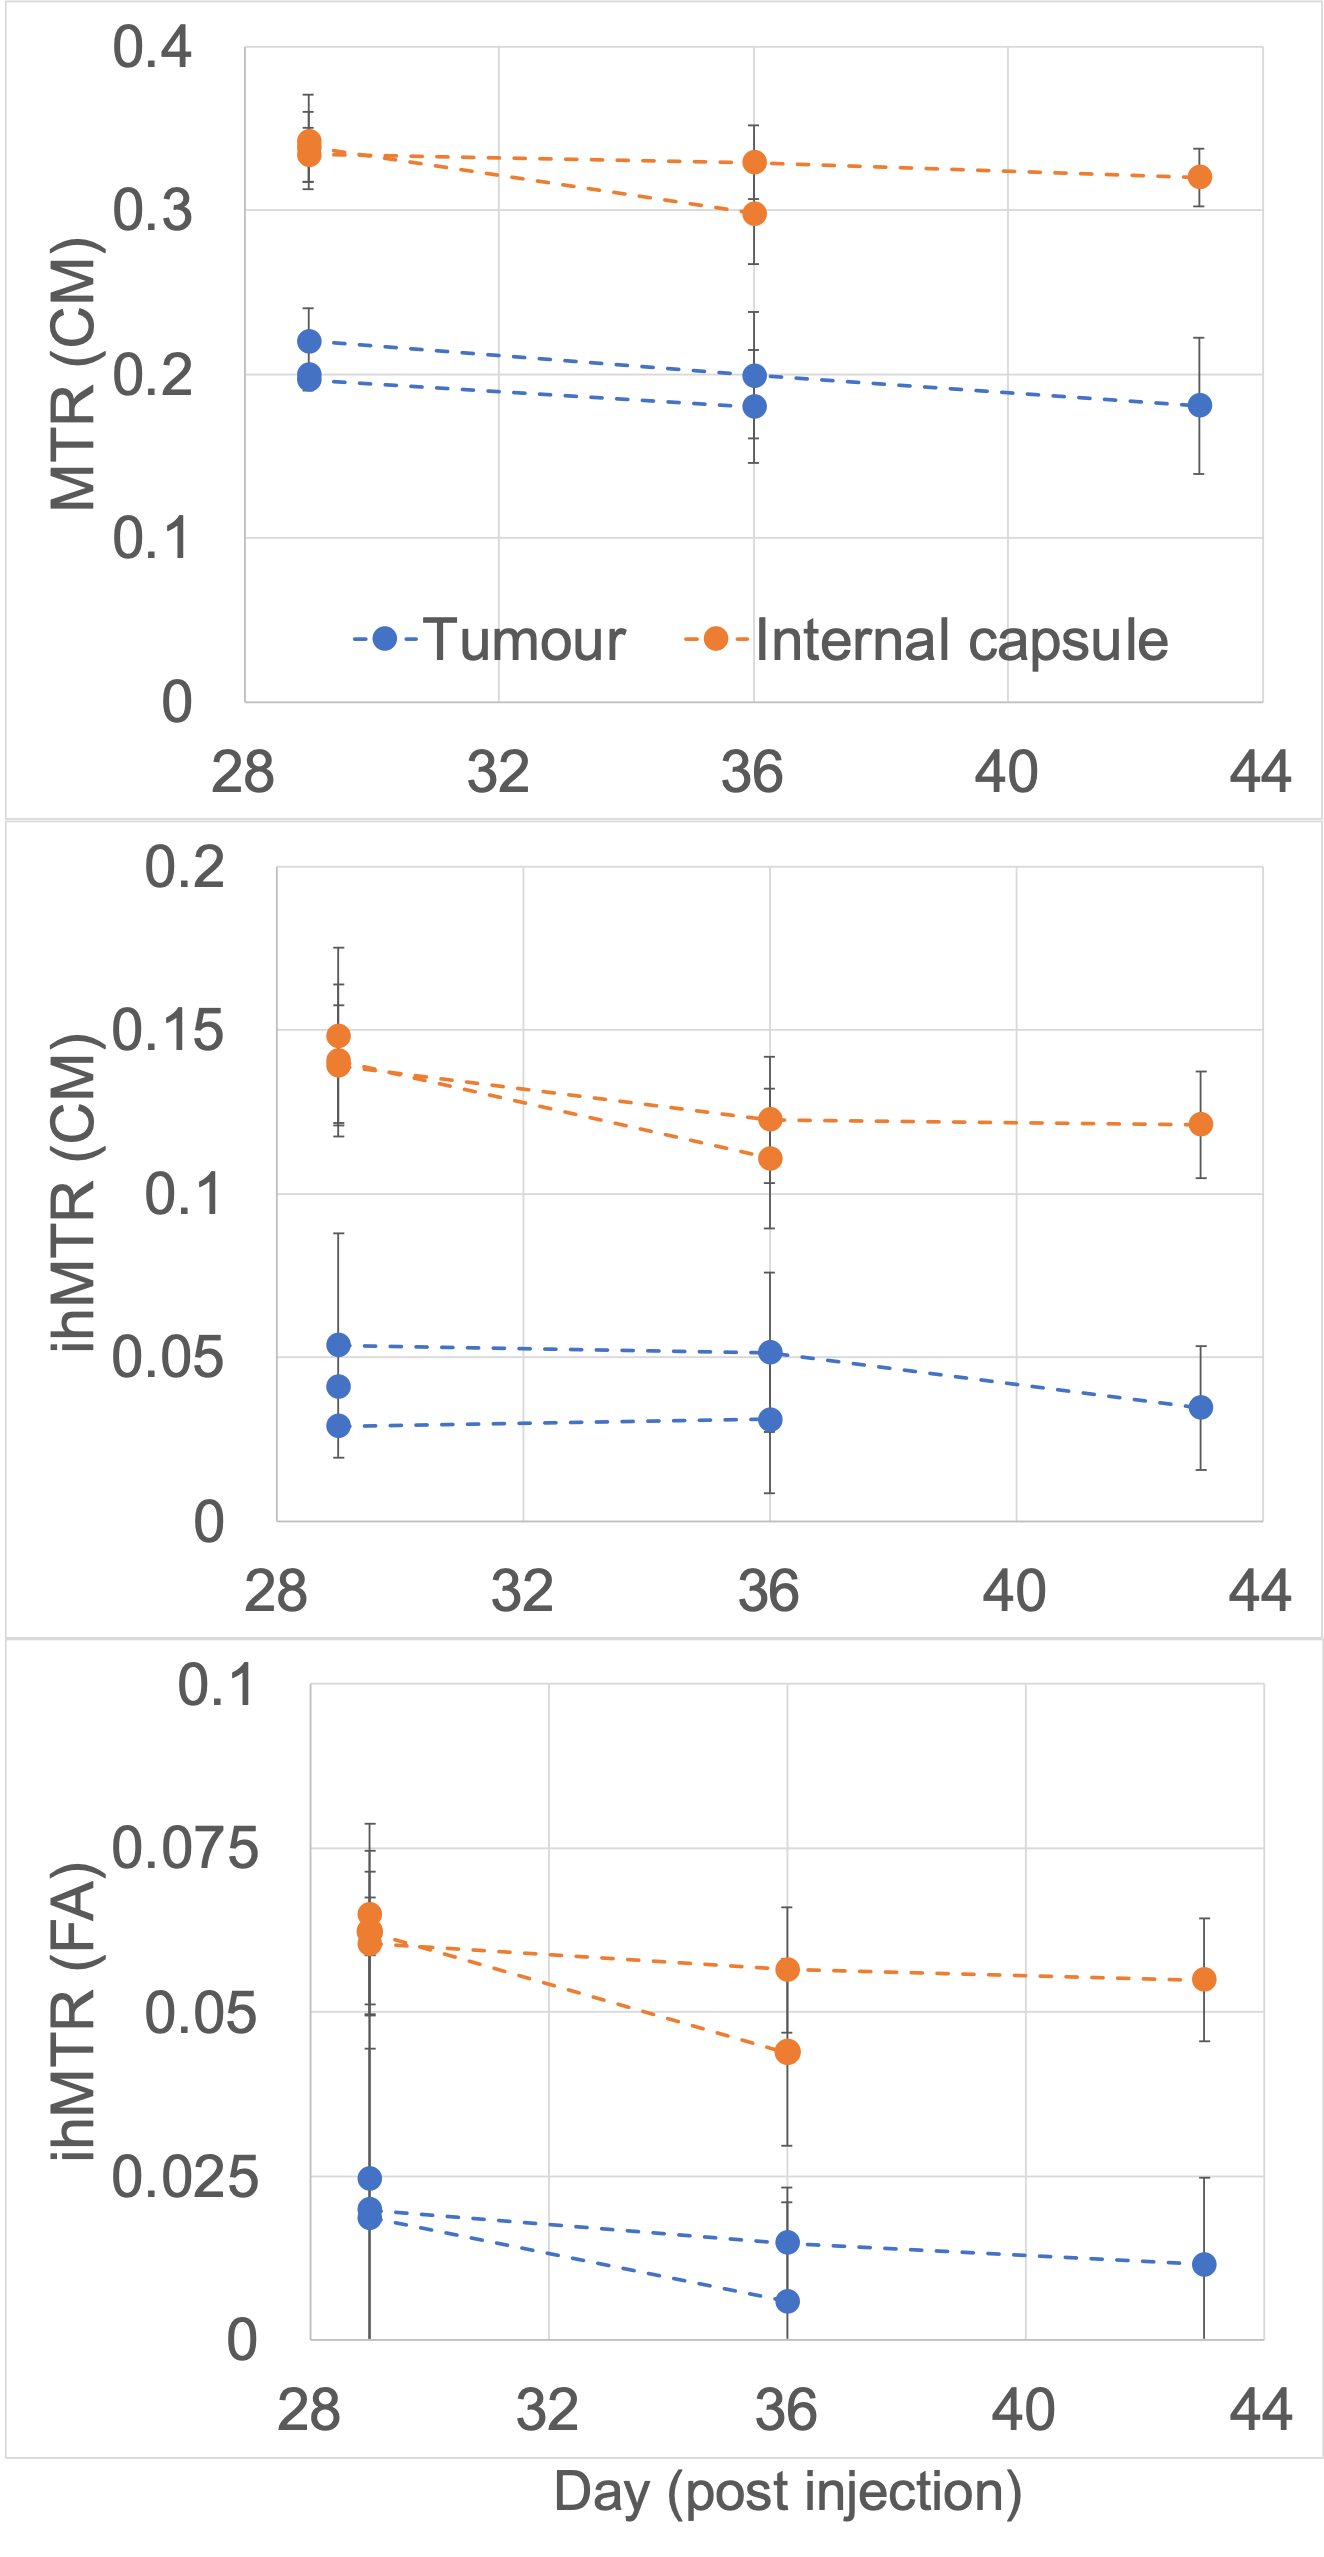
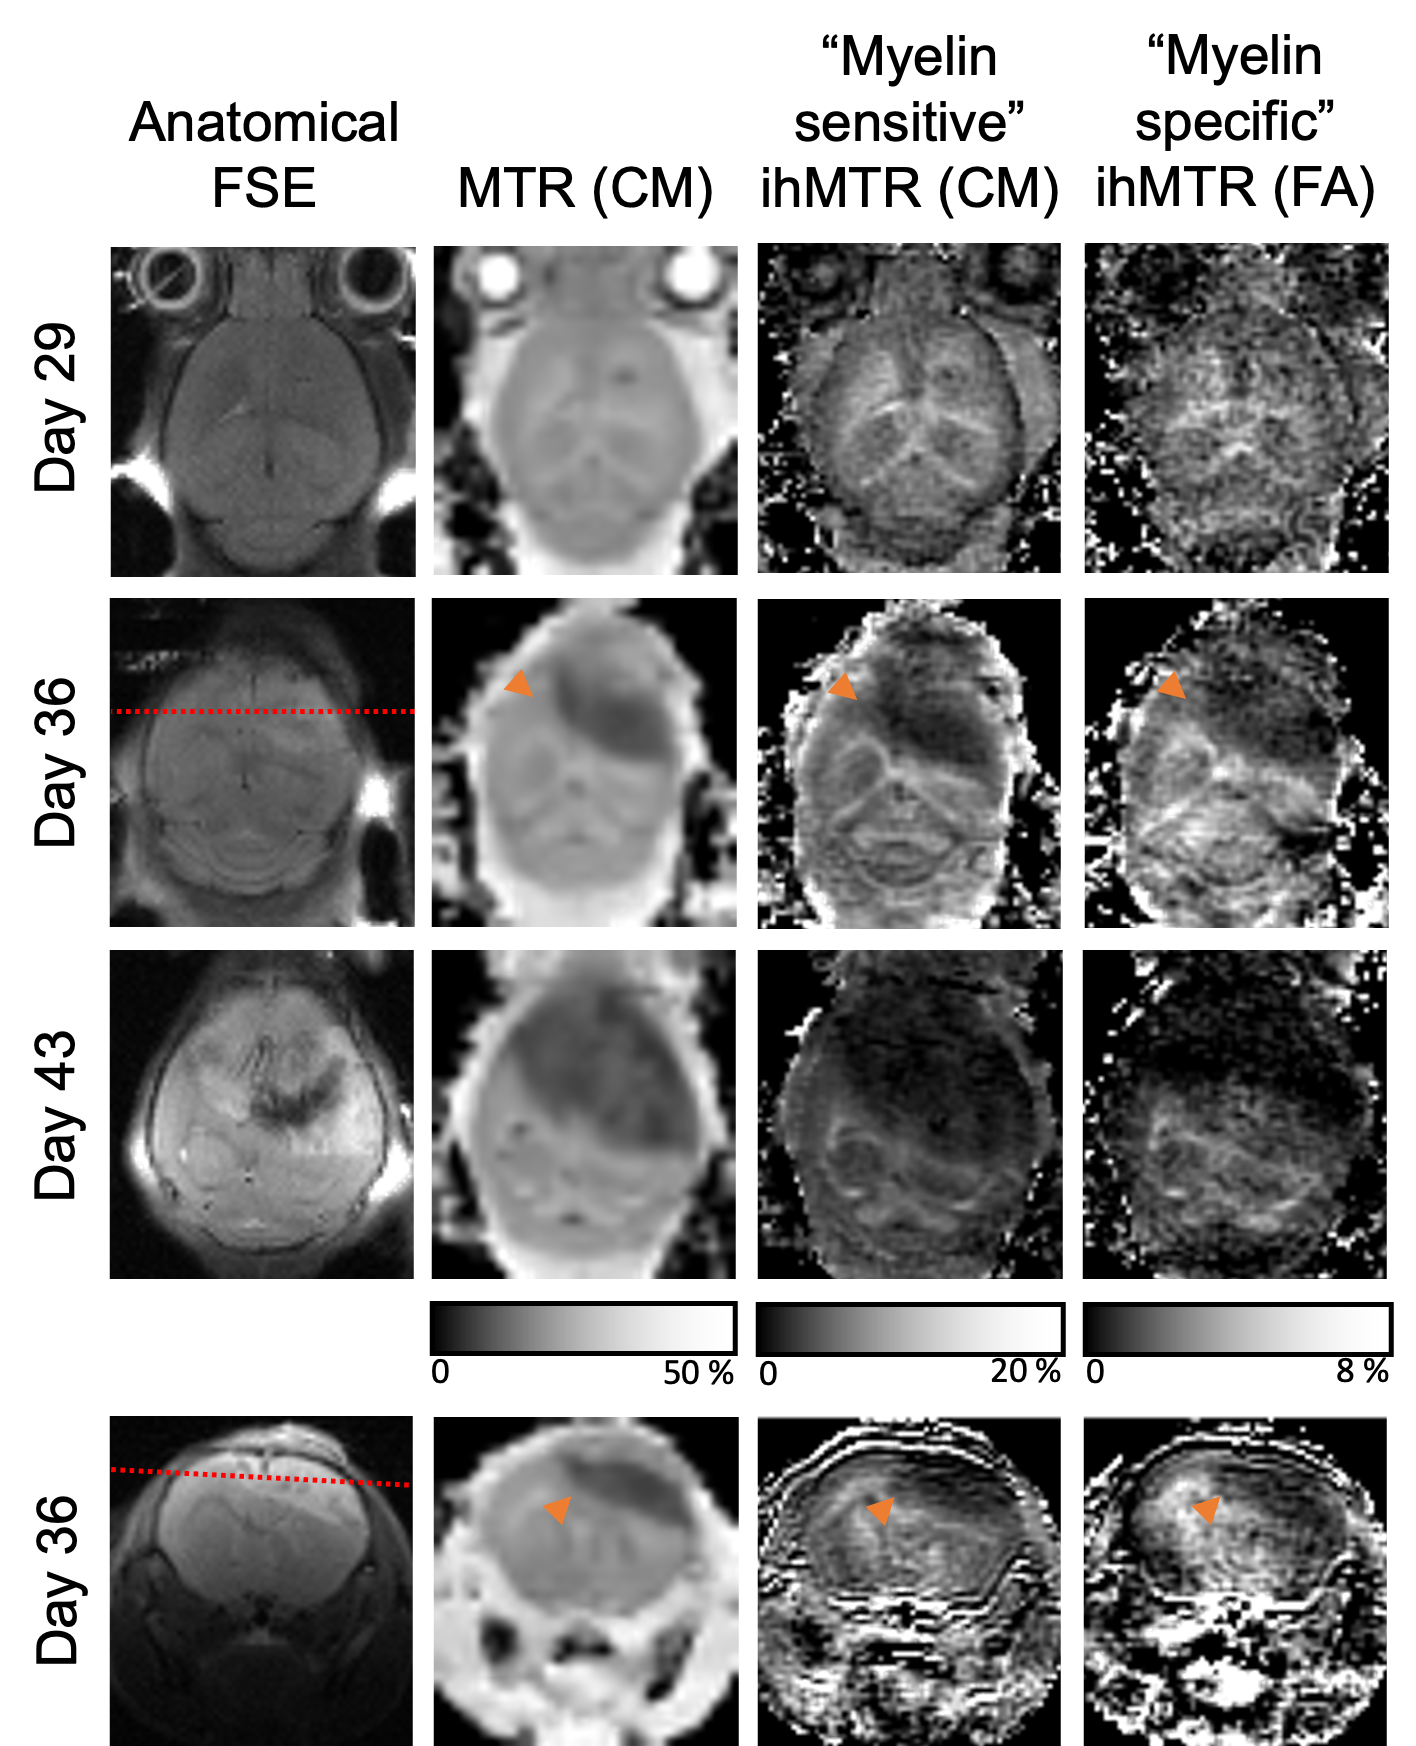
The injection track was visualized not only by a small circular signal void in the FSE, but also decreased MTR and ihMTR relative to a ROI in the contralateral striatum (Fig. 1). The glioblastoma itself was characterized by a low MTR and ihMTR relative to surrounding WM and GM (Fig. 2). At day 29, mean tumor CM ihMTR was 53% of that in HF, whereas relative to HF the fractional decrease in MTR was smaller (26%). Mean tumor MTR and ihMTR (FA) steadily decreased as the tumor grew (Fig. 3). The latter metric being more specific to longer dipolar order relaxation times (such as myelin) suggests the tumor matrix became less structured. Growth of the tumor from day 29 to 36 such that the IC was at its periphery coincided with a decrease in IC ihMTR (Fig. 2). In one case at day 36, the region of low ihMTR (particularly CM) corresponding to the tumor extended further than the region of low MTR (arrowheads in Fig. 4). This difference between MTR and ihMTR was supported by acquisition in a perpendicular plane. By day 43 the tumor had grown into the region of low ihMTR observed at day 36.Discussion
IhMT signal was reduced within the tumor, providing contrast to surrounding WM and GM. Use of a mouse model allowed longitudinal evaluation of glioblastoma, with histological comparison planned. IhMTR, especially FA ihMTR, was much lower in the tumor relative to brain tissue, consistent with the expected lack of myelin. MTR, with lower specificity to WM, was fractionally reduced less in the tumor. The decrease in ihMTR, particularly in IC when at the tumor periphery on day 36 and in the cerebral cortex for one case, was indicative of loss or disruption of myelin. Myelinated tracts have been suggested as a route for tumor cell infiltration, with demyelination serving as a precursor8. Thus, ihMT MRI might provide indication of myelin damage and serve as a guide for more accurate glioblastoma resection. Translation to clinical practice is feasible, with a variety of 3D ihMT acquisitions already demonstrated on clinical scanners within 5-10mins6,9,10.Conclusion
This work provides the first demonstration of the ihMT signal from within glioblastomas. The decrease in ihMTR values in brain tissue (suggesting demyelination) will be the focus of future research, particularly in comparison to histology, and indicates how ihMT MRI could provide additional information prior to surgical resection in translation to clinical management of glioblastoma.Acknowledgements
No acknowledgement found.References
1. Ulmer JL, Klein AP, Mueller WM, DeYoe EA, Mark LP. Preoperative Diffusion Tensor Imaging. Neuroimaging Clinics of North America 2014;24:599–617.
2. Duhamel G, Prevost VH, Cayre M, et al. Validating the sensitivity of inhomogeneous magnetization transfer (ihMT) MRI to myelin with fluorescence microscopy. NeuroImage 2019;199:289–303.
3. Acquaviva J, Jun HJ, Lessard J, et al. Chronic Activation of Wild-Type Epidermal Growth Factor Receptor and Loss of Cdkn2a Cause Mouse Glioblastoma Formation. Cancer Res 2011;71:7198–7206.
4. Zhu H, Acquaviva J, Ramachandran P, et al. Oncogenic EGFR signaling cooperates with loss of tumor suppressor gene functions in gliomagenesis. PNAS 2009;106:2712–2716.
5. Jun HJ, Acquaviva J, Chi D, et al. Acquired MET expression confers resistance to EGFR inhibition in a mouse model of glioblastoma multiforme. Oncogene 2012;31:3039–3050.
6. Varma G, Munsch F, Burns B, et al. Three-dimensional inhomogeneous magnetization transfer with rapid gradient-echo (3D ihMTRAGE) imaging. Magn Reson Med 2020;84:2964–2980.
7. Prevost VH, Girard OM, Varma G, Alsop DC, Duhamel G. Minimizing the effects of magnetization transfer asymmetry on inhomogeneous magnetization transfer (ihMT) at ultra-high magnetic field (11.75 T). Magn Reson Mater Phy 2016;29:699–709.
8. Brooks LJ, Clements MP, Burden JJ, et al. The white matter is a pro-differentiative niche for glioblastoma. Nat Commun 2021;12:2184.
9. Mchinda S, Varma G, Prevost VH, et al. Whole brain inhomogeneous magnetization transfer (ihMT) imaging: Sensitivity enhancement within a steady-state gradient echo sequence: Whole Brain Inhomogeneous Magnetization Transfer (ihMT). Magn Reson Med 2018;79:2607–2619.
10. Wood TC, Damestani NL, Lawrence AJ, et al. Silent myelin-weighted magnetic resonance imaging. Wellcome Open Res 2020;5.
Figures