2500
Chemical Exchange Saturation Transfer MR Fingerprinting (CEST-MRF) Imaging of Brain Metastases: Initial Results1Medical Physics, Memorial Sloan Kettering Cancer Center, New York, NY, United States, 2Radiation Oncology, Memorial Sloan Kettering Cancer Center, New York, NY, United States, 3Radiology, Memorial Sloan Kettering Cancer Center, New York, NY, United States
Synopsis
Chemical Exchange Saturation Transfer (CEST) imaging is a promising method for cancer imaging and was recently combined with MR fingerprinting (CEST-MRF) for fast quantitative relaxation and exchange mapping. The CEST-MRF parametric maps reflect different biophysical processes, and their combination provides a comprehensive picture of complex pathologies, like brain tumors. The goal of this work is to demonstrate the potential utility of CEST-MRF in imaging brain metastases (BM). The in vivo reproducibility of the method is quantified in a healthy subject and the clinical utility is shown in subjects with metastatic brain tumors.
Introduction
Chemical Exchange Saturation Transfer (CEST) imaging is a promising method for cancer imaging due to its ability to characterize brain lesions and potential to differentiate between tumor progression and pseudoprogression [1], [2]. CEST was recently combined with MR fingerprinting (CEST-MRF)[3] to yield rapid and quantitative amide and semi-solid exchange rates and volume fractions maps. The diagnostic potential of CEST-MRF for pathologies is considerable since the resulting parametric maps reflect different biophysical processes, and their combination provides a comprehensive picture of complex pathologies, like brain tumors, where multiple parameters change simultaneously. The goal of this work is to demonstrate the potential utility of CEST-MRF in imaging brain metastases (BM).Methods
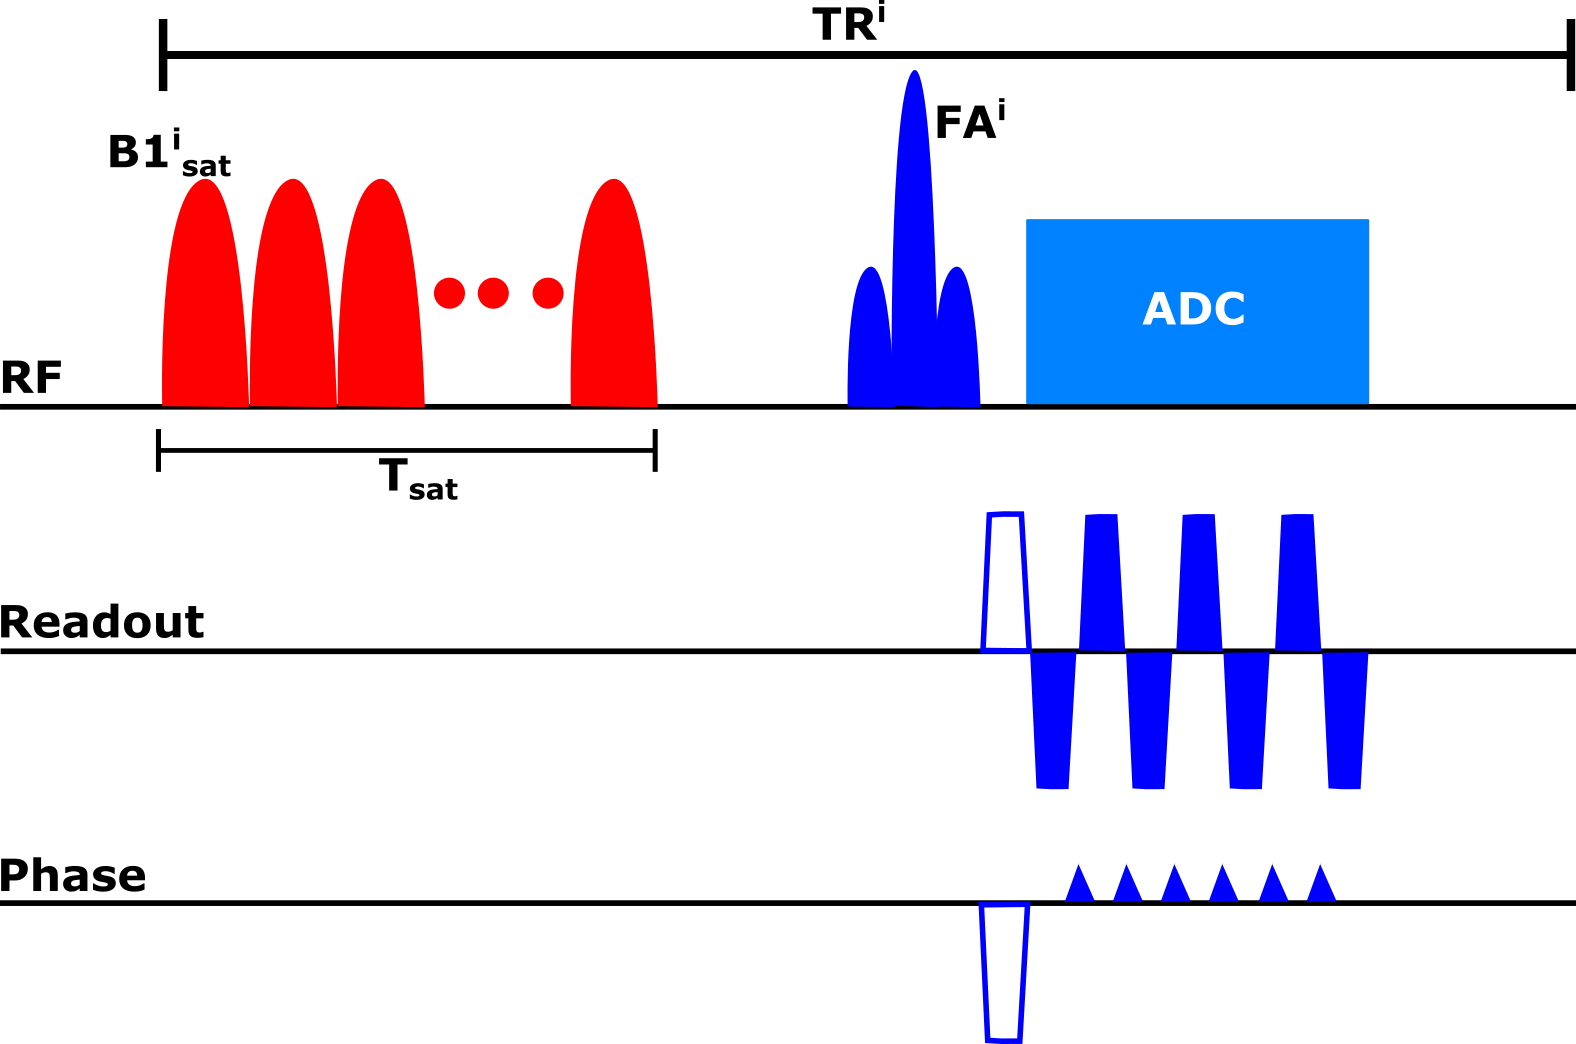
Pulse sequenceFigure 1 shows the proposed pulse sequence for one point of the acquisition schedule. A gaussian-shaped saturation pulse train centered on the amide proton frequency (3.5 ppm) was used. The saturation power was varied according to a previously described schedule[3]. The repetition time (TR), excitation flip angle (FA) and saturation duration (Tsat) were as follows: TR=3500 ms, FA=90°, Tsat=2560 ms. The signal from each slice was read with an EPI readout with partial Fourier factor of ~6/8, acceleration factor R=3 and an echo time (TE) of 24 ms. The matrix size was 224×224 with a FOV of 280 mm2 for an in-plane resolution of 1.25 mm2 and a slice thickness of 5 mm. The total acquisition time for the 30 schedule time steps used was 105 seconds.
Tissue quantification
The tissue parameter maps were quantified with a 4-layer DRONE neural network[4] implemented in Pytorch. The network was trained with a 500,000 entries simulated dictionary of signal magnetizations that was generated using the following parameter ranges: water T1 (T1w)=[400, 3000] ms, water T2 (T2w)=[1,2000] ms, amide exchange rate (ksw)=[1,100] Hz, amide volume fraction (fs)=[0,2.27]%, semi-solid exchange rate=[1,50] Hz, semi-solid volume fraction (fss)=[1.81,27.27] %, transmitter inhomogeneity (B1)=[0.5,1.5]. The signal magnetizations were calculated by solving the 3-pool (water, solute, semi-solid) Bloch-McConnel equations for each set of tissue parameters in the dictionary. The network was trained to convergence using the ADAM optimizer[5] with a batch size of 1000, learning rate of 0.0001 and the L1 loss function.
In vivo reproducibility in healthy subjects
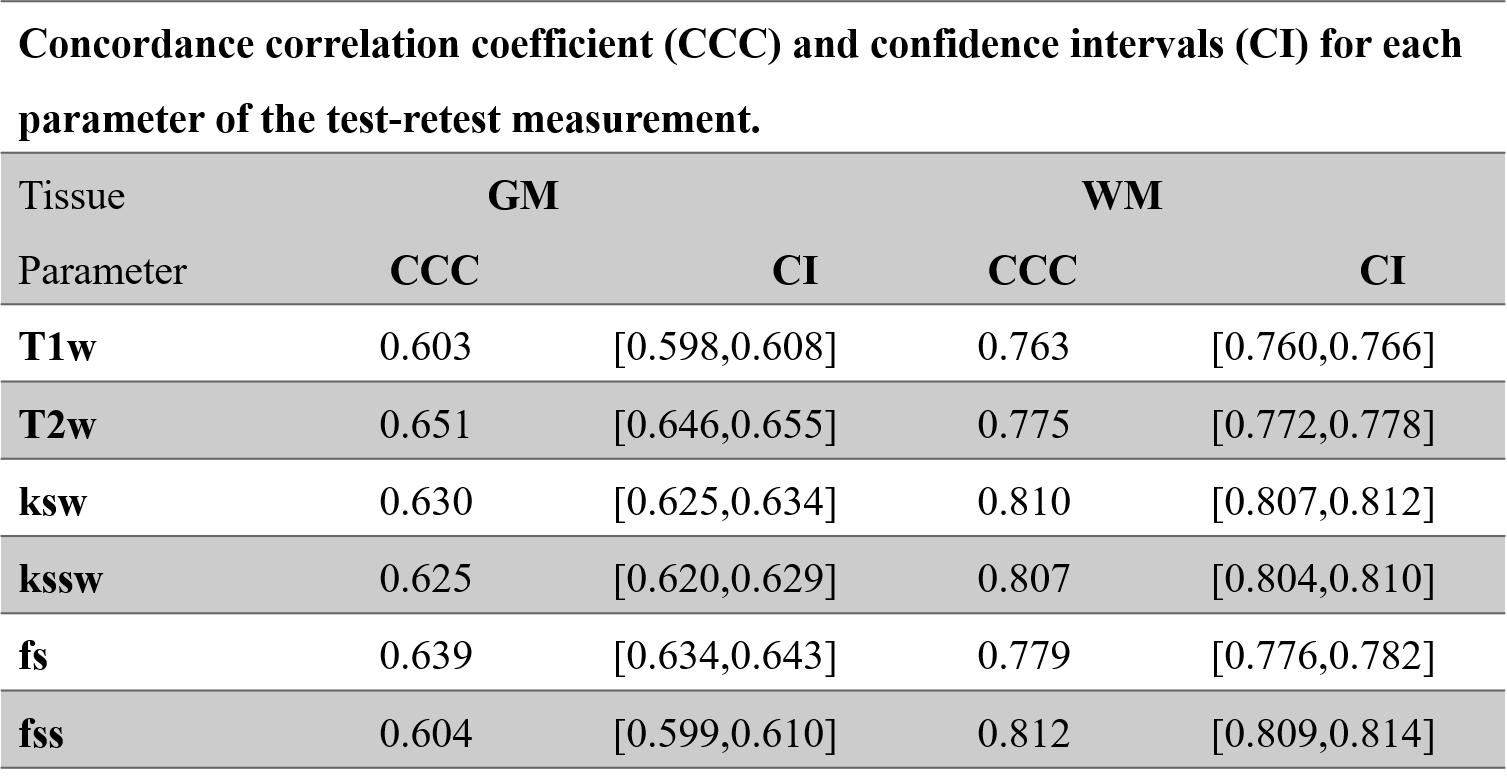
A healthy, 31 years old female volunteer was recruited and gave informed consent in accordance with the institutional IRB protocol. The in vivo reproducibility was assessed by test-retest scanning. The subject was scanned on a Signa Premier 3T scanner (GE Healthcare, Waukesha, WI) with a 48-channel head receiver coil. The subject was sequentially scanned twice with the CEST-MRF sequence and then removed from the scanner. Following a 5 minutes delay, the subject was again placed in the scanner, re-localized and scanned two more times with the CEST-MRF sequence. Data from each scan were reconstructed with the trained DRONE network and segmented into grey matter (GM) and white matter (WM) using the reconstructed T2w map. Specifically, voxels with T2 values between 20 and 90 ms were assigned to WM and those with T2 values between 90 and 200 ms assigned to GM. The same masks were then used to determine the GM and WM values for all other parameter maps. The Lin’s concordance correlation coefficient (CCC)[6] was calculated in the GM and WM of each tissue parameter as a measure of the reproducibility of each parameter.
Brain metastases subjects
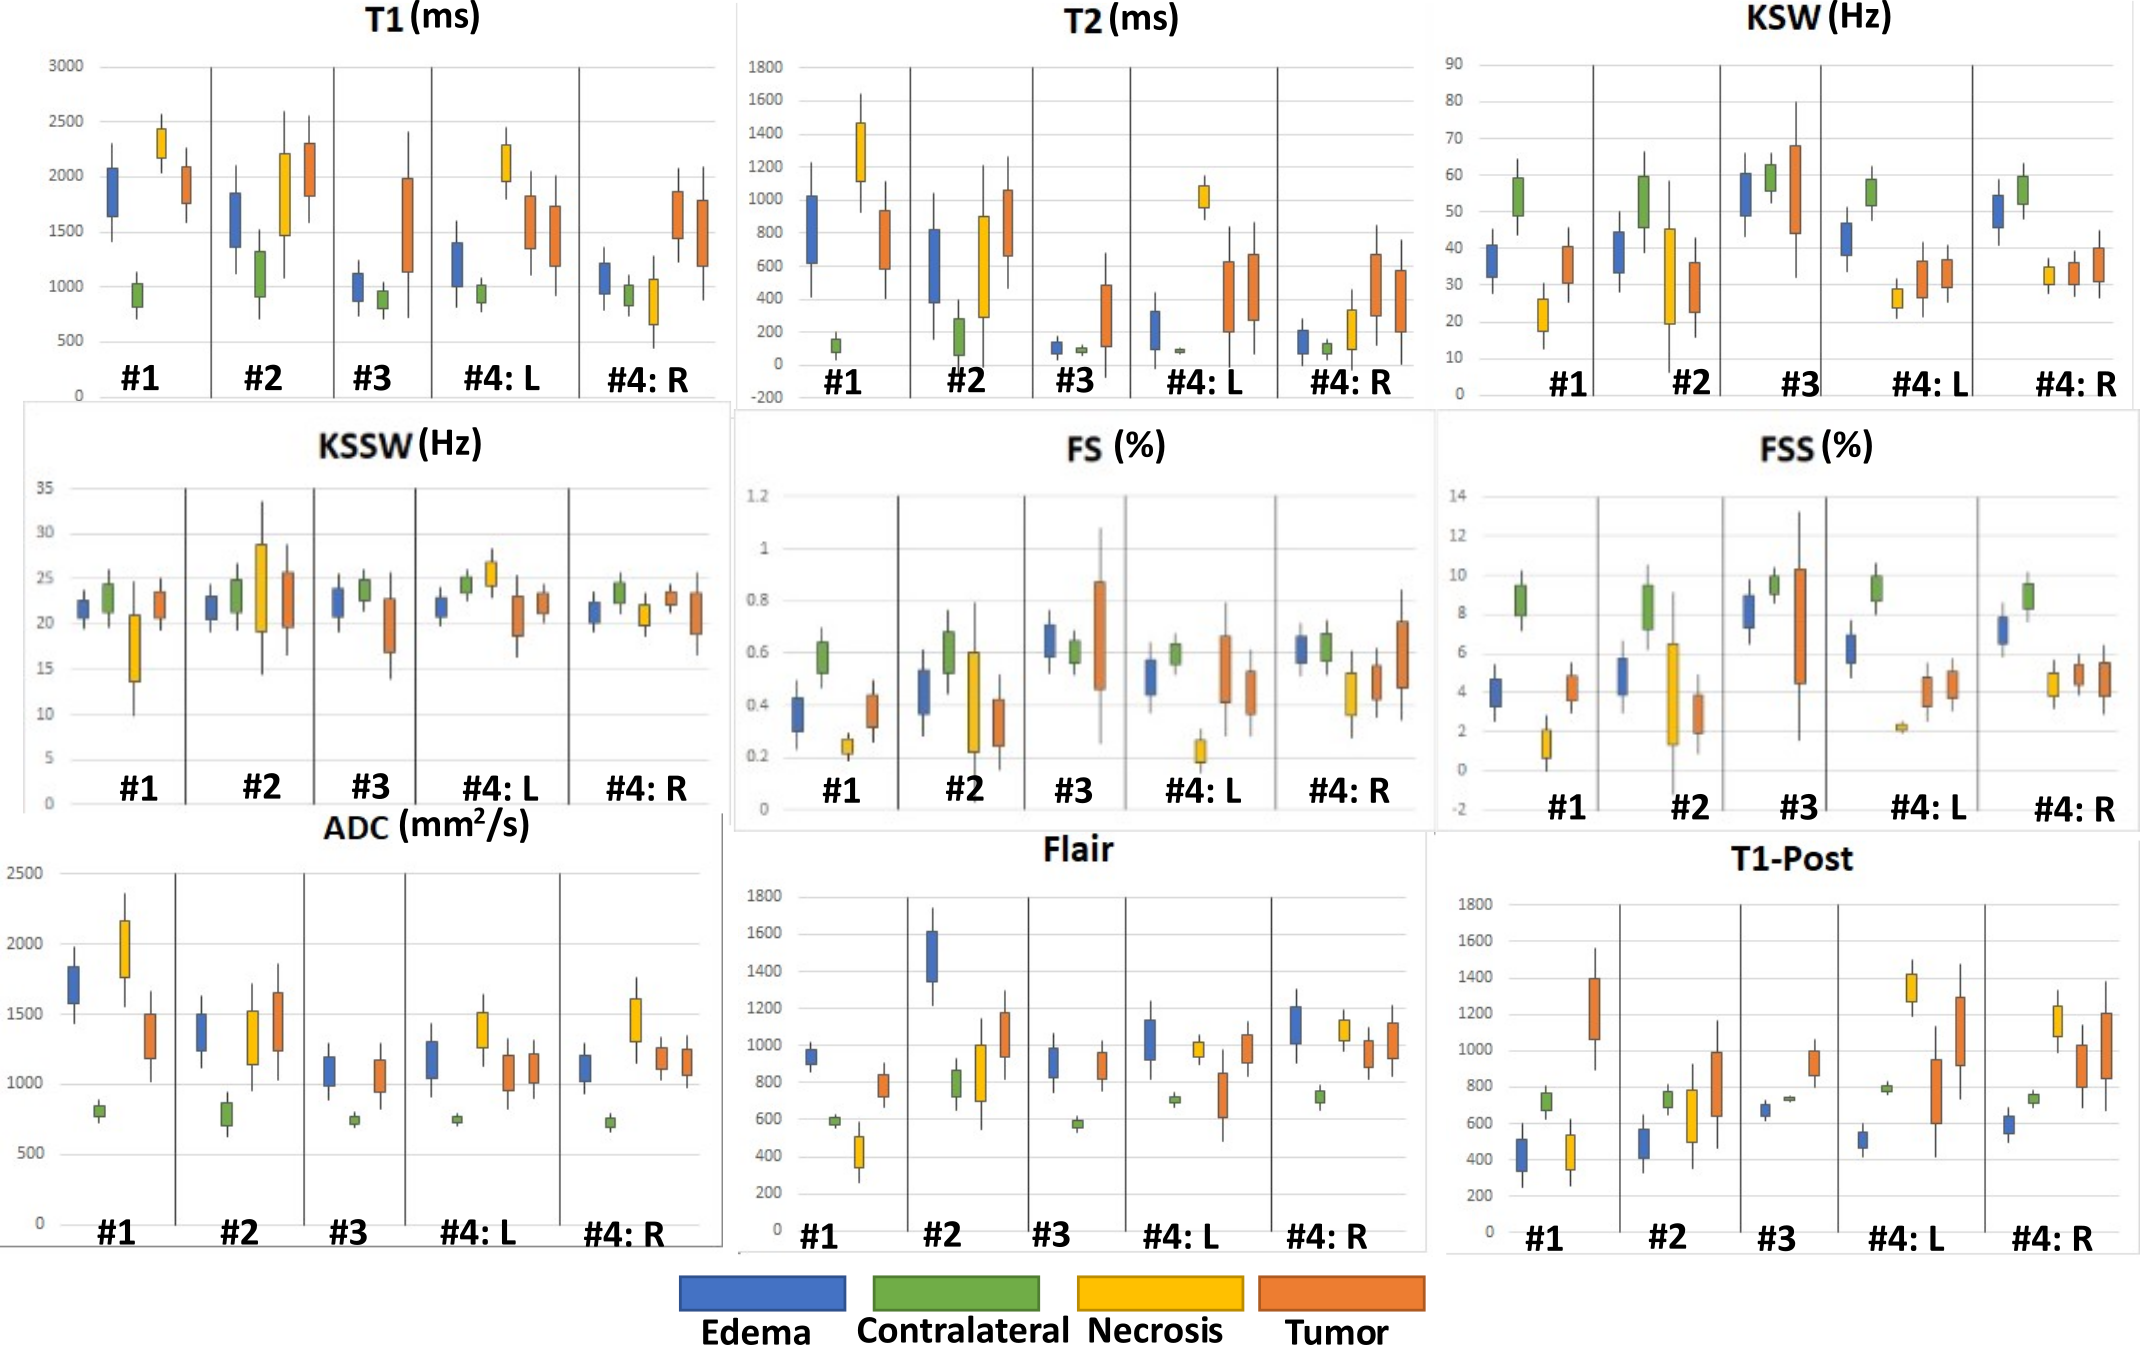
Five subjects with BM were recruited for this study and provided informed consent. Each subject was scanned with the CEST-MRF pulse sequence in addition to the standard-of-care protocol. The tissue maps were quantified as described above and each lesion segmented into tumor, necrotic and edema regions by a trained radiation oncologist. A healthy contra-lateral region was also demarcated. The mean and standard deviation of the tissue parameter values in each region were compared across patients and compared to values obtained with a standard-of-care protocol in the same scan session for each subject.
Results
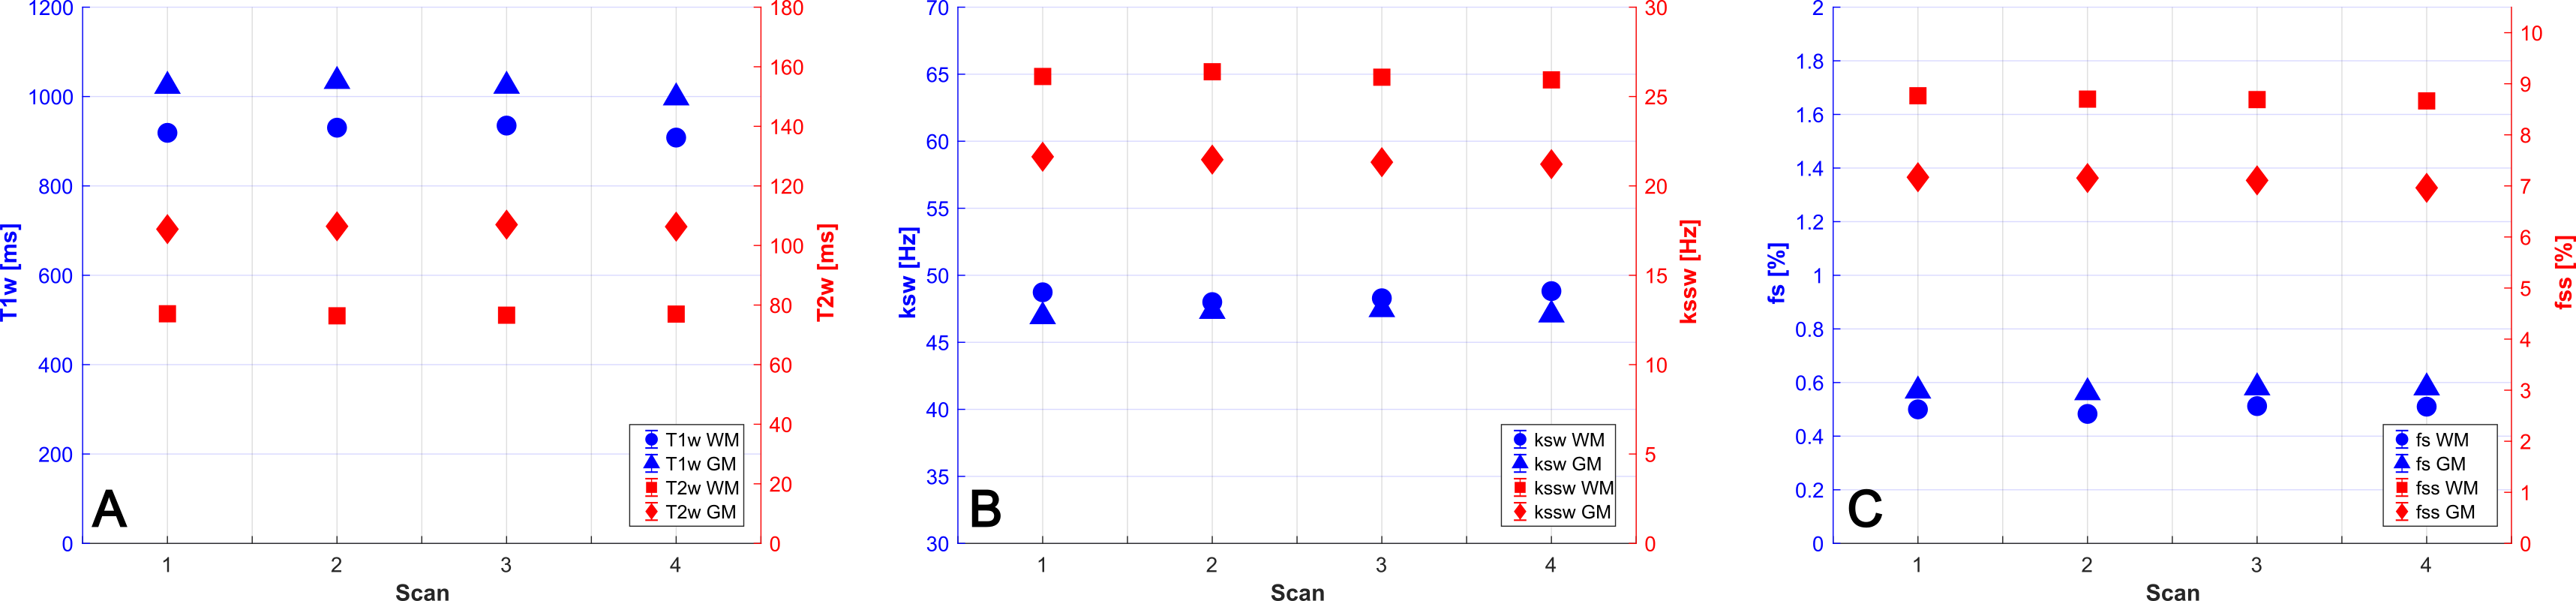
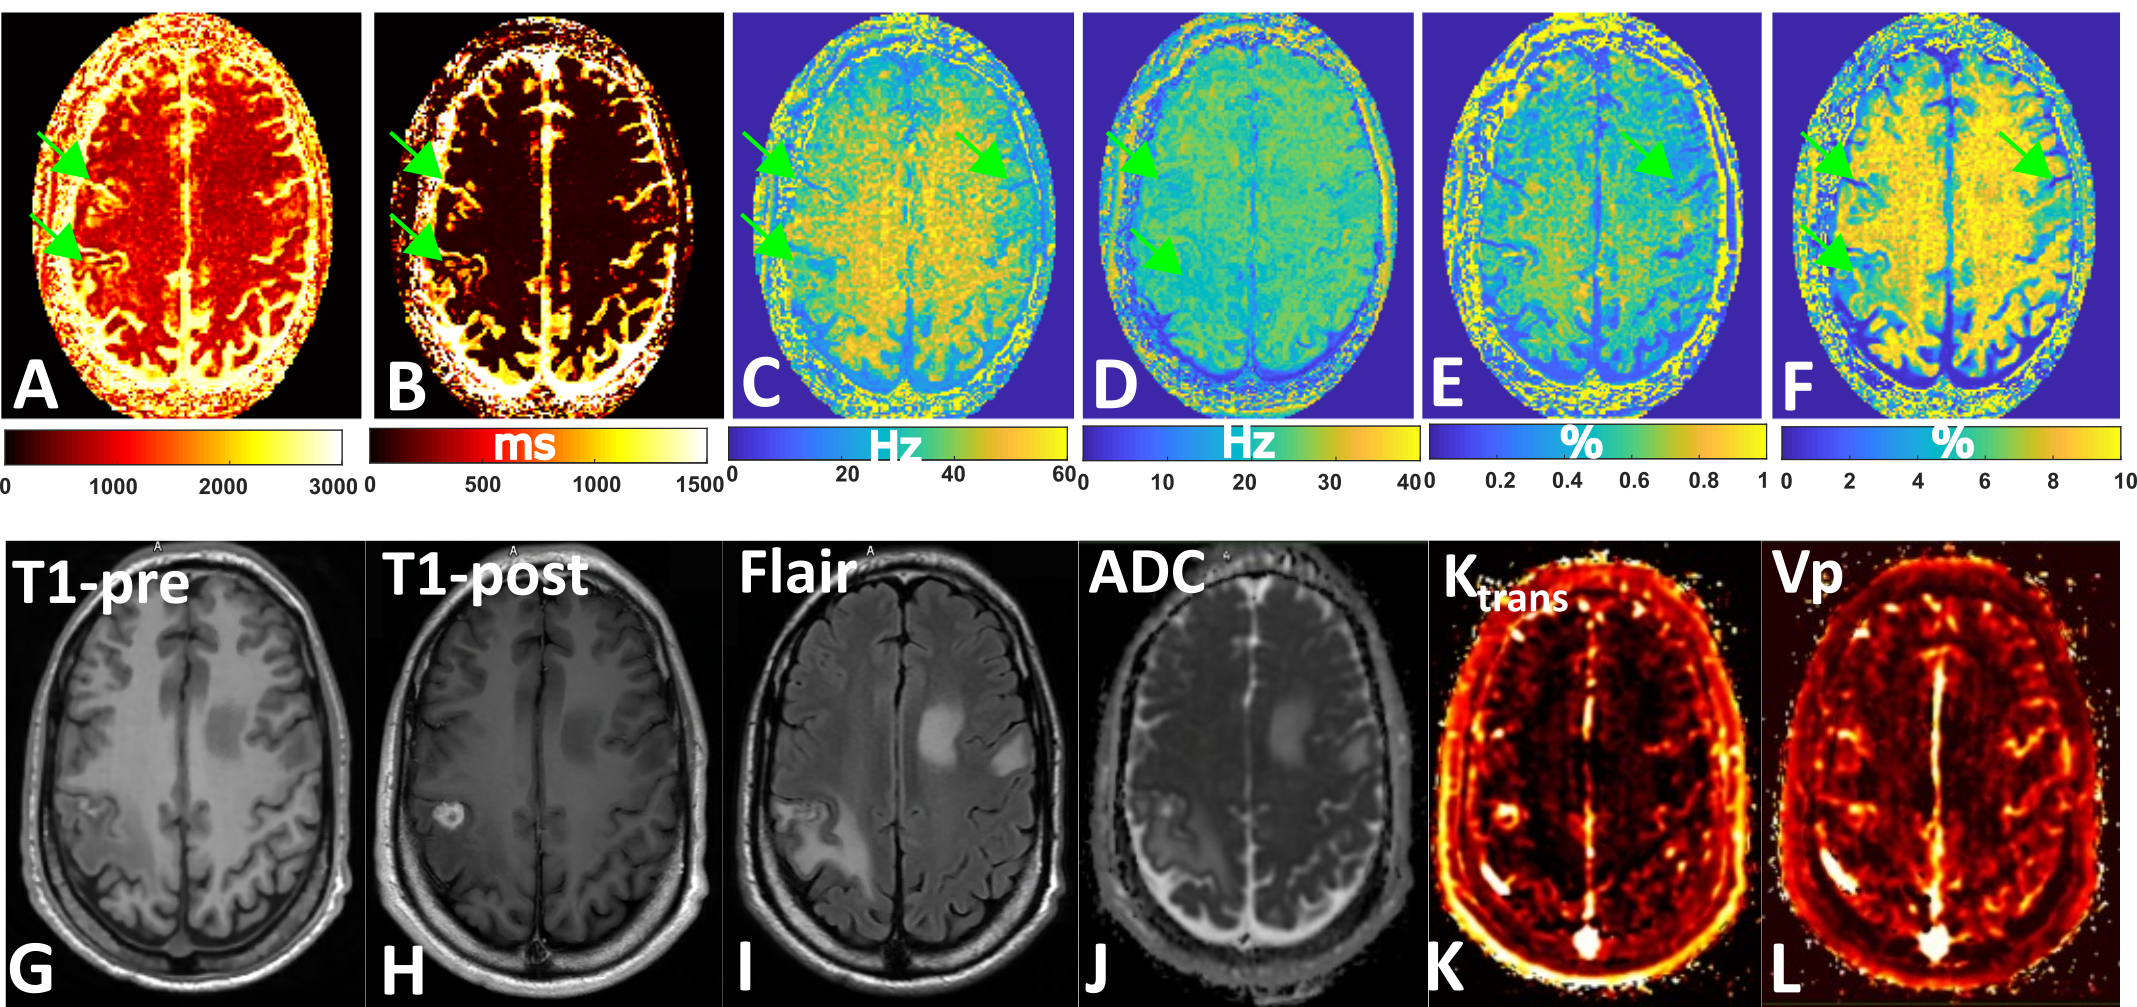
In vivo GM and WM tissue parameter values for the four CEST-MRF scans are shown in Figure 2 and the corresponding concordance correlation coefficient (CCC) in Figure 3. An example of the CEST-MRF maps in a single subject along with standard-of-care imaging protocols is shown in Figure 4. The tissue parameter values for one BM subject in the segmented regions are shown in Figure 5.Discussion/Conclusion
This work demonstrates an initial application of CEST-MRF to BM. The quantitative maps provided by the CEST-MRF pulse sequence showed good reproducibility in a healthy subject which is important for longitudinal studies and treatment response assessment. It should be noted that most of the BM subjects scanned in this work underwent radiation therapy treatment. At present, the biological effects of radiation on the CEST-MRF tissue maps are not well understood and represent an additional confounding factor. Because of the intrinsic biological variability in tumors, prospective large-scale studies will be required to draw meaningful conclusions about relationships between the CEST-MRF maps and the associated tumor characteristics.Acknowledgements
This work was partially supported by the NIH/NCI Cancer Center Support Grant/Core Grant (P30 CA008748)References
1] B. Ma et al., “Applying amide proton transfer-weighted MRI to distinguish pseudoprogression from true progression in malignant gliomas,” J. Magn. Reson. Imaging, vol. 44, no. 2, pp. 456–462, 2016.
[2] J. Zhou et al., “Differentiation between glioma and radiation necrosis using molecular magnetic resonance imaging of endogenous proteins and peptides,” Nat. Med., vol. 17, no. 1, pp. 130–134, 2011. [3] O. Cohen, S. Huang, M. T. McMahon, M. S. Rosen, and C. T. Farrar, “Rapid and quantitative chemical exchange saturation transfer (CEST) imaging with magnetic resonance fingerprinting (MRF),” Magn. Reson. Med., vol. 80, no. 6, pp. 2449–2463, 2018.
[4] O. Cohen, B. Zhu, and M. S. Rosen, “MR fingerprinting deep reconstruction network (DRONE),” Magn. Reson. Med., vol. 80, no. 3, pp. 885–894, 2018.
[5] D. P. Kingma and J. Ba, “Adam: A method for stochastic optimization,” ArXiv Prepr. ArXiv14126980, 2014.
[6] I. Lawrence and K. Lin, “A concordance correlation coefficient to evaluate reproducibility,” Biometrics, pp. 255–268, 1989.
Figures