2499
Structural disconnections in brain tumours: investigating the similarity of Direct and Indirect Approaches1Padova Neuroscience Center, University of Padova, Padova, Italy, 2Department of Information Engineering, University of Padova, Padova, Italy, 3Department of Neuroscience, University of Padova, Padova, Italy, 4Venetian Institute of Molecular Medicine, Padova, Italy, 5Department of Medicine, Unit of Nuclear Medicine, University of Padova, Padova, Italy
Synopsis
Gliomas are amongst the most common primary brain tumours in adults and are often associated with poor prognosis. Understanding the extent of white matter (WM) which is affected outside the tumoral lesion may be of paramount importance to explain cognitive deficits and the clinical progression of the disease. Thus, we apply both direct (i.e., tractography based) and indirect (i.e., atlas based) approaches to quantifying WM structural disconnections in a cohort of 50 glioma patients. We eventually compare the disconnections maps provided by the two methodologies in terms of spatial similarity and discuss their critical use in this field.
Introduction
Gliomas are amongst the most common primary brain tumours in adults, and are often associated with poor prognosis1. They affect the normal structural connectivity of the brain not only due to their anatomic location, but also to the degree of infiltration of normal appearing white matter (NAWM) pathways2. To the end of investigating which white matter (WM) tracts are affected by tumoral lesions, this work introduces the computation of structural disconnection (SD) maps in the brain oncological field. This technique has recently gained popularity in the field of stroke lesions3–5, but, to our knowledge, it has never been applied to brain tumours. We quantify patterns of NAWM disconnection both using single-subject tractography (i.e., the direct approach) and a normative WM tractography atlas (i.e., the indirect approach6). We discuss benefits and criticalities of both approaches and quantify whether they provide analogous information regarding patterns of WM disconnections.Methods
MR acquisition and lesion segmentationDirect and indirect disconnections maps (respectively, dSD and iSD) were reconstructed in a cohort of 50 glioma patients (age 59.9±14.6y, 20 females), with heterogeneous tumour grading, volume and location. Diffusion images were acquired on a 3T Siemens Biograph mmR MR/PET scanner with the optimized NODDI protocol7 (TR/TE 5355ms/104 ms; 2x2x2 mm3). All volumes were acquired with reversed phase encoding directions for preprocessing needs. Using the patient’s structural images, including a 3D T2-weighted (T2w) FLAIR (TR/TE 5000/395 ms; 1x1x1 mm3), two 3D T1-weighted MPRAGE (TR/TE 2400/3.2 ms; 1x1x1 mm3) acquired both before/after contrast agent injection and a T2w image (TR/TE 3200/536 ms; 1x1x1 mm3), a lesion mask which included the tumour core and the oedema area was manually delineated through ITK-SNAP (http://www.itksnap.org/).
dSD maps computation
Anatomically constrained tractography8 was performed entirely within the MRtrix software, using multi-shell multi-tissue spherical deconvolution9 and the iFOD2 algorithm. The tractograms were initially generated with 100M streamlines and subsequently reduced to 10M using the SIFT framework10. Segmented lesions were then embedded in the patient-specific tractogram, revealing those streamlines intersecting the tumour. Such streamlines were then discretized in the voxel-wise diffusion space and a visitation map (the dSD map) was computed.
iSD maps computation
iSD maps were computed with the BCB Toolkit v.4.26, using the 7T atlas featuring 180 healthy subjects from the Human Connectome Project (provided by the tool). As better detailed in6, disconnections were quantified by embedding the lesion, registered to the MNI common space, on a normative WM atlas. Streamlines crossing the lesion were detected, and a voxel-wise probability map of WM disconnection was computed (the iSD map).
Metrics of comparison
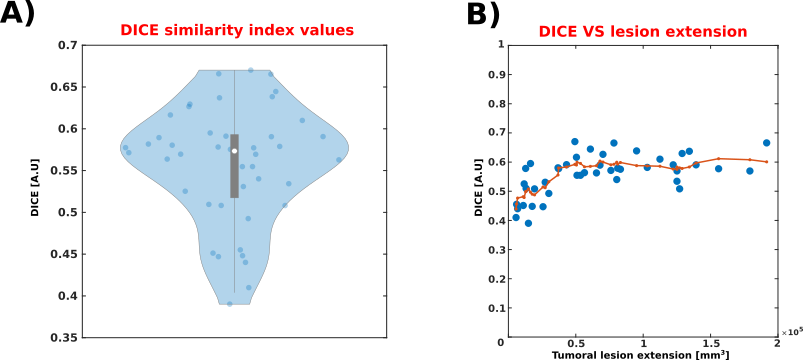
iSD/dSD maps were thresholded and binarized prior to the similarity analysis. The comparison was made in terms of their extension and shape inside the brain by means of the Dice similarity index. To explore the possible dependence of the similarity from the extension of the lesion, we generated a scatterplot of the two quantities and computed the moving average (7 samples per window, centred) of the vector containing the sorted extensions to non-parametrically investigate this relationship.
Results
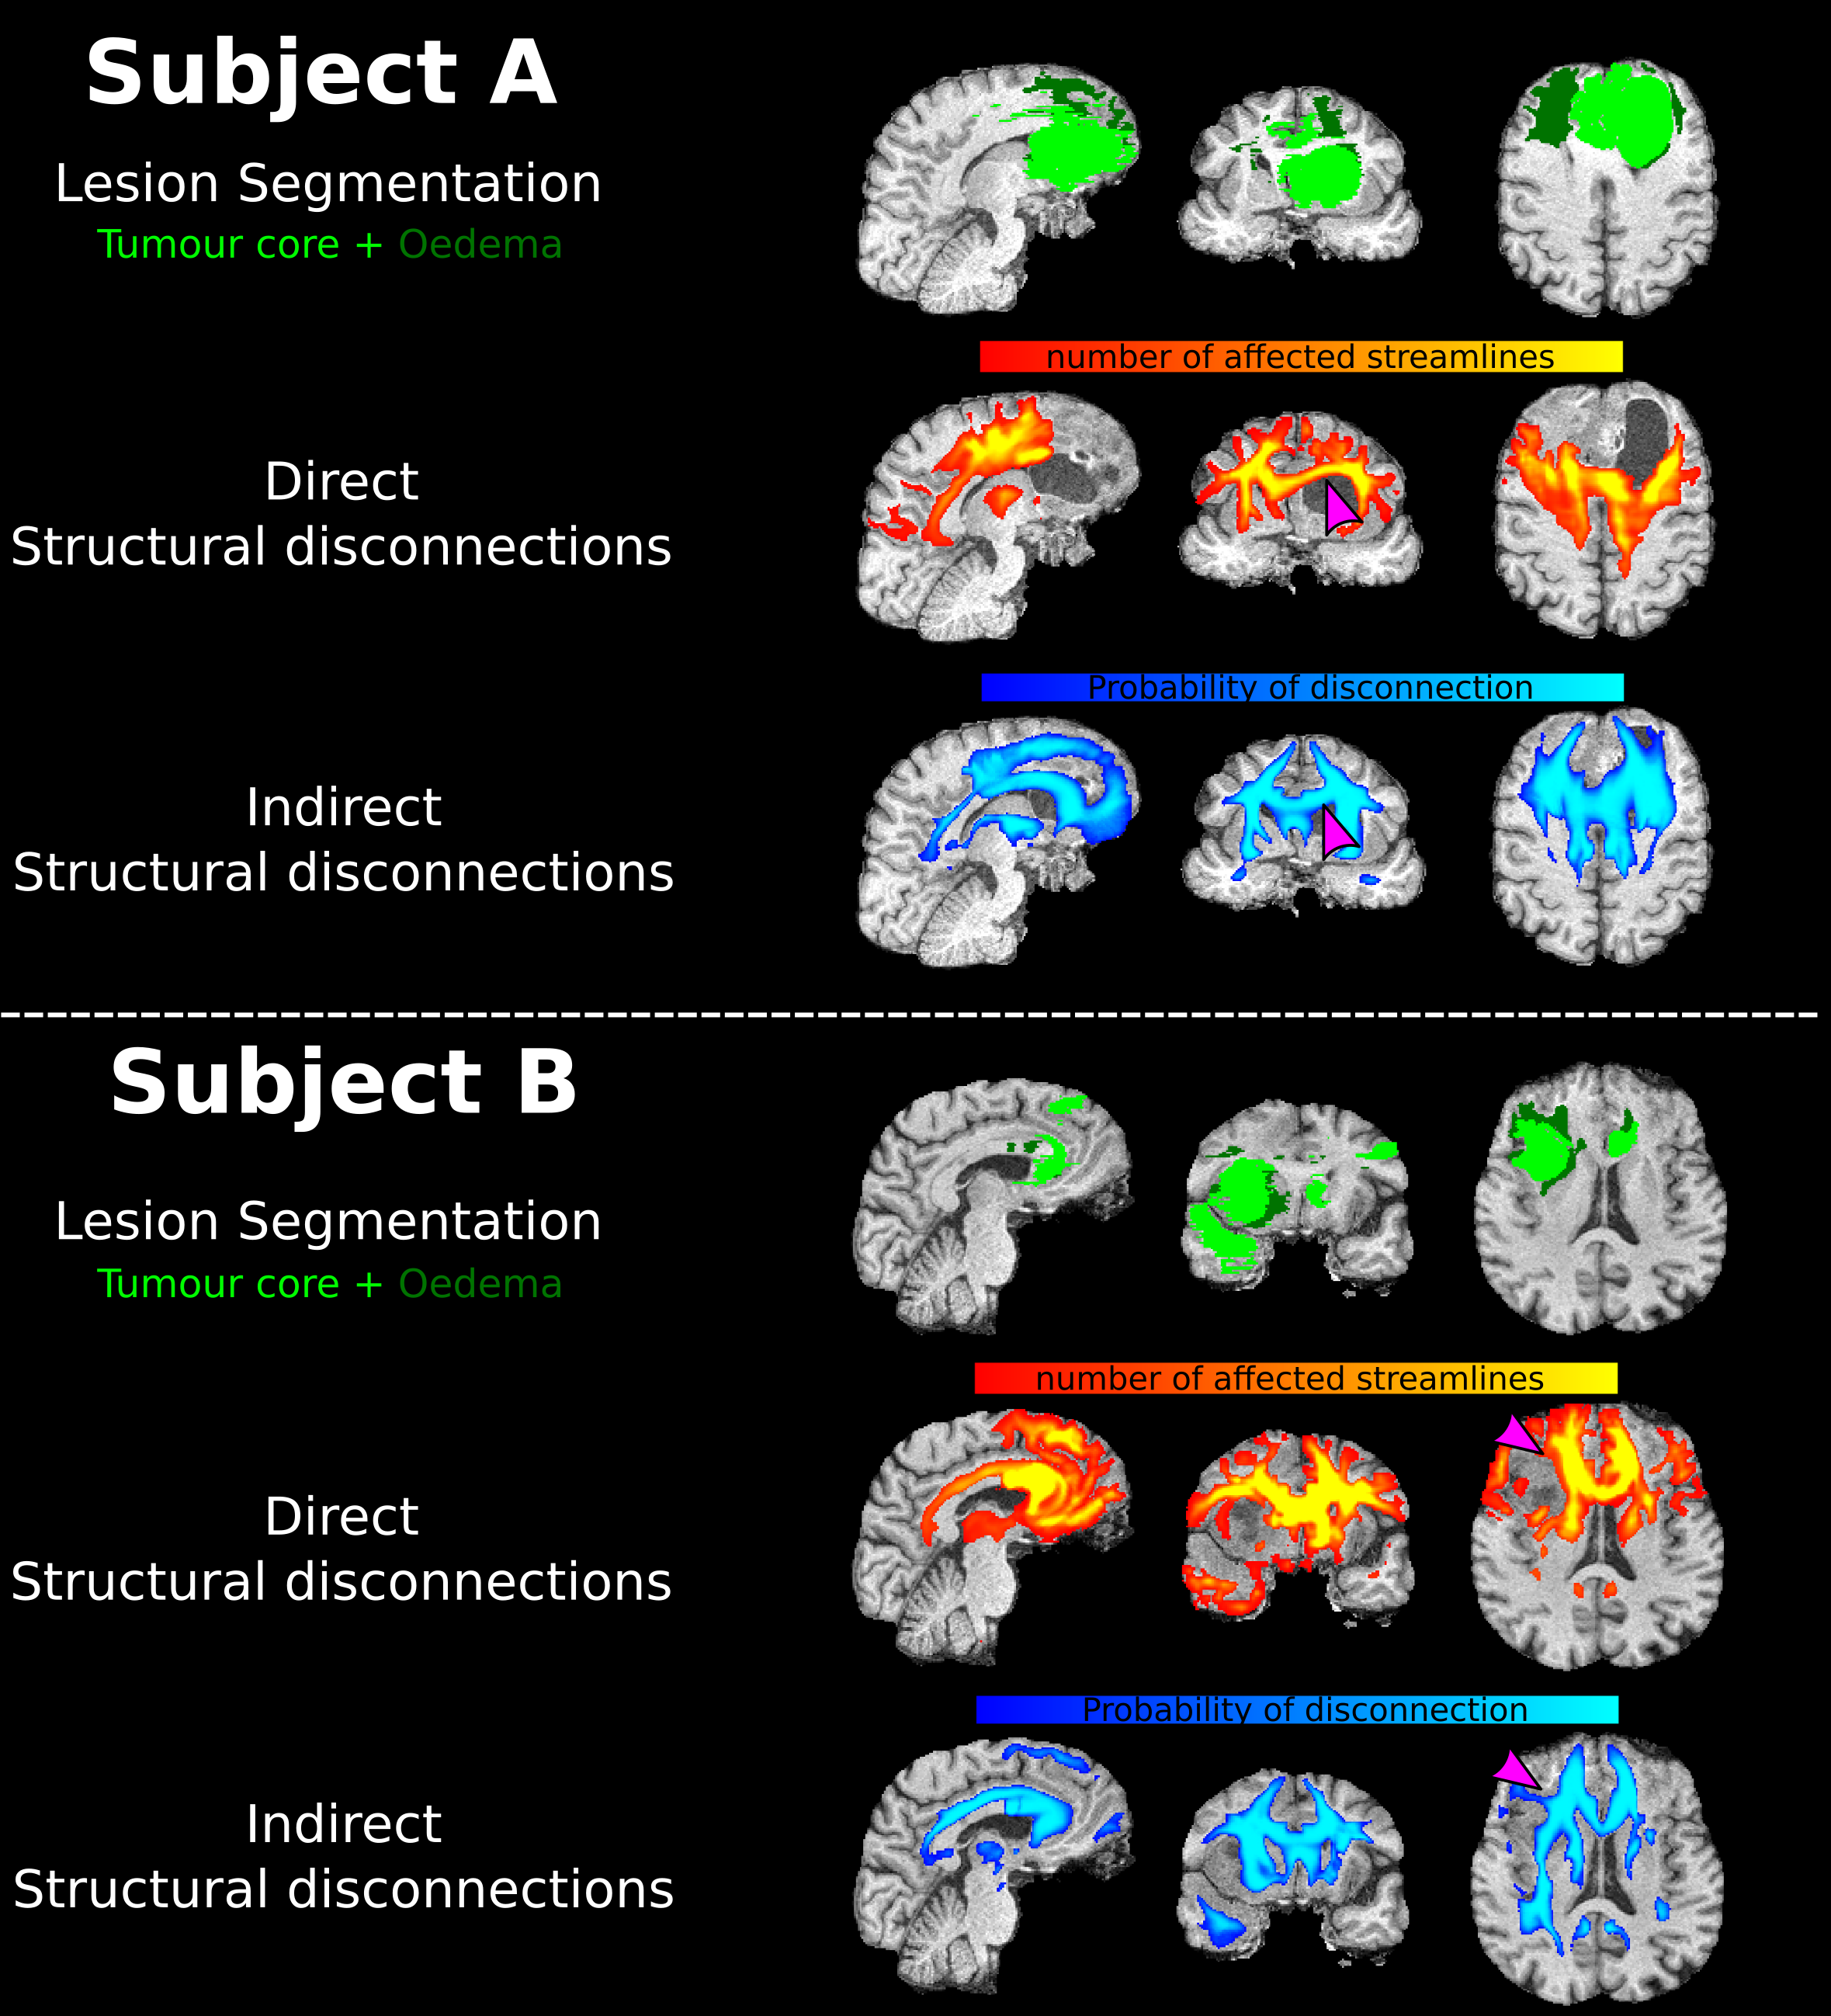
Figure 1 shows an example of the computed disconnection maps for two representative patients. Qualitatively, there is a good overlap between iSD and dSD maps, but some regions appear to be detected differently. Examples of divergence between the two maps, arguably imputable to fibre displacement effects, are highlighted in the figure using purple arrows. Figure 2A shows the Dice index boxplot for the 50 patients (min: 0.41, 25th percentile: 0.52, median: 0.57, 75th percentile: 0.59, max: 0.66). No extreme cases, where iSD and dSD maps were either identical or completely disjointed, were reported. Figure 2B shows the relationship between the Dice similarity index and the lesion extension. The non-linear trend is highlighted in red by the moving average. No significant relationship was found for lesions larger than 50 cm3.Discussion
Our analysis highlights important differences between iSD and dSD maps, which have a substantial overlap but present some significant differences in selected regions. Indeed, direct approaches present more fidelity in describing morphological alteration at the individual level. Moreover, they can highlight patient-specific pathological processes, such as the displacement of axonal fibres, which indirect methodologies are not able to portray. On the other hand, indirect methodologies are not affected by the Wallerian degeneration. This physio-pathological process may significantly impair the permeability of axons in areas surrounding the tumoral lesions, rendering them difficult to track with tractography algorithms11. Finally, the similarity between the two approaches is largely independent from the extension of the tumoral lesion, suggesting that the two maps detect feature physio-pathological differences regardless of the dimension of the lesion.Conclusion
Structural disconnection maps may play a crucial role both in explaining functional deficits in brain tumour patients and in highlighting which tracts could be preferential spreading paths for highly infiltrative gliomas. We analysed both direct and indirect approaches of quantifying such maps and, while we found a partial overlap between the two, they presented significant differences. Nevertheless, further studies linking patterns of disconnections to clinical variables are needed to assess their relevance in the clinical practice.Acknowledgements
No acknowledgement found.References
1. Ostrom QT, Bauchet L, Davis FG, et al. The epidemiology of glioma in adults: a “state of the science” review. Neuro Oncol. 2014;16(7):896-913. doi:10.1093/neuonc/nou087
2. Glenn C, Conner AK, Rahimi M, Briggs RG, Baker C, Sughrue M. Common Disconnections in Glioma Surgery: An Anatomic Description. Cureus. 2017;9(10). doi:10.7759/cureus.1778
3. Griffis JC, Metcalf N V., Corbetta M, Shulman GL. Structural Disconnections Explain Brain Network Dysfunction after Stroke. Cell Rep. 2019. doi:10.1016/j.celrep.2019.07.100
4. Thiebaut de Schotten M, Foulon C, Nachev P. Brain disconnections link structural connectivity with function and behaviour. Nat Commun. 2020;11(1):5094. doi:10.1038/s41467-020-18920-9
5. Salvalaggio A, De Filippo De Grazia M, Zorzi M, Thiebaut de Schotten M, Corbetta M. Post-stroke deficit prediction from lesion and indirect structural and functional disconnection. Brain. 2020;143(7):2173-2188. doi:10.1093/brain/awaa156
6. Foulon C, Cerliani L, Kinkingnéhun S, et al. Advanced lesion symptom mapping analyses and implementation as BCBtoolkit. Gigascience. 2018;7(3). doi:10.1093/gigascience/giy004
7. Zhang H, Schneider T, Wheeler-Kingshott CA, Alexander DC. NODDI: Practical in vivo neurite orientation dispersion and density imaging of the human brain. Neuroimage. 2012;61(4):1000-1016. doi:10.1016/j.neuroimage.2012.03.072
8. Smith RE, Tournier J-D, Calamante F, Connelly A. Anatomically-constrained tractography: improved diffusion MRI streamlines tractography through effective use of anatomical information. Neuroimage. 2012;62(3):1924-1938. doi:10.1016/j.neuroimage.2012.06.005
9. Jeurissen B, Tournier J-D, Dhollander T, Connelly A, Sijbers J. Multi-tissue constrained spherical deconvolution for improved analysis of multi-shell diffusion MRI data. Neuroimage. 2014;103:411-426. doi:10.1016/j.neuroimage.2014.07.061
10. Smith R, Tournier J-D, Calamante F, Connelly A. SIFT: Spherical-deconvolution informed filtering of tractograms. Neuroimage. 2013;67:298-312. doi:10.1016/j.neuroimage.2012.11.049
11. Pierpaoli C, Barnett A, Pajevic S, et al. Water diffusion changes in wallerian degeneration and their dependence on white matter architecture. Neuroimage. 2001;13(6):1174-1185. doi:10.1006/nimg.2001.0765
Figures