2498
Tumor infiltration beyond contrast enhancement and FLAIR hyperintensity at autopsy predicts survival in glioblastoma patients1Biophysics, Medical College of Wisconsin, Milwaukee, WI, United States, 2Radiology, Medical College of Wisconsin, Milwaukee, WI, United States, 3Pathology, Medical College of Wisconsin, Milwaukee, WI, United States, 4Neurology, Medical College of Wisconsin, Milwaukee, WI, United States, 5Neurosurgery, Medical College of Wisconsin, Milwaukee, WI, United States, 6Biostatistics, Medical College of Wisconsin, Milwaukee, WI, United States, 7Biomedical Engineering, Medical College of Wisconsin, Milwaukee, WI, United States
Synopsis
This study compared autopsy tissue samples to clinical MRI from glioblastoma (GBM) patients to assess the effects of tumor outside of T1-contrast enhancement and FLAIR hyperintensity on clinical characteristics and outcomes. Non-enhancing tumors were more frequent amongst patients who had a history of bevacizumab treatment and no history of Tumor Treating Fields treatment. Additionally, non-enhancing tumors were associated with shorter overall survival times. These results suggest that non-enhancing tumors have clinically significant correlates and may result in worse survival outcomes for GBM patients.
Introduction
Glioblastoma (GBM) is a malignant central nervous system tumor with a median survival time of around 15 months1. Progression and treatment response of GBM is monitored using multi-parametric MR imaging, primarily through contrast enhanced T1-weighted imaging (T1C) and T2-weighted fluid attenuated inversion recovery (FLAIR). T1C uses a gadolinium contrast agent to identify areas where the blood-brain barrier has been disrupted by tumor activity and is commonly used to calculate tumor volume2–4. Areas of FLAIR hyperintensity are thought to non-selectively highlight both areas of infiltrative tumor and vasogenic edema resulting from treatment and tumor growth5–7. Despite their prognostic utility, recent studies examining autopsy tissue have found tumor well beyond the imaging defined boundary, suggesting that areas of tumor may be missed all together by conventional MRI interpretation alone. This study sought to examine the frequency and clinical features of these non-enhancing tumor regions in glioblastoma patients using autopsy tissue data aligned to the patient’s clinical imaging. Specifically, we tested the hypothesis that patients with tumor outside T1C enhancement (TOC) and tumor outside FLAIR hyperintensity (TOF) would be associated with lower overall survival.Methods
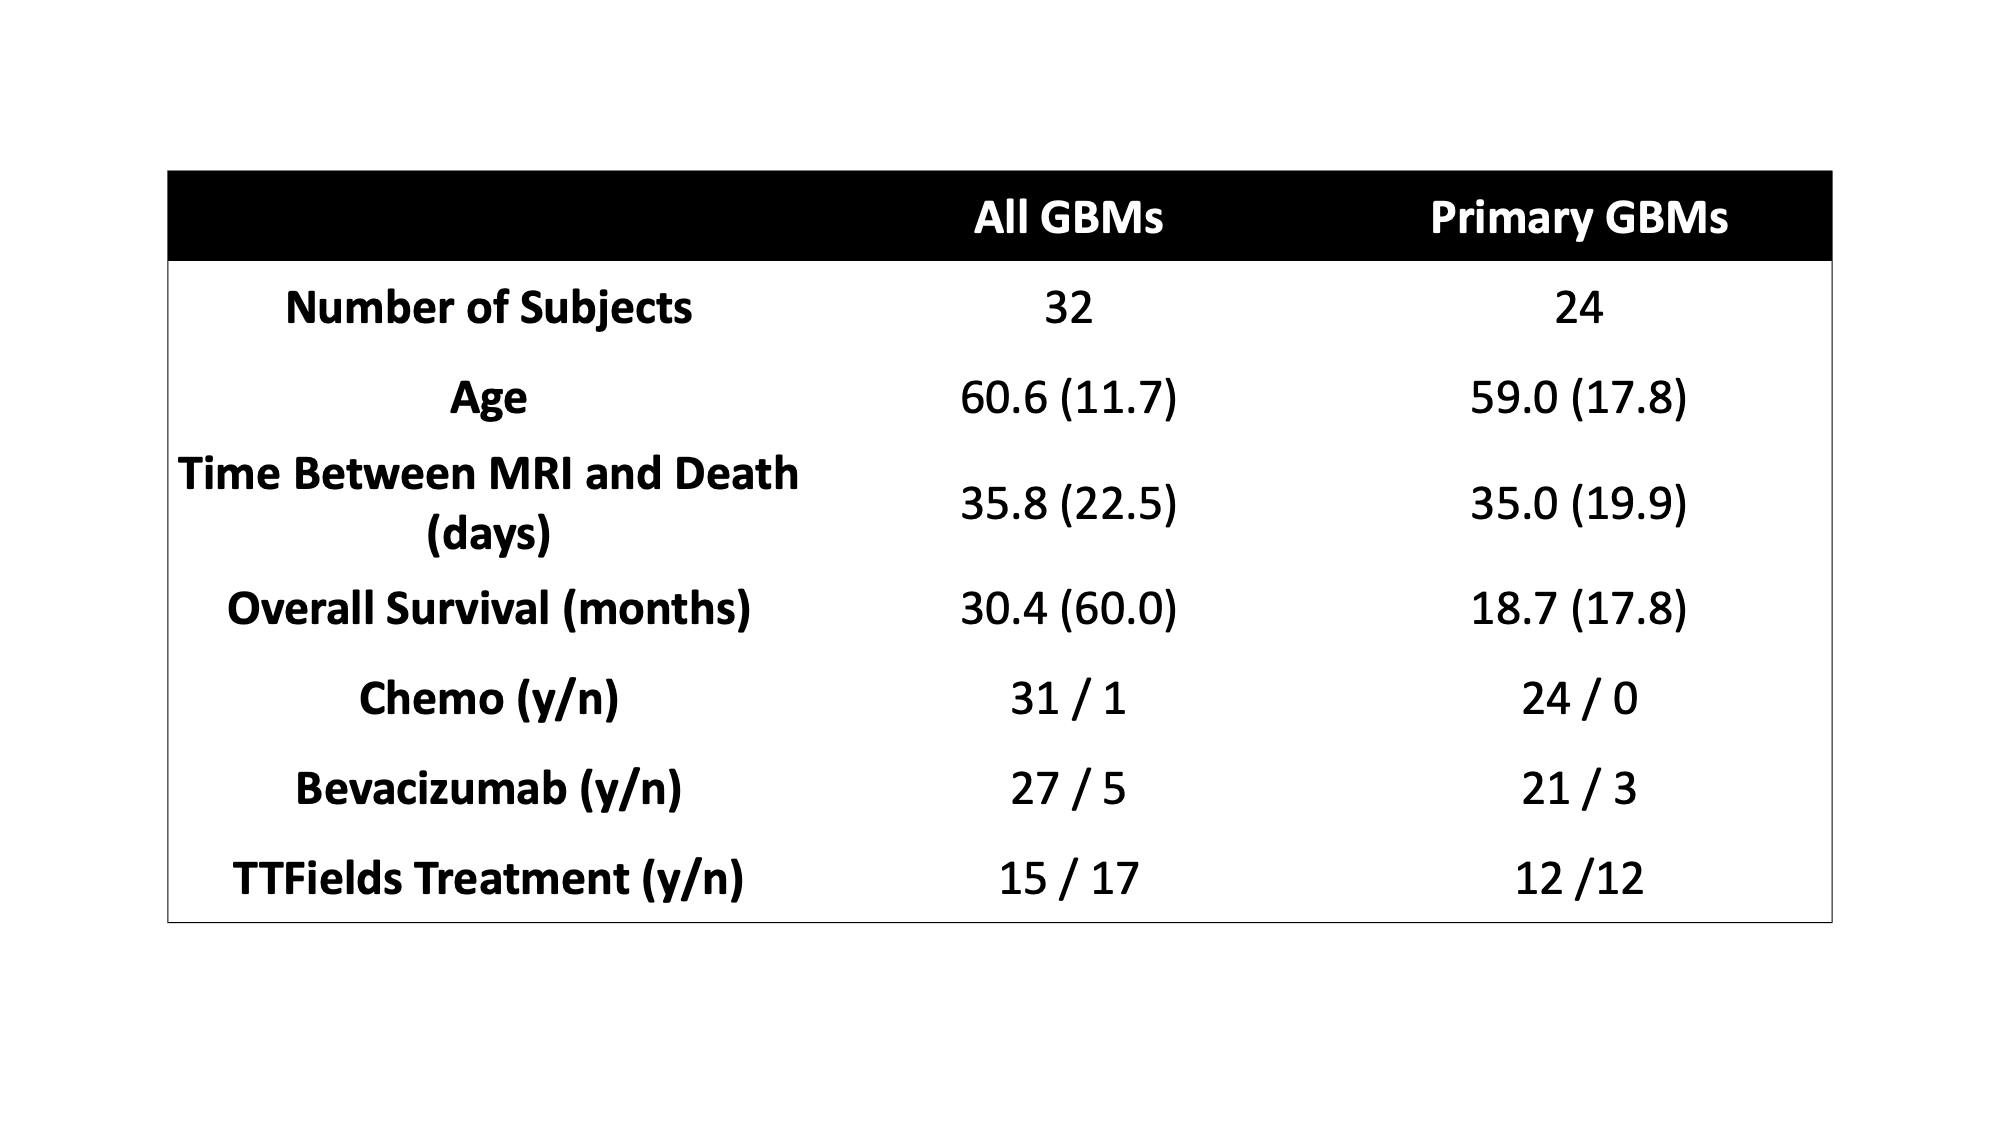
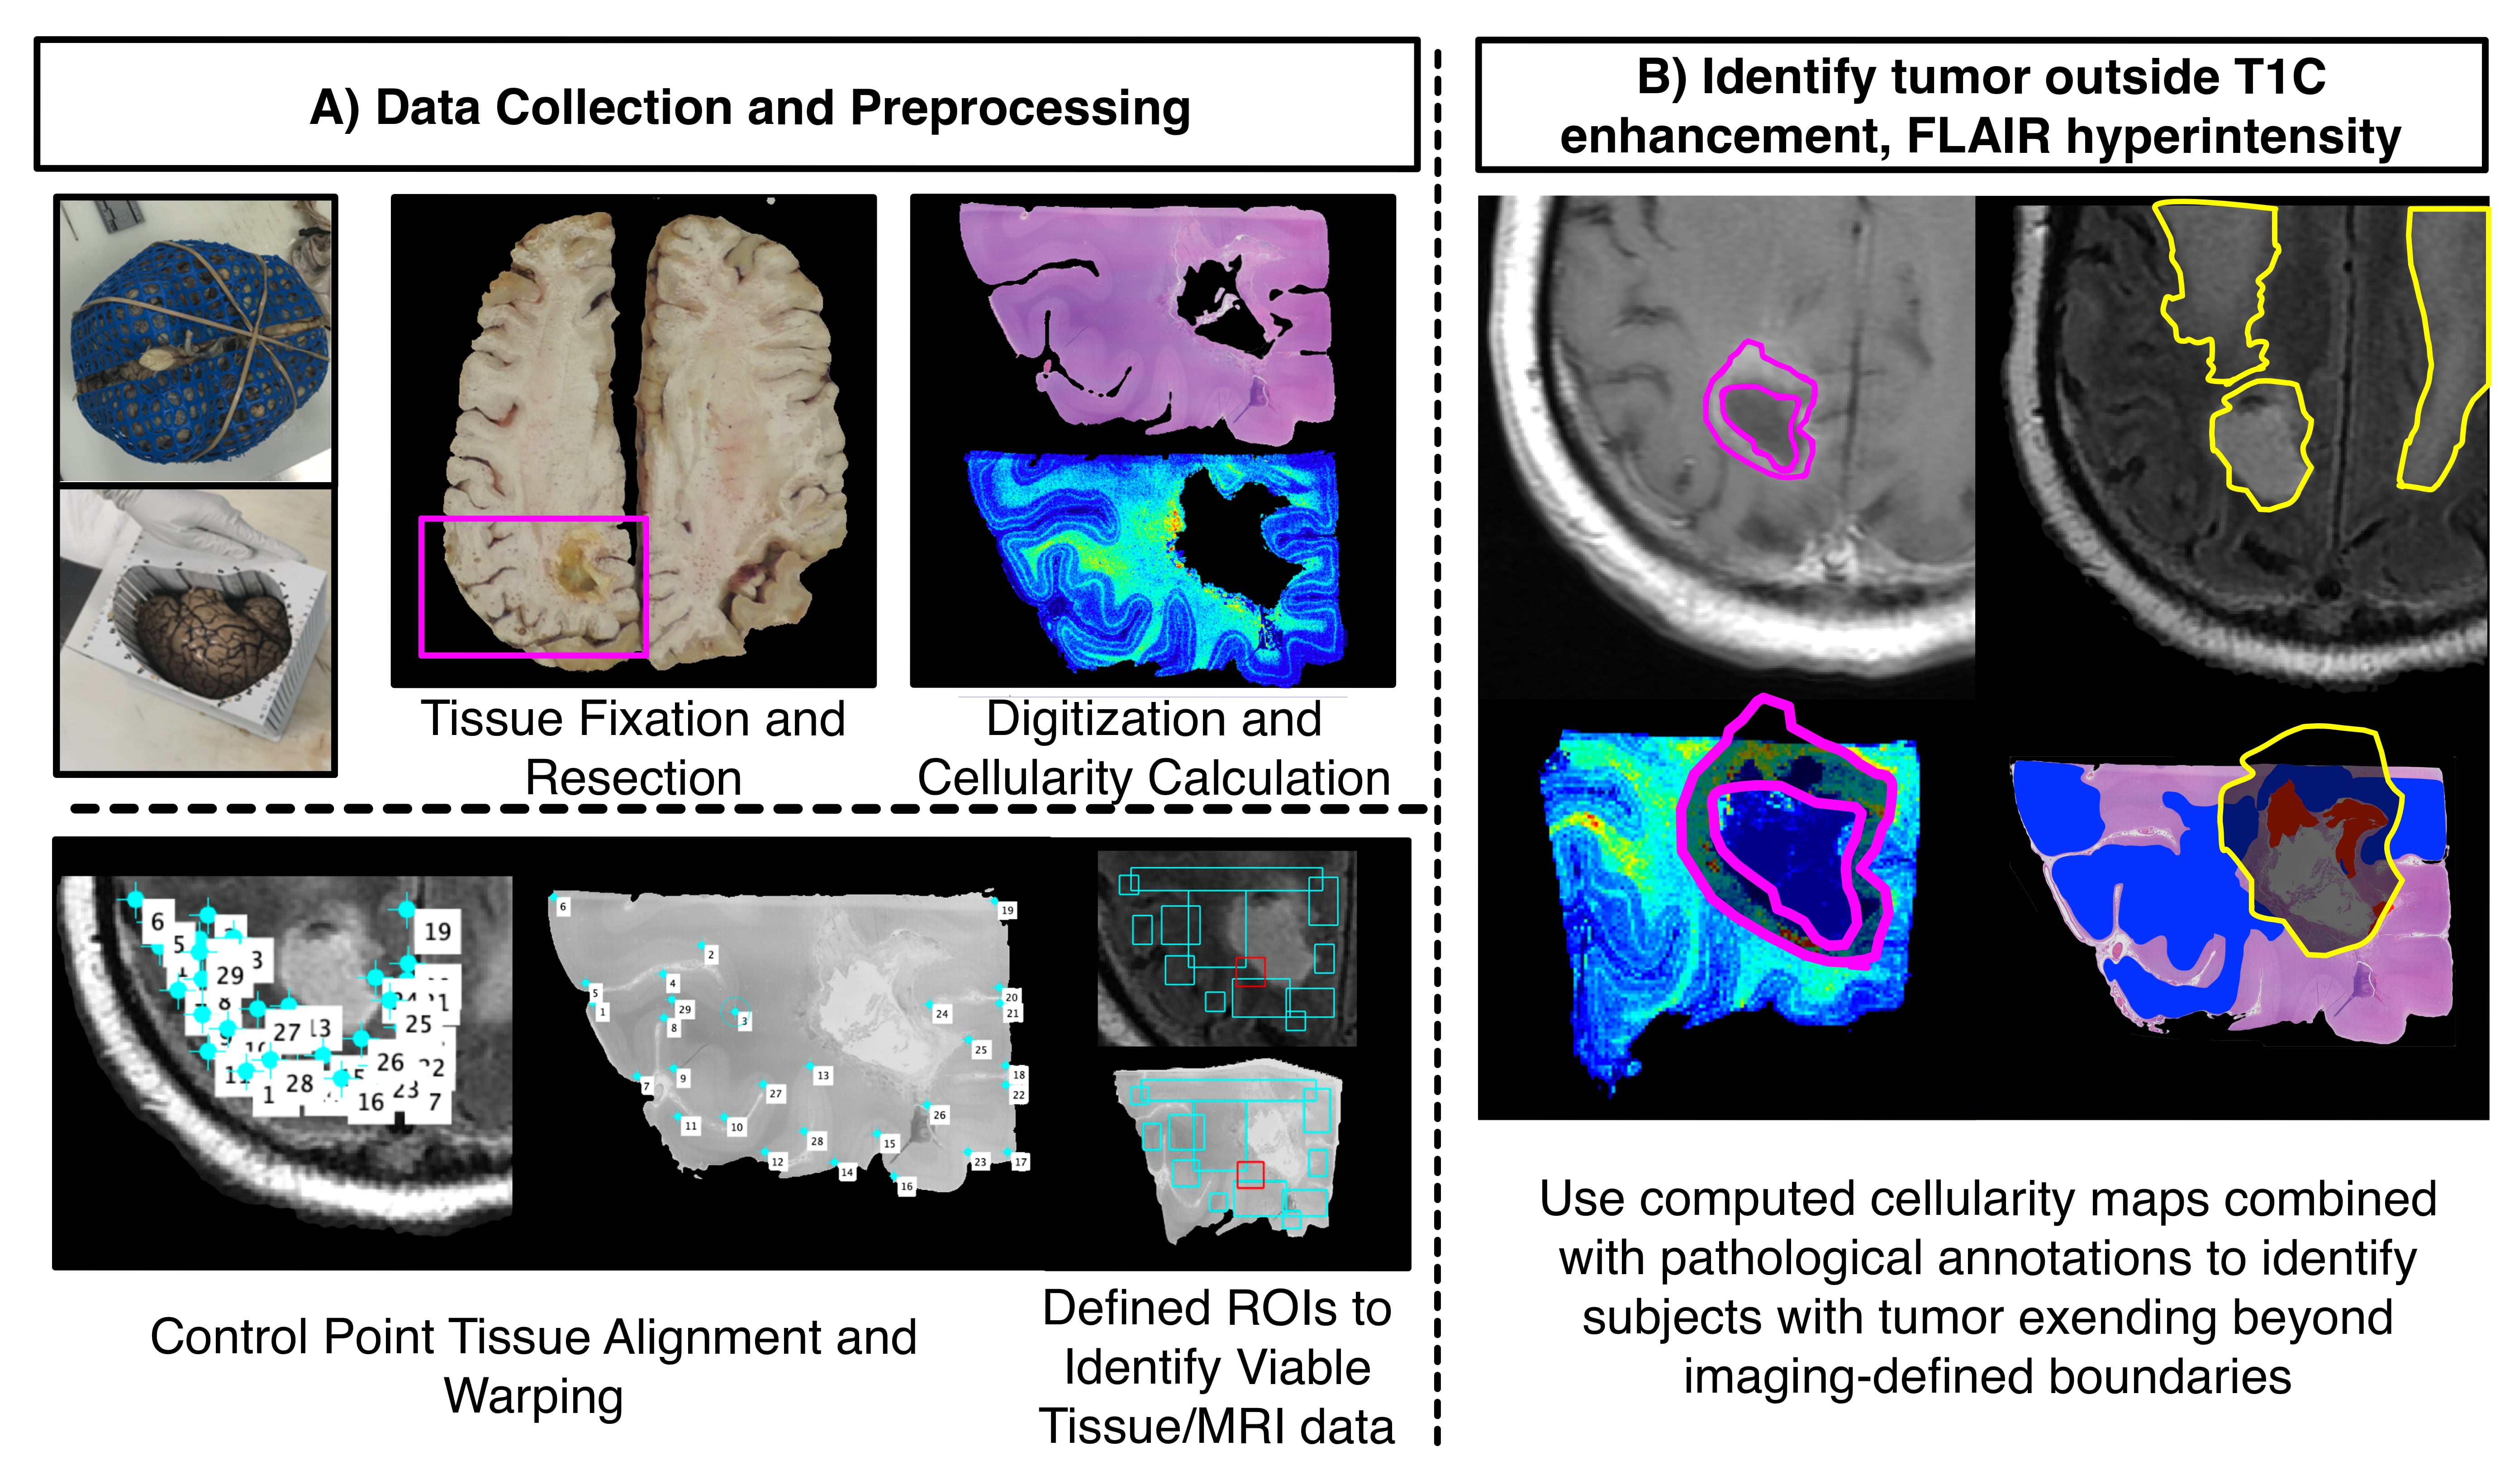
A total of 69 patients within our brain bank were screened for this study. Inclusion criteria required pathological confirmation of GBM, radiation treatment, and an MRI within 90 days of death. A total of 32 patients met this criteria with 24 being diagnosed with GBM at first surgery. Patient demographics are presented in Table 1. A diagram for the data collection and processing is presented in Figure 1. At autopsy, 84 tissue samples across all patients (~3 per patient) were collected from suspected tumor regions, processed and stained for hematoxylin and eosin (HE) and digitized at 40X resolution (0.2 microns/pixel) using a sliding stage microscope. The digitized slides were automatically segmented to calculate cell density across the slide using a color deconvolution algorithm8. A subset of 33 slides was also annotated for pathological features of GBM to distinguish regions of non-tumor hypercellularity (i.e., immune response) from true tumor. Tissue samples and their calculated features were then nonlinearly aligned to each patients’ last MRI prior to death using a custom control-point-based software tool9–12. Subjects were then manually coded for presence of TOC and TOF using the aligned histology and the T1C/FLAIR images. Independent samples t-tests and chi-squared tests were used to identify demographic and clinical features that differed between patients with and without TOC and TOF. Cox proportional hazards models were then used to identify survival differences between patients with and without TOC and TOF, using treatment presence (Tumor Treating Fields (TTFields) and bevacizumab) and time between MRI and death as covariates. Analyses were computed separately for both the full dataset and the primary GBM dataset to compare effects between subtypes.Results
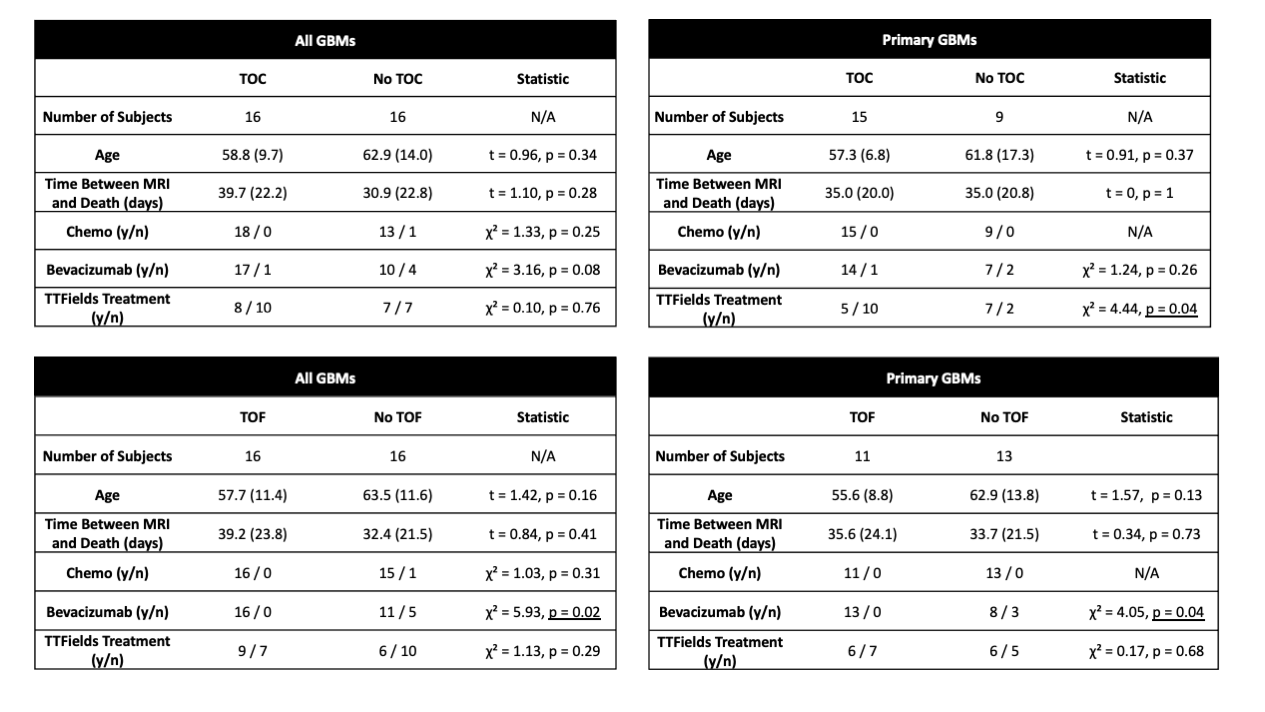
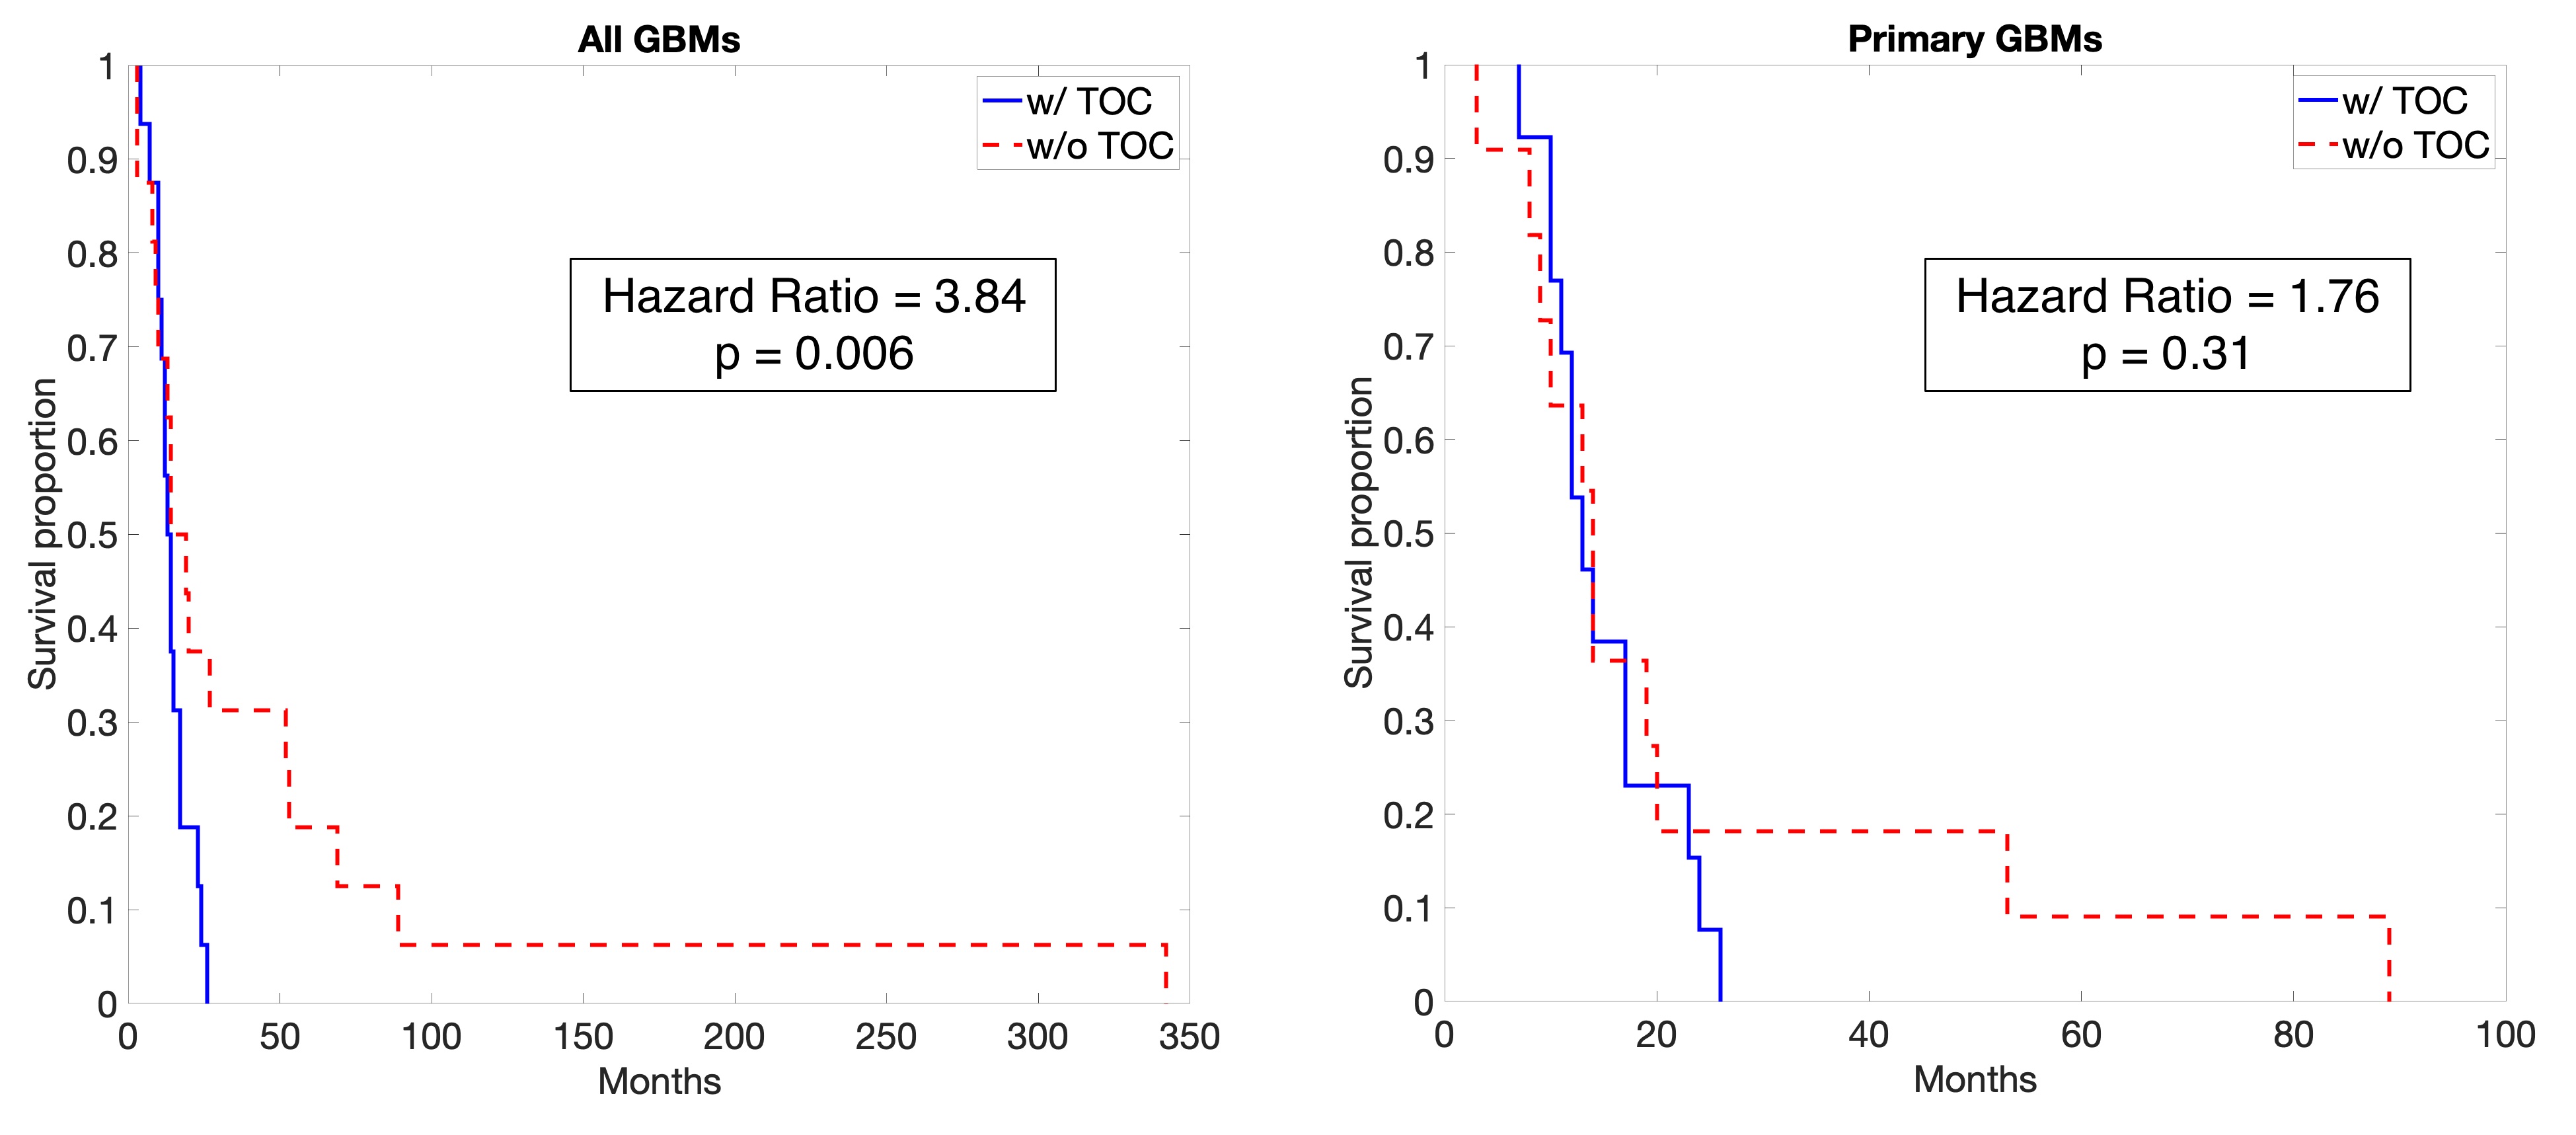
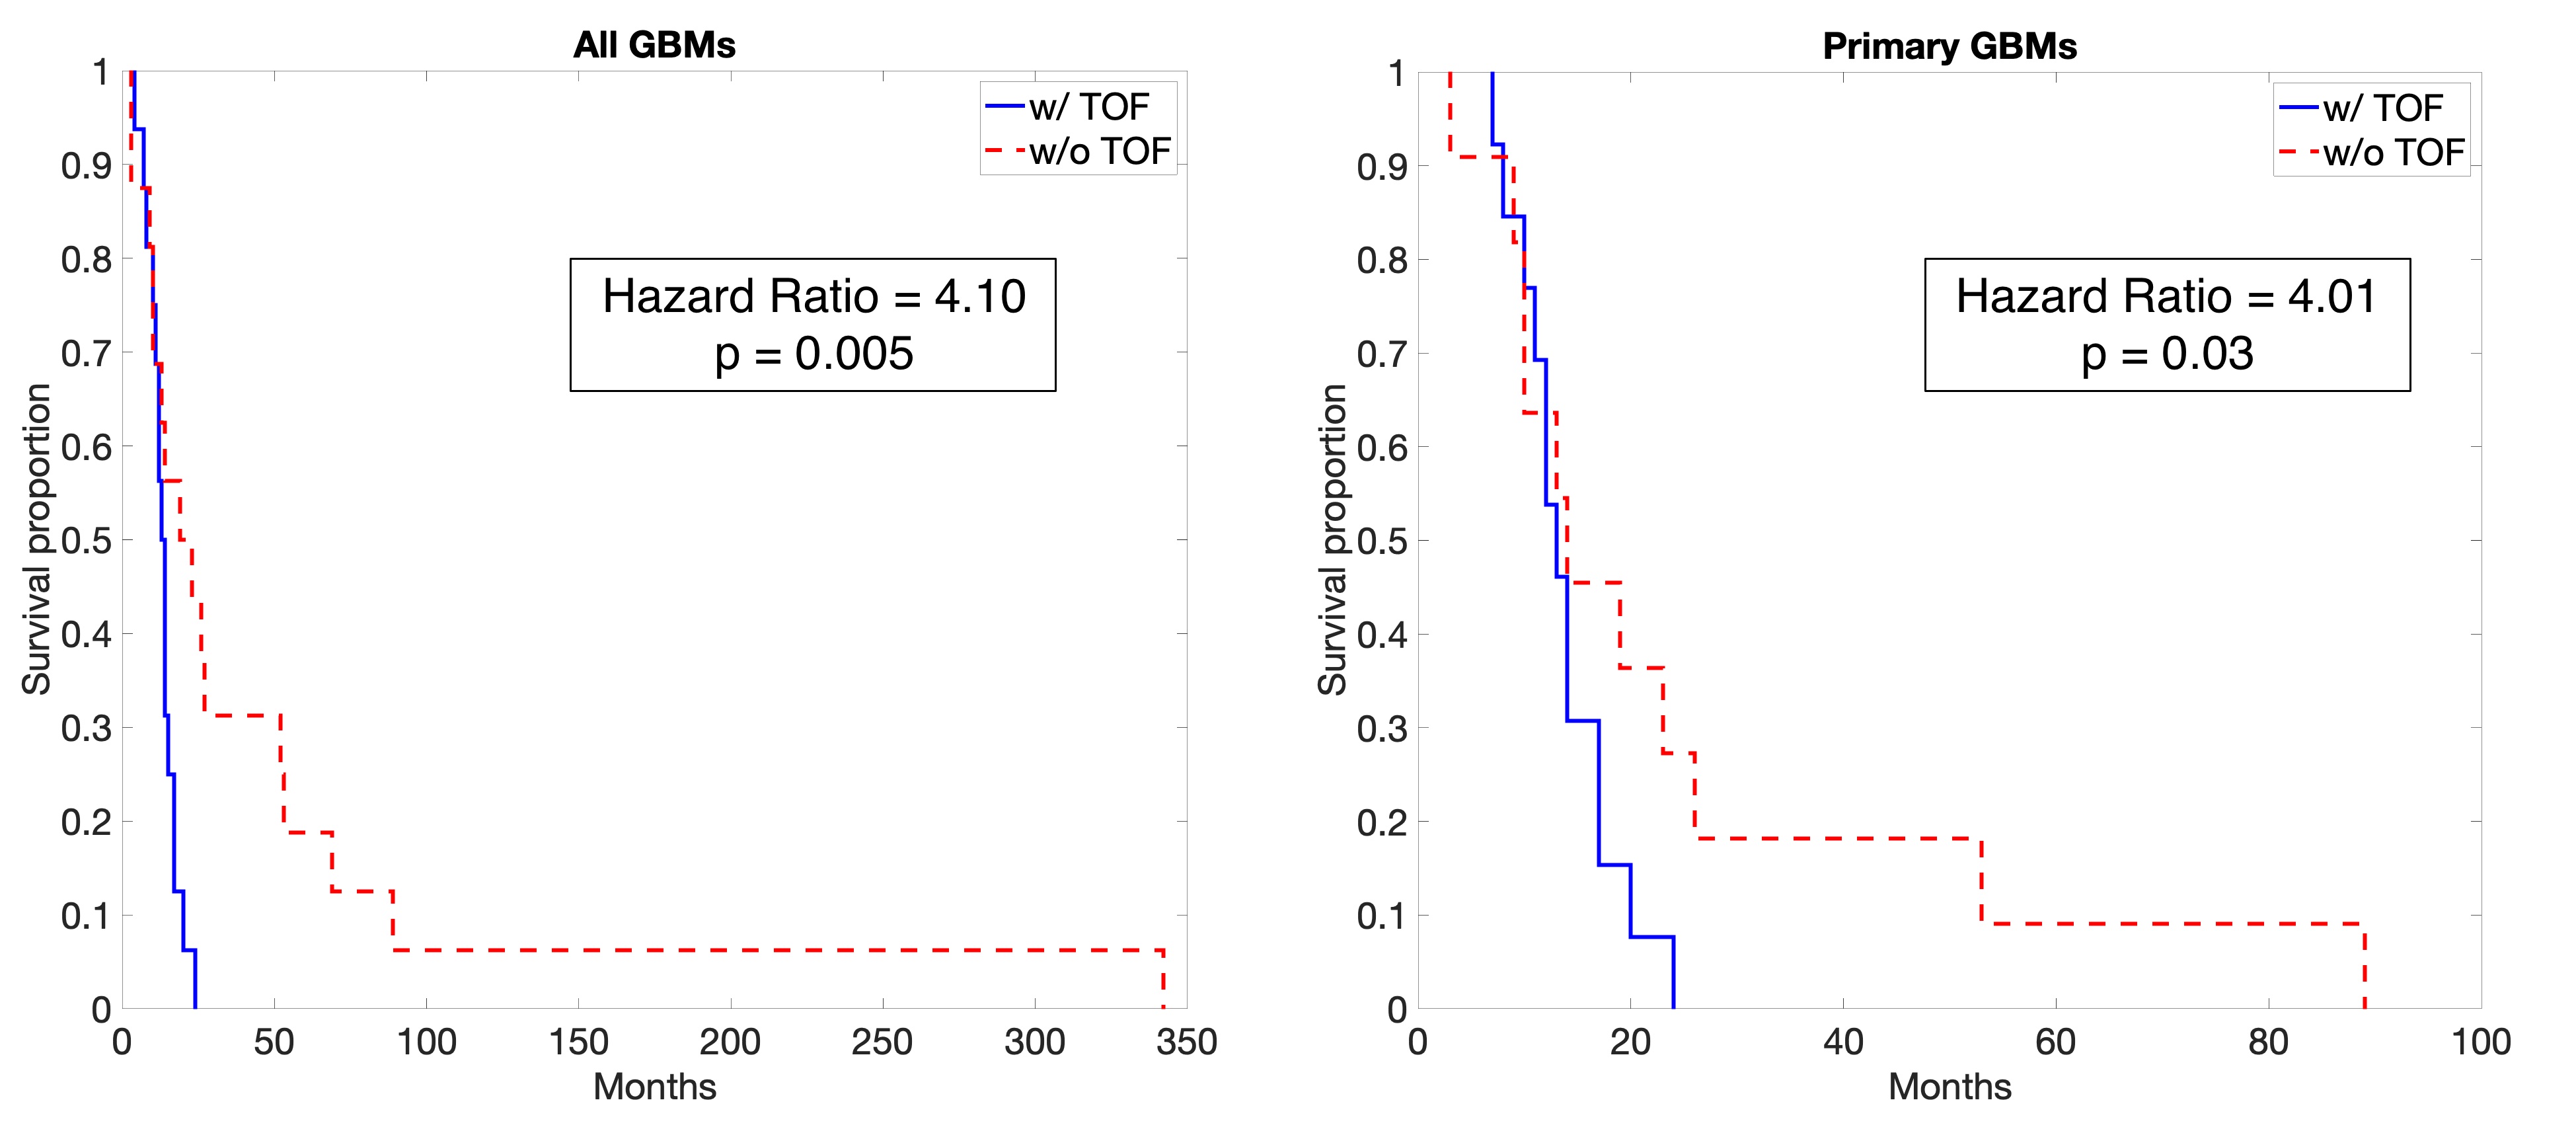
A summary of demographic and clinical differences between TOF/TOC patients and those without TOC/TOF is presented in Figure 2. Overall, TOC and TOF were observed in 50% of GBM patients, with a 62.5% TOC rate and 45.8% TOF rate observed for the primary GBM data set. Differences in treatment were observed for some subsets, including higher TOC rates in primary GBMs patients who did not receive TTFields treatment (χ² = 4.44, p = 0.04) and higher TOF rates in patients who did receive bevacizumab treatment (All: χ² = 5.93, p = 0.02, Primary: χ² = 4.05, p = 0.04). Figure 3 depicts Kaplan-Meier curves and hazard ratios for TOC presence in both groups, which show that TOC is associated with reduced survival rates amongst all GBMs (HR = 3.84, p = 0.006). Figure 4 shows similar plots for TOF, which demonstrate reduced survival rates for all GBMs (HR = 4.10, p = 0.005) as well as primary GBMs (4.01, p = 0.03).Discussion
These results demonstrate that TOC and TOF are prevalent at autopsy amongst GBM patients. As this study did not sample the whole brain for tissue processing, we are likely underestimating the extent of this characteristic, so the approximately 50% of patients with non-enhancing tumors should be considered as a minimum value of prevalence. Additionally, the presence of TOC and TOF is associated with different treatment administrations, as well as overall patient survival. The influence of treatment on the presence of non-enhancing tumor at autopsy follows expected data, as treatments such as bevacizumab are known to influence the appearance of tumors on imaging11,13,14. The decreased survival rates observed for TOC/TOF could be attributed to the presence of tumor infiltrating beyond the imaging-defined margin being spared treatment or could be the result of rapidly growing tumors that proliferate at rates that would be difficult to image serially. Future studies comparing tumor growth rates to histological appearance at autopsy may be able to discern between these effects.Conclusion
This study demonstrated that GBM patients with TOF/TOC have lower survival rates, increased bevacizumab usage, and decreased TTFields usage than those with well-circumscribed tumors.Acknowledgements
We would like to thank our patients for their participation in this study, the Medical College of Wisconsin Machine Learning Working Group for helpful feedback and discussions, and our funding sources: American Brain Tumor Association Grant DG160004, Froedtert Foundation, Strain for the Brain 5K Run, Milwaukee, WI, NIH/NCI R01CA218144, R01CA218144-02S1, R21CA231892, and R01CA249882.References
1. Ostrom QT, Bauchet L, Davis FG, et al. The epidemiology of glioma in adults: a “state of the science” review. Neuro Oncol 2014;16:896–913.
2. Smits M, van den Bent MJ. Imaging Correlates of Adult Glioma Genotypes. Radiology 2017;284:316–31.
3. Ellingson BM, Aftab DT, Schwab GM, et al. Volumetric response quantified using T1 subtraction predicts long-term survival benefit from cabozantinib monotherapy in recurrent glioblastoma. Neuro Oncol 2018;20:1411–8.
4. Ellingson BM, Wen PY, Cloughesy TF. Evidence and context of use for contrast enhancement as a surrogate of disease burden and treatment response in malignant glioma. Neuro Oncol 2018;20:457–71.
5. Hawkins-Daarud A, Rockne RC, Anderson ARA, et al. Modeling Tumor-Associated Edema in Gliomas during Anti-Angiogenic Therapy and Its Impact on Imageable Tumor. Front Oncol 2013;3:66.
6. Artzi M, Aizenstein O, Jonas-Kimchi T, et al. FLAIR lesion segmentation: application in patients with brain tumors and acute ischemic stroke. Eur J Radiol 2013;82:1512–8.
7. Garrett MD, Yanagihara TK, Yeh R, et al. Monitoring Radiation Treatment Effects in Glioblastoma: FLAIR Volume as Significant Predictor of Survival. Tomogr (Ann Arbor, Mich) 2017;3:131–7.
8. Ruifrok AC, Johnston DA. Quantification of histochemical staining by color deconvolution. Anal Quant Cytol Histol 2001;23:291–9.
9. Bobholz SA, Lowman AK, Barrington A, et al. Radiomic Features of Multiparametric MRI Present Stable Associations With Analogous Histological Features in Patients With Brain Cancer. Tomogr (Ann Arbor, Mich) 2020;6:160–9.
10. McGarry SD, Bukowy JD, Iczkowski KA, et al. Gleason Probability Maps: A Radiomics Tool for Mapping Prostate Cancer Likelihood in MRI Space. Tomogr (Ann Arbor, Mich) 2019;5:127–34.
11. Nguyen HS, Milbach N, Hurrell SL, et al. Progressing Bevacizumab-Induced Diffusion Restriction Is Associated with Coagulative Necrosis Surrounded by Viable Tumor and Decreased Overall Survival in Patients with Recurrent Glioblastoma. AJNR Am J Neuroradiol 2016;37:2201–8.
12. LaViolette PS, Mickevicius NJ, Cochran EJ, et al. Precise ex vivo histological validation of heightened cellularity and diffusion-restricted necrosis in regions of dark apparent diffusion coefficient in 7 cases of high-grade glioma. Neuro Oncol 2014;16:1599–606.
13. Ellingson BM, Kim HJ, Woodworth DC, et al. Recurrent glioblastoma treated with bevacizumab: contrast-enhanced T1-weighted subtraction maps improve tumor delineation and aid prediction of survival in a multicenter clinical trial. Radiology 2014;271:200–10.
14. Kim MM, Umemura Y, Leung D. Bevacizumab and Glioblastoma: Past, Present, and Future Directions. Cancer J 2018;24:180–6.
Figures