2496
Analysis of postural effect on kidney volume using multiposture MRI1Division of Health Sciences, Graduate School of Medical Sciences, Kanazawa University, Kanazawa, Ishikawa, Japan
Synopsis
We assessed the effect of posture on kidney volume measured in the supine and upright positions using an original MRI system that can image in any posture (multiposture MRI). We compared the kidney volume (whole kidney, renal cortex, medulla, and pelvis) between the supine and upright positions. Upright position reduced whole kidney, renal cortex, and medulla volumes, and these differences between postures potentially provide new diagnostic information.
INTRODUCTION
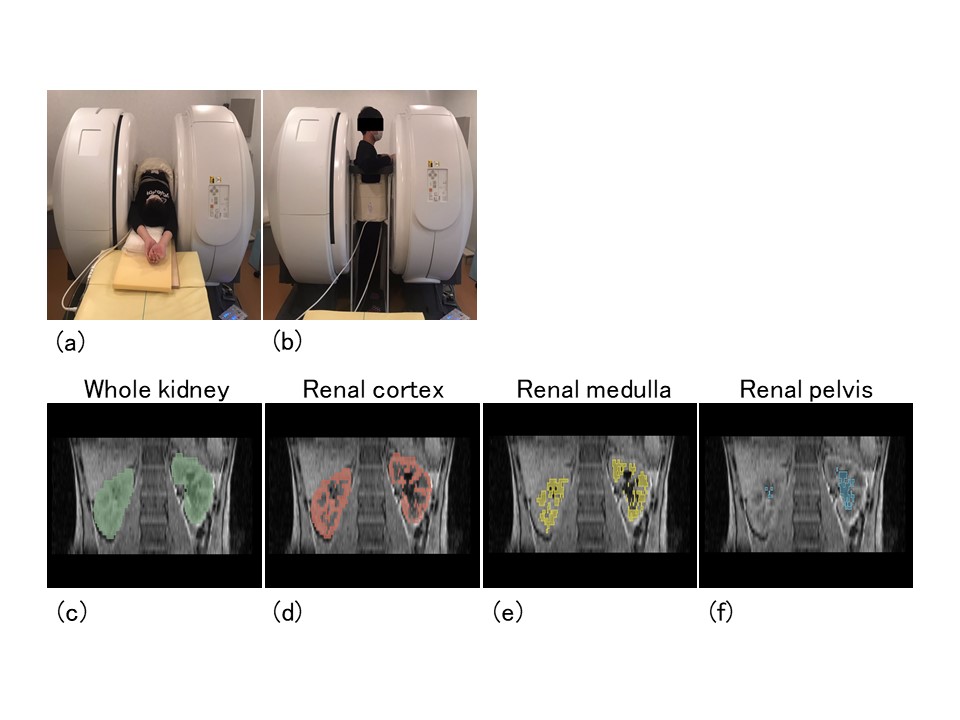
Measurement of kidney volume is important for early detection and monitoring of kidney diseases.1 Nevertheless, it is unclear how kidney volume is altered by postural changes, i.e., differences in the effects of gravity. In this study, we evaluated the postural effect on kidney volume in the supine and upright positions using an original magnetic resonance imaging (MRI) system that can image in any posture (multiposture MRI).2MATERIALS AND METHODS
Kidney volume was evaluated in seven healthy volunteers (mean age, 22.7 ± 1.0 years; body mass index, 20.5 ± 1.0 kg/m2) in the supine and upright positions using multiposture MRI (0.4 T) (Figs. 1a and b). Coronal T1-weighted images of the right and left kidneys in the supine and upright positions were obtained using a breath-hold 3D gradient-echo sequence. Then, right and left kidney volumes (whole kidney, renal cortex, medulla, and pelvis) were measured and compared between postures (Figs. 1c–f).RESULTS AND DISCUSSION
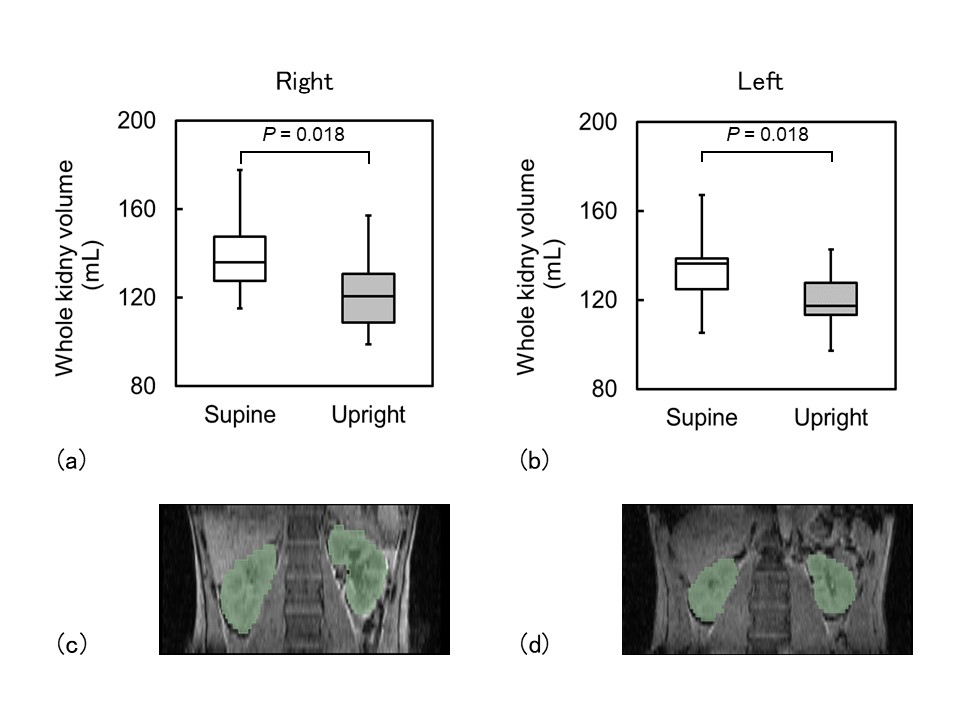
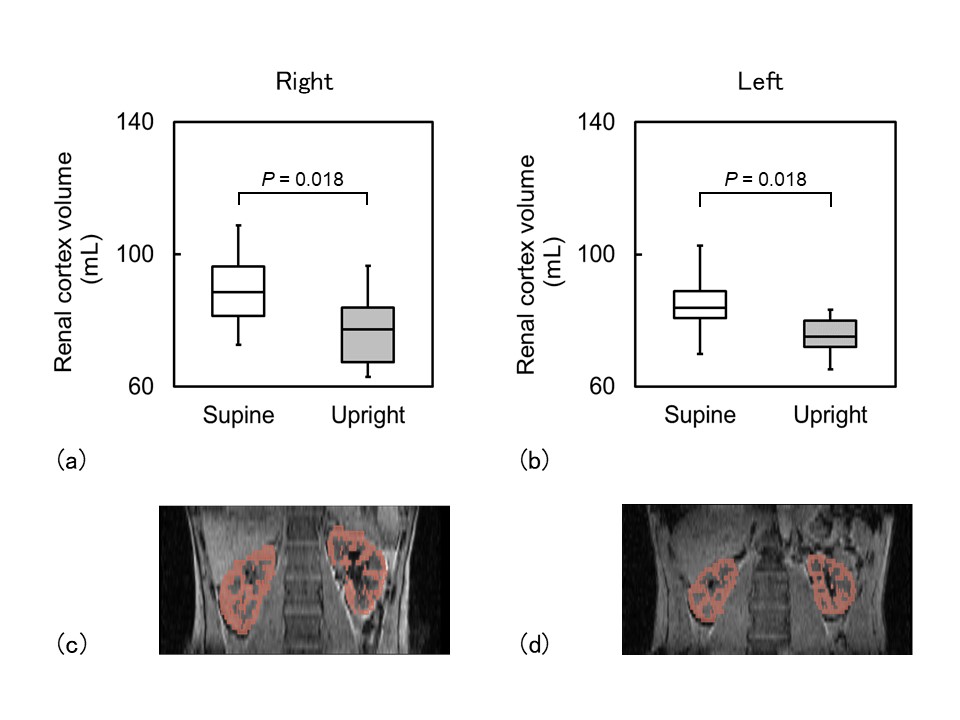
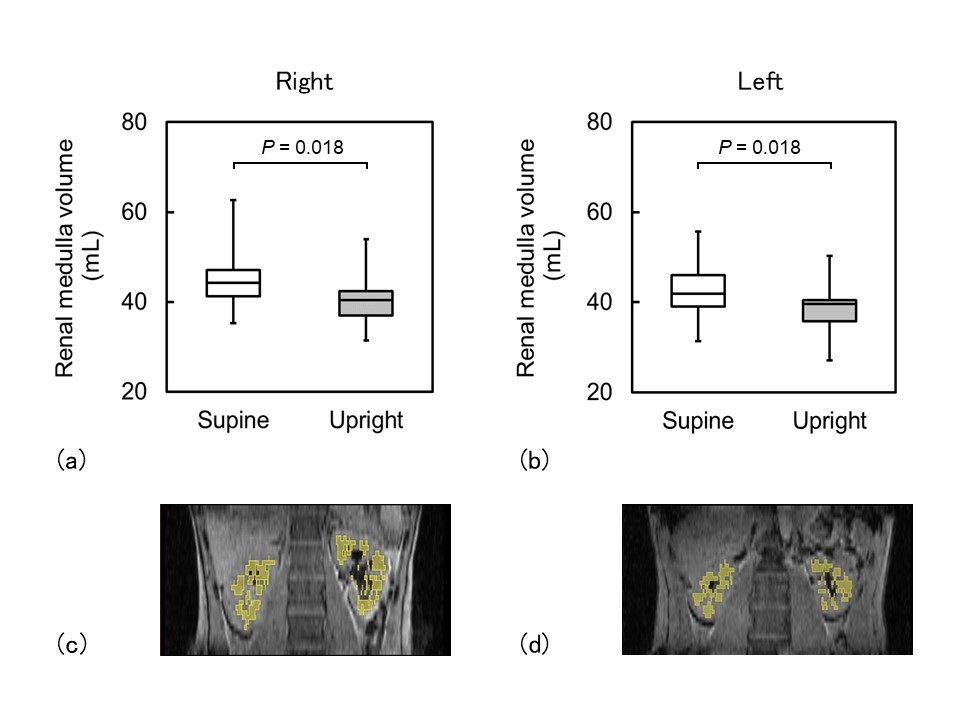
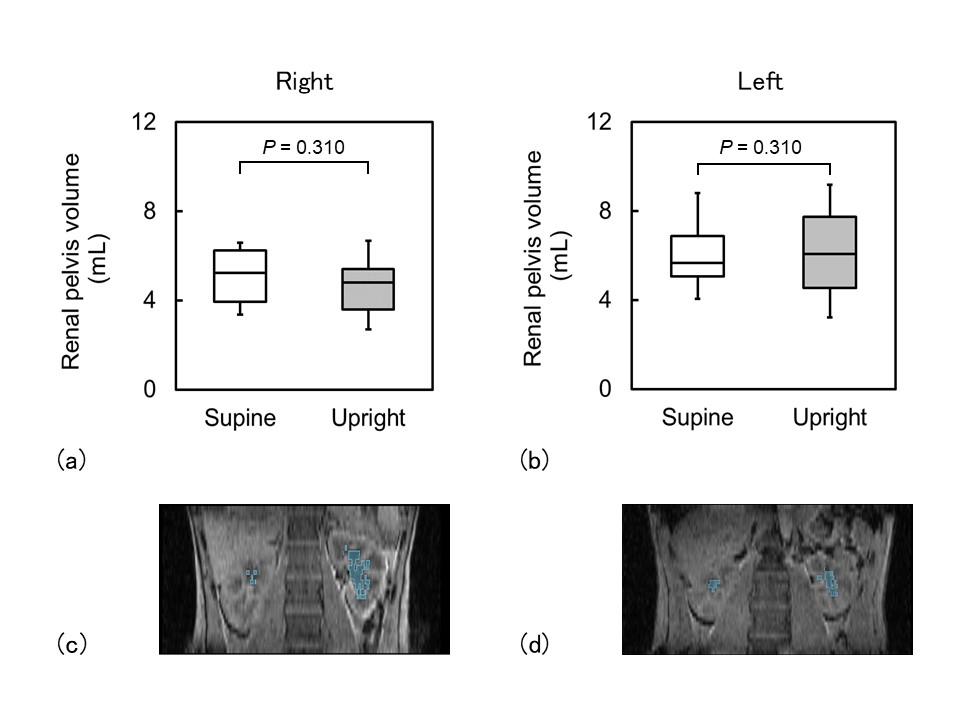
The whole kidney volume in the upright position (right kidney, 122.3 ± 20.1 mL; left kidney, 120.0 ± 14.5 mL) was significantly smaller than that in the supine position (right kidney, 139.9 ± 21.0 mL; left kidney, 133.8 ± 18.9 mL) for both right and left kidneys (P < 0.05 for both) (Figs. 2a and b). The renal cortex volume in the upright position (right kidney, 77.0 ± 12.2 mL; left kidney, 75.3 ± 6.3 mL) was significantly smaller than that in the supine position (right kidney, 89.3 ± 12.9 mL; left kidney, 85.0 ± 10.1 mL) for both right and left kidneys (P < 0.05 for both) (Figs. 3a and b). The renal medulla volume in the upright position (right kidney, 40.6 ± 7.3 mL; left kidney, 38.5 ± 7.1 mL) was significantly smaller than that in the supine position (right kidney, 45.5 ± 8.7 mL; left kidney, 42.7 ± 7.7 mL) for both right and left kidneys (P < 0.05 for both) (Figs. 4a and b). These results indicate a decrease in blood volume3 and urine volume4 due to the fluid shift effect during standing, and potentially provide new diagnostic information on the regulatory functions to the gravity as compared with the standard MRI examination of the kidney. However, no significant difference was observed in renal pelvis volume between the supine and upright positions for both right and left kidneys (Figs. 5a and b).CONCLUSION
Upright position reduces kidney volume. Multiposture MRI enables the assessment of the postural effect on kidney volume.Acknowledgements
No acknowledgement found.References
1. Will S, et al., Automated segmentation and volumetric analysis of renal cortex, medulla, and pelvis based on non-contrast-enhanced T1- and T2-weighted MR images. MAGMA. 2014; 27: 445-54.
2. Kadoya Y, et al., Effect of gravity on portal venous flow: Evaluation using multiposture MRI. J Magn Reson Imaging. 2019; 50: 83-7.
3. Smith JJ, et al., Hemodynamic response to the upright posture. J Clin Pharmacol. 1994; 34: 375-86.
4. Ni TG, et al., On the influence of posture on kidney function. J Physiol. 1931; 71: 331-9.
Figures