2493
Multiparametric MR imaging in diabetic nephropathy: New insights to evaluate early diabetic nephropathy noninvasively
Akira Yamamoto1, Tsutomu Tamada2, Yu Ueda3, Mitsuru Takeuchi4, Ayumu Kido2, Atsushi Higaki2, and Akihiko Kanki2
1Radiology, Kawasaki Medical School, Kurashiki, Japan, 2Kawasaki Medical School, Kurashiki, Japan, 3Phillips Japan, Tokyo, Japan, 4Radiolonet Tokai, Nagoya, Japan
1Radiology, Kawasaki Medical School, Kurashiki, Japan, 2Kawasaki Medical School, Kurashiki, Japan, 3Phillips Japan, Tokyo, Japan, 4Radiolonet Tokai, Nagoya, Japan
Synopsis
The purpose of this study was to identify the changes in multiparametric magnetic resonance imaging (MRI) findings in early diabetic nephropathy (DN). Multiparametric measurements were made of the renal cortex and medulla. Significant differences were seen between the healthy and early DN (grade1) in optimal TI and inverted TI value. T2 value of cortex is in marginal significant (p=0.064). This study suggests the possibility that MRI using the values of optimal TI, inverted TI value and T2 value of cortex can be used to evaluate early diabetic nephropathy non-invasively and in a short period of time.
Introduction
The incidence of diabetic nephropathy is increasing, and it has recently become the most common underlying disorder in dialysis patients. Early stages diabetic nephropathy is difficult to diagnose with regular kidney function tests, and at present, the severity is determined based only on microalbuminuria. More accurate diagnosis requires evaluation with multiple tests. In order to perform these tests in a larger number of early stages diabetic patients who have few symptoms, the tests should ideally include those that can be performed non-invasively and in a short period of time. Recent study shows parameters derived from magnetic resonance imaging (MRI) can evaluate kidney function1-4). However, there are few reports comparing multiple parameters in the same case. The purpose of this study was to identify the changes in multiparametric MRI findings in early diabetic nephropathy.Methods
The study subjects (N=57) included 35 patients with diabetes (Stage 1) and 22 healthy volunteers between December 2018 and October 2021 who consented to participate in this study. All subjects underwent non-contrast MRI using a 3-Tesla MRI machine. Measurements were made of the renal cortex and renal medulla T1 values, T2 values, blood oxygenation level dependent (BOLD) imaging (T2* values and R2* values), intravoxel incoherent motion (IVIM) imaging (ADC, f, D* and D values), arterial spin labeling (ASL) as well as optimal inversion time (TI) (= TI of maximum corticomedullary contrast ratio (CMR = signal intensity (SI) of cortex / SI of medulla)) and inverted TI value (value of TI that inverts the renal cortex and renal medulla SI) on steady-state free precession (SSFP) with inversion recovery (IR) pulse with multi TI (TI = 1000, 1100, 1200, 1300, 1400, 1500, 1600, 1700, 1800 msec) (Fig. 1). A total 21 parameters were compared between healthy groups and early DN group.Results
A significant difference between healthy groups and early DN group was seen in optimal TI (mean ± SD: 1395.5±72.2 msec vs. 1437.1±70.0 msec; p=0.030) and inverted TI (mean ± SD: 1240.9±66.6 msec vs. 1278.6±62.2 msec; p=0.034) value on SSFP with IR pulse with multi TI. T2 value of cortex is in marginal significant (mean ± SD: 101.6±9.7 msec vs. 107.8±11.4 msec; p=0.062) (Fig.2, 3). The AUC of these parameters were 0.666 in optimal TI, 0.663 in inverted TI and 0.648 in T2 value of cortex (Fig.4). Threshold values were set at 1450 msec and 1250 msec for the optimal TI and inverted TI, respectively, the sensitivity and specificity were 60.0% and 31.8%, respectively for the optimal TI and 82.9% and 54.6%, respectively for the inverted TI. Threshold values were set at 108.49 msec for the T2 value of cortex, the sensitivity and specificity were 48.6% and 22.7% respectively. No other 18 parameters showed significant differences between healthy groups and early DN group.Discussion
In chronic renal impairment other than diabetic nephropathy, the estimated glomerular filtration rate index used to evaluate kidney function gradually decreases as renal impairment progresses. Morphological changes indicating a gradual decrease in renal cortical thickness and renal length are also seen. In diabetic nephropathy, on the other hand, these indicators are unreliable especially in early stage. Because glomerular hypertension, and conversely are characteristic changes in early diabetic nephropathy. Glomerular hypertension is thought to produce enlargement of the glomeruli and edematous changes in surrounding tissue. In other words, the water content in tissue increases. Value of optimal TI and inverted TI on SSFP with IR pulse with multi TI showed significant differences, T2 value of cortex showed marginal significant difference between the healthy group and early DN group were images that can exquisitely was image that can exquisitely capture tissue water content of cortex as the early changes of diabetic nephropathy. Of the 21 parameters in this study, these three parameters (optimal TI, inverted TI and T2 value) indicate tissue water content. Thus, they might be sensitive indicators of the changes of early diabetic nephropathy.Conclusion
This study suggests the possibility that MRI using the values of optimal TI and inverted TI on SSFP with IR pulse with multi TI and T2 in cortex, which can sensitively capture edematous changes in the renal cortex, can be used to evaluate early diabetic nephropathy non-invasively and in a short period of time.Acknowledgements
No acknowledgement found.References
- Wolf M, de Boer A, Sharma K, et al. Magnetic resonance imaging T1- and T2-mapping to assess renal structure and function: a systematic review and statement paper. Nephrol Dial Transplant. 2018 Sep 1;33(suppl_2):ii41-ii50.
- Noda Y, Ito K, Kanki A, et al. Measurement of renal cortical thickness using noncontrast-enhanced steady-state free precession MRI with spatially selective inversion recovery pulse: Association with renal function. J Magn Reson Imaging. 2015 Jun;41(6):1615-21.
- Hall ME, Jordan JH, Juncos LA, et al. BOLD magnetic resonance imaging in nephrology. Int J Nephrol Renovasc Dis. 2018 Mar 13;11:103-112.
- Parving HH, Mauer M, Ritz E. Diabetic nephropathy. In: Brenner BM, ed. Brenner and Rector’s The Kidney. 8th ed. Philadelphia, PA: Saunders Elsevier, 2007; 1265-1298
Figures
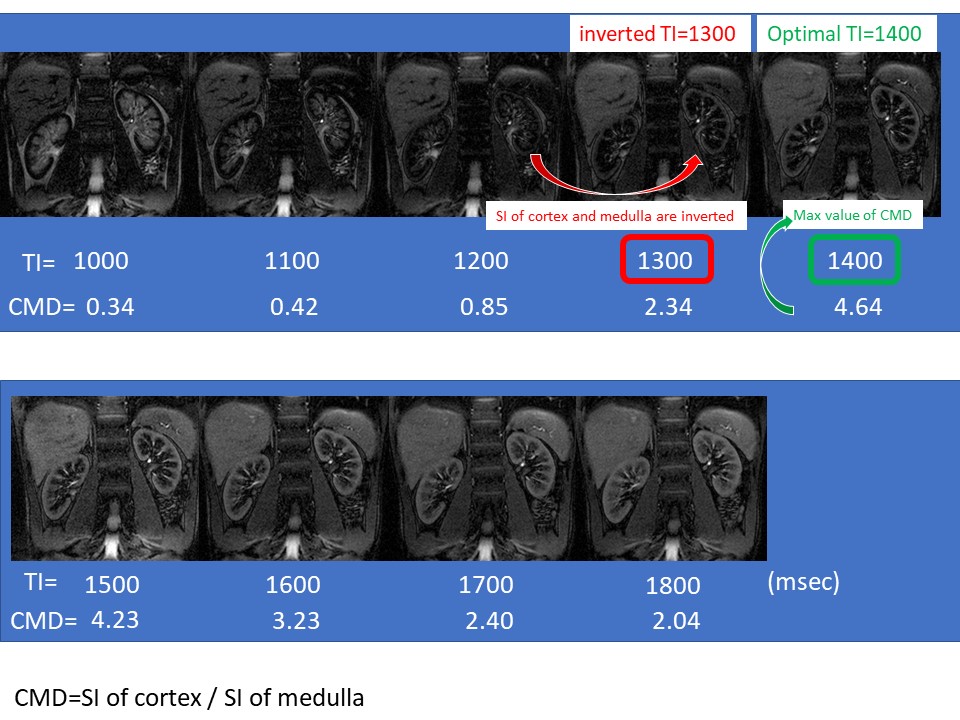
A series of topographically identical SSFP
sequences with ss IR pulse using various TIs, 1000–1800 msec in increments of
100 msec (a total of nine images) were obtained to determine the optimal TI and
inverted TI
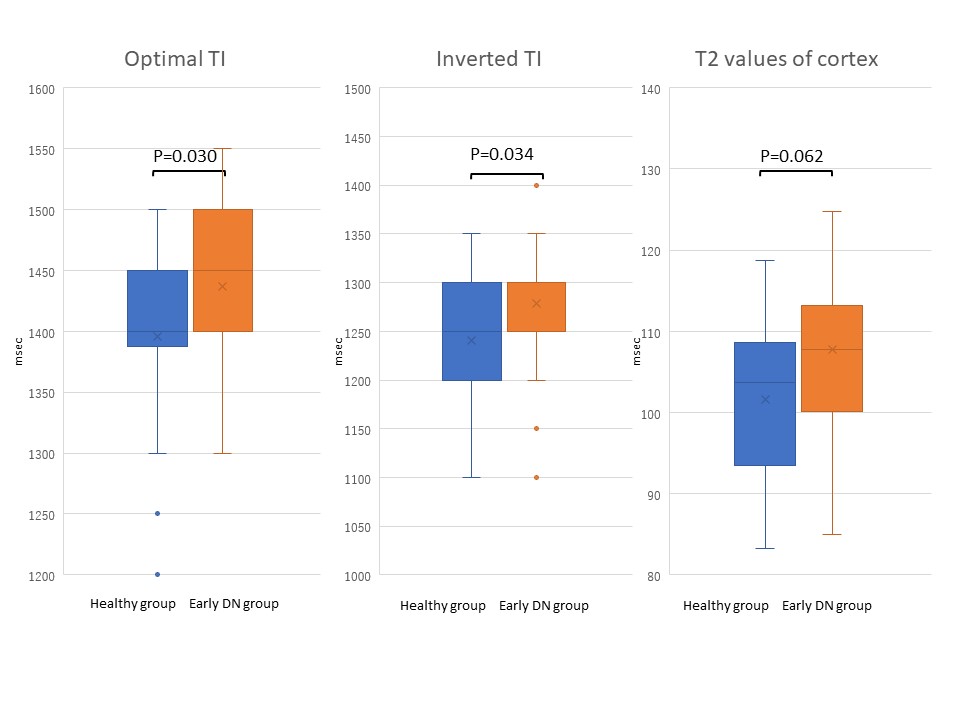
A significant difference between healthy
groups and early DN group was seen in optimal TI (mean ± SD: 1395.5±72.2 msec
vs. 1437.1±70.0 msec; p=0.030) and inverted TI (mean ± SD: 1240.9±66.6 msec vs.
1278.6±62.2 msec; p=0.034) value on SSFP with IR pulse with multi TI. T2 value
of cortex is in marginal significant (mean ± SD: 101.6±9.7 msec vs. 107.8±11.4
msec; p=0.062)
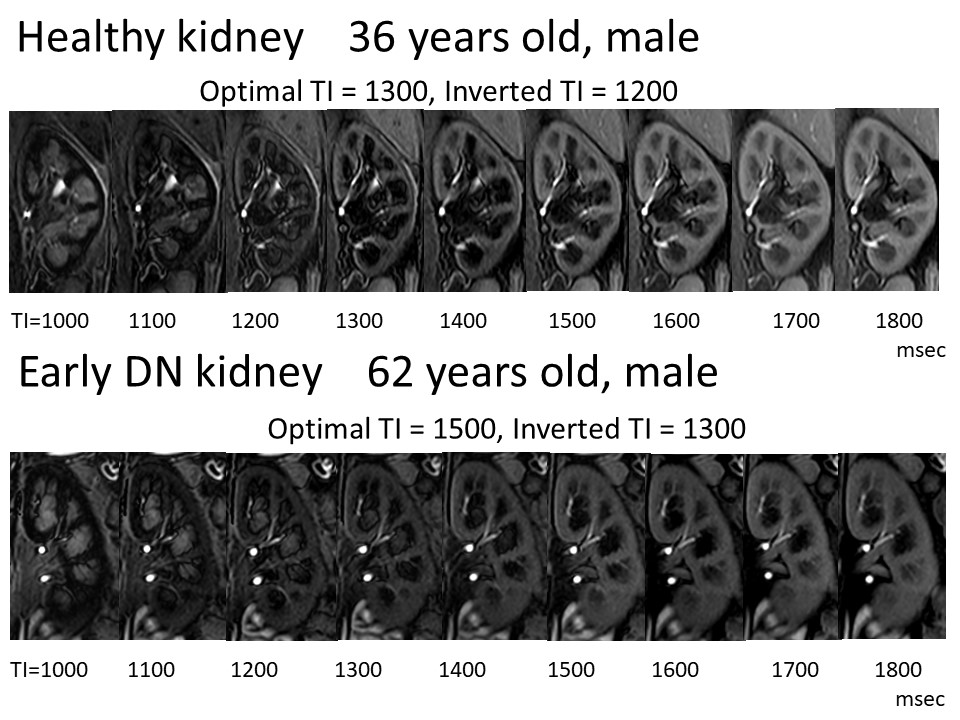
Healthy kidney shows optimal TI: 1300, and
inverted TI: 1200. Early DN kidney shows optimal TI: 1500, and inverted TI
1300. Values of optimal TI and inverted TI are higher in early DN kidney than
healthy kidney.
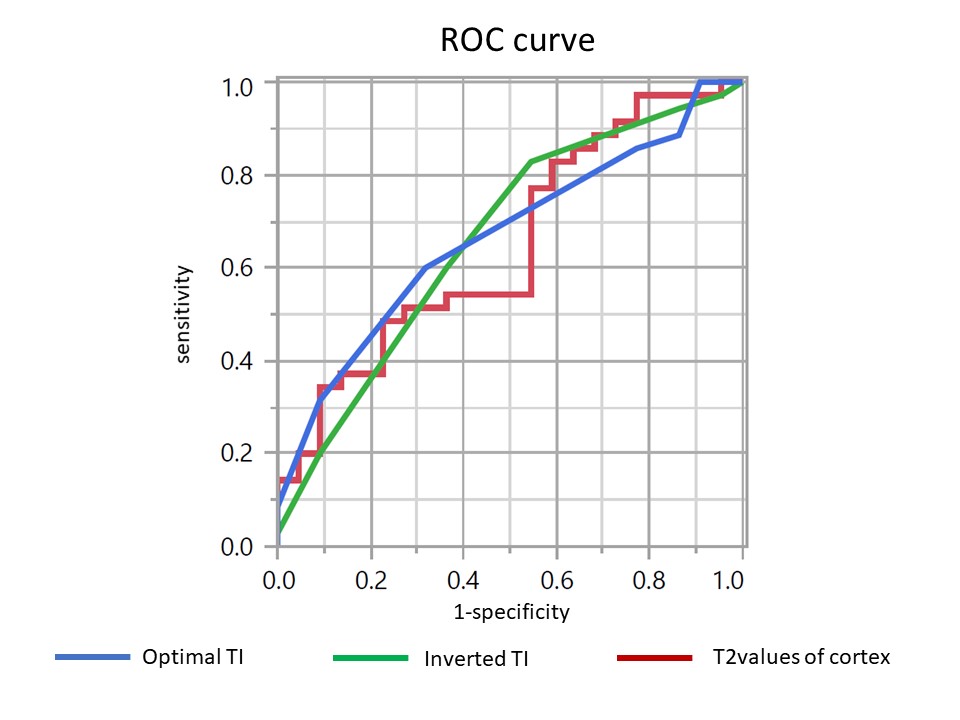
The ROC curve shows the AUC were 0.666 in
optimal TI, 0.663 in inverted TI and 0.648 in T2 value of cortex.
DOI: https://doi.org/10.58530/2022/2493