2489
Velocity-compensated optimized diffusion encoding in respiratory-triggered renal ADC mapping1Department of Diagnostic and Interventional Radiology, Technical University of Munich, Munich, Germany, 2Philips Healthcare, Best, Netherlands, 3Philips GmbH Market DACH, Hamburg, Germany
Synopsis
Diffusion-weighted imaging (DWI) and ADC mapping remains a potential biomarker for the assessment of renal fibrosis in chronic kidney disease and characterization of renal carcinoma. However, for body DWI applications including renal DWI, motion effects can confound the robustness of abdominal DWI. Motion-compensated diffusion encoding designs have been proposed as alternatives in overcoming the effect motion in other organs such as the liver and the pancreas. The purpose of this work is to assess the effect of respiratory motion and to apply motion compensated diffusion encoding waveforms in the context of coronal respiratory-triggered ADC mapping in the kidney.
Purpose
Diffusion-weighted imaging (DWI) and ADC mapping remains a potential biomarker for the assessment of renal fibrosis in chronic kidney disease and renal carcinoma1-6. However, for body DWI applications, respiratory, cardiac and subject involuntary motion during diffusion encoding leads to intravoxel dephasing and therefore signal loss, thereby confounding the robustness of abdominal DWI. Due to their location in the body, the kidneys are also affected by motion7. Motion-compensated diffusion encoding designs have been proposed as alternatives in overcoming the effect motion in other organs such as the liver8-16. The purpose of this work is to assess the effect of respiratory motion and to apply the motion compensated diffusion encoding waveforms in the context of coronal ADC mapping in the kidney.Methods
MR Measurements – Dynamic ScansTo assess the signal stability of the pulsed gradient spin echo (pgse) and asymmetrical velocity compensated (asym-vc) waveforms at different respiratory trigger delays, in vivo dynamic scans were carried out in 4 healthy subjects. One single slice was acquired with 20 dynamics, a voxel size of $$$2.5\space{}\textrm{x}\space{}2.5\space{}\textrm{x}\space12\space{}$$$mm3, a b-value of 600 s/mm2 and a parallel imaging factor of $$$R\space{}=\space{}3$$$ in the LR direction. A respiratory belt was used to track subject breathing motion, and respiratory trigger delays of 100, 400 and 800 ms were used in separate scans. Diffusion was measured in the feet-head (FH), left-right (LR) and anterior-posterior (AP) directions. $$$TE\space{}=\space{}64\space{}/\space{}92\space{}$$$ms for the pgse and asym-vc waveforms, respectively. The velocity-compensated asym-vc waveform had an $$$m_1=\int{}tG(t)dt=0$$$ and a concomitant field corrected TE-optimized asymmetrical design15,16.
MR Measurements – Respiratory Triggered ADC mapping
In vivo measurements were carried out in 10 healthy subjects. Three slices were acquired with a voxel size of $$$2.5\space{}\textrm{x}\space{}2.5\space{}\textrm{x}\space{}6\space{}$$$mm3, b-values of [100, 600] s/mm2 with corresponding averages of [2, 3] were used for the ADC calculation and a parallel imaging factor of $$$R\space{}=\space{}3$$$ was used in the LR direction. The diffusion encoding directions were FH, LR and AP. Respiratory trigger delays of 100, 400 and 800 ms were used in separate scans. $$$TE\space{}=\space{}64\space{}/\space{}92$$$ ms for the pgse and asym-vc waveforms, respectively.
Results
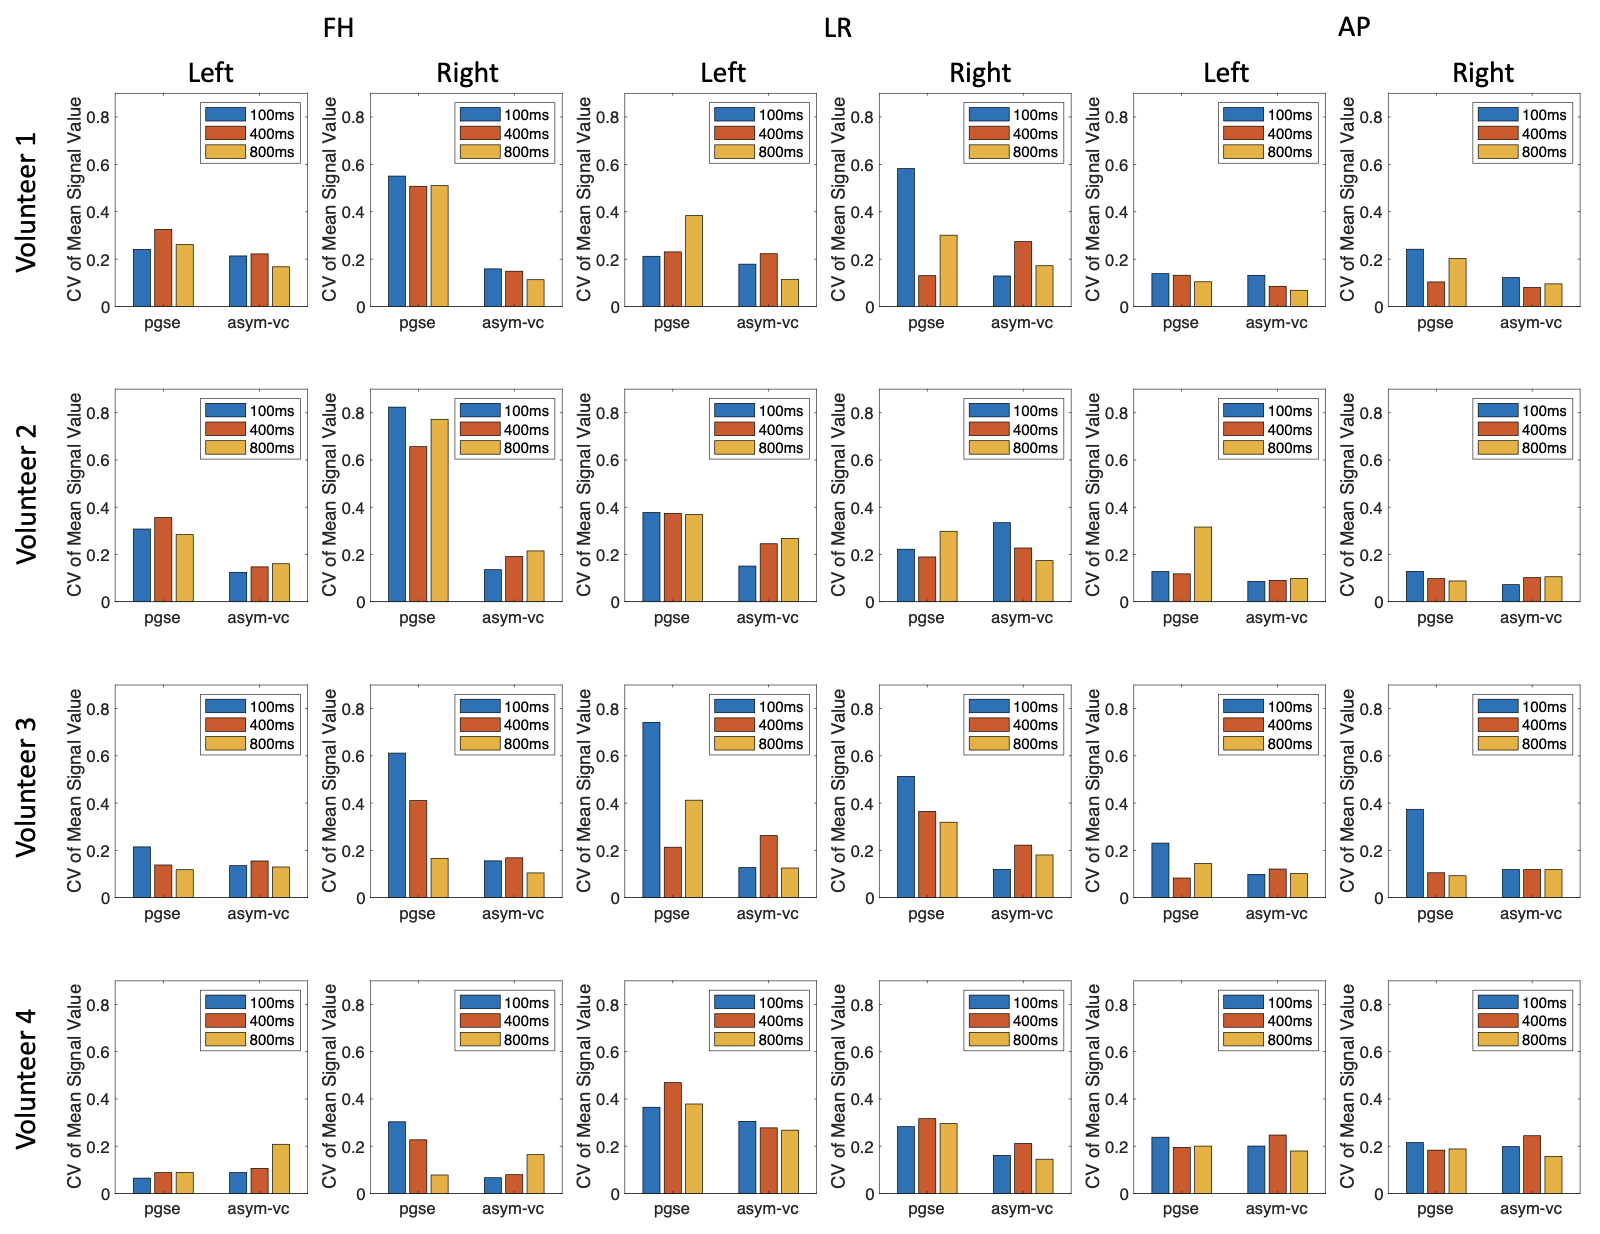
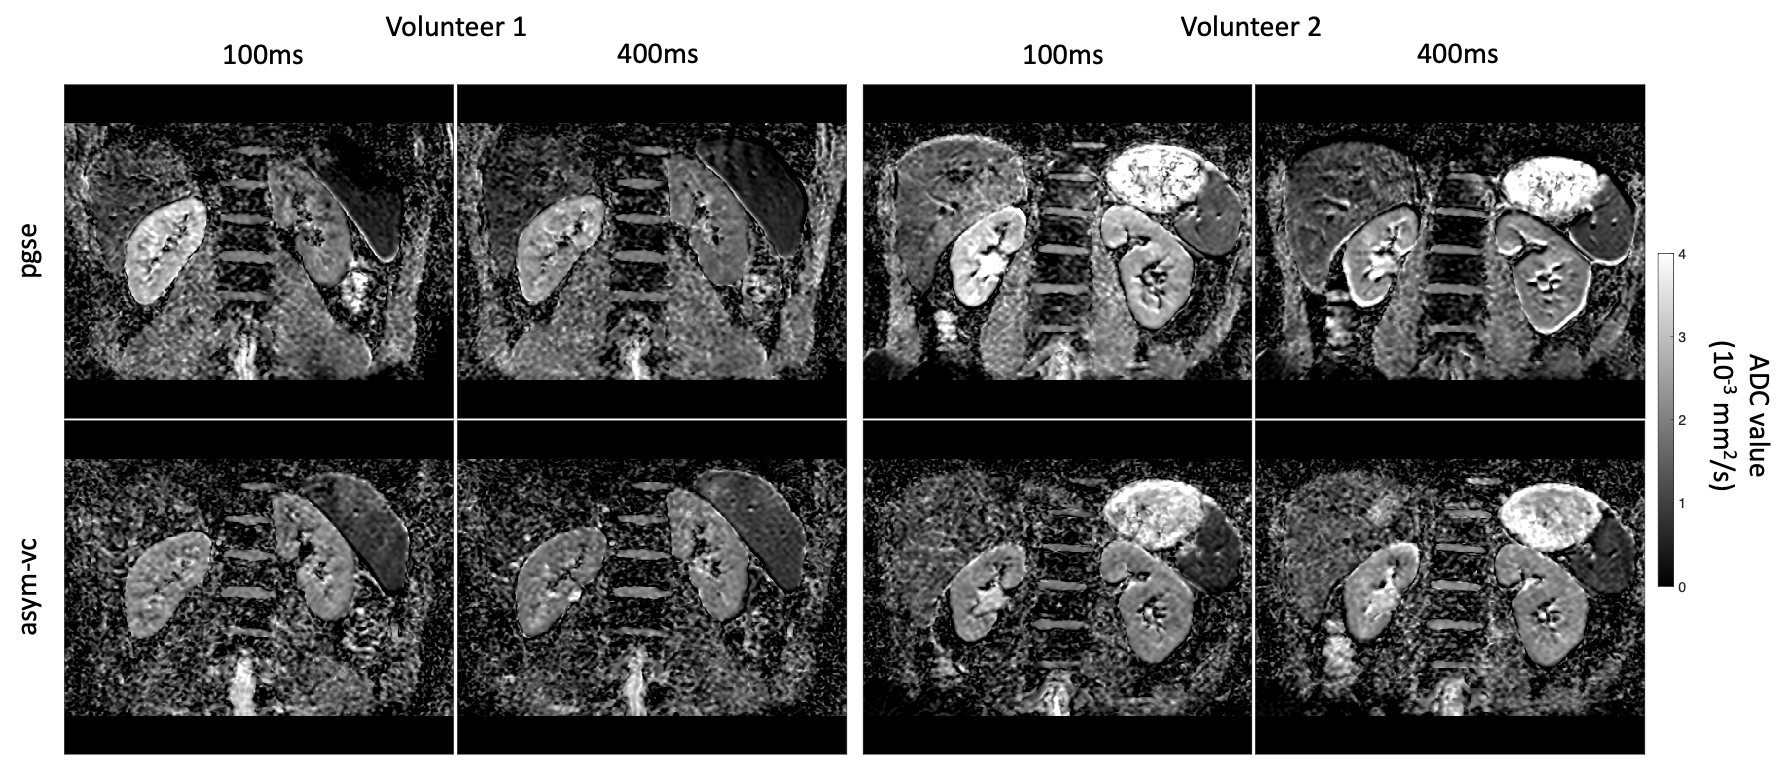
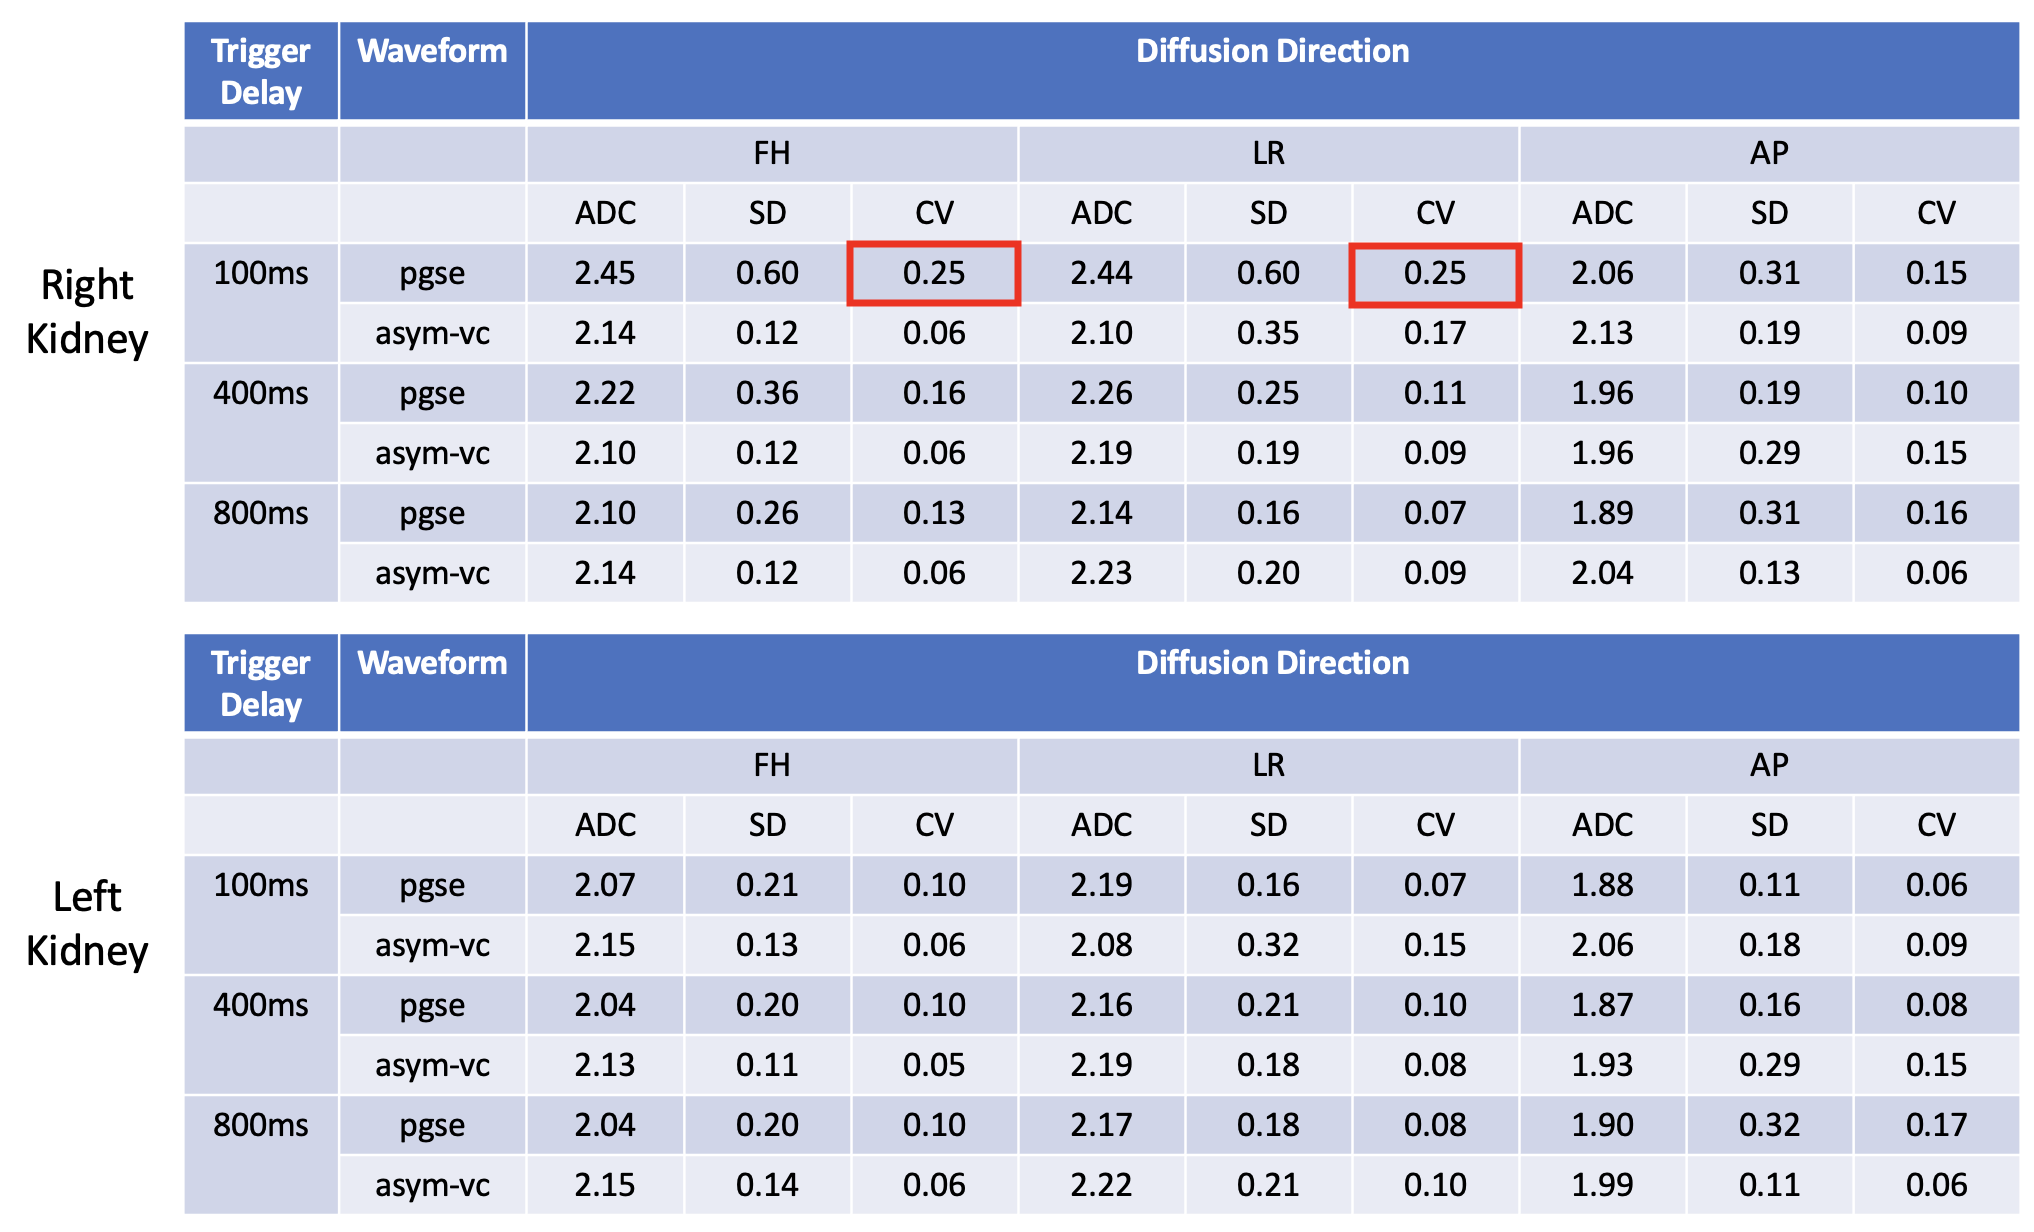
Figure 1 shows the signal variation at different respiratory trigger delays for the pgse and asym-vc waveforms. In the given example, the pgse waveform has a much larger variation in signal across all trigger delays compared to asym-vc in the right kidney. In the left kidney, the pgse waveform has a slightly larger signal variation than asym-vc across all trigger delays. Figure 2 shows the coefficient of variation of the mean signal value for all subjects for all trigger delays. In the FH diffusion direction, pgse has a larger CV than asym-vc at trigger delays of 100 ms and 400 ms in the right kidney for all volunteers. In most cases, pgse has a larger CV than asym-vc in the left kidney in the LR direction. In the AP direction, pgse and asym-vc typically have a similar CV for all trigger delays in each kidney. Figure 3 shows ADC maps for two different volunteers at trigger delays of 100 and 400 ms. In both volunteers, the pgse waveform produces an overestimated ADC at a trigger delay of 100 ms, but not at 400 ms. The asym-vc waveform does not show an overestimated ADC for either kidney at either trigger delay. Figure 4 shows the mean ADC averaged over all ROIs and slices for each volunteer for diffusion in the FH direction. In the right kidney, the largest ADC intersubject variability can be seen at a trigger value of 100 ms with the pgse waveform. The ADC intersubject variability decreases as the trigger delay increases in the right kidney with the pgse waveform. The asym-vc waveform has a smaller ADC intersubject variability in the right kidney for all trigger delays. Figure 5 shows tables containing the mean ADC over all subjects, standard deviation of ADC over all subjects and the intersubject variability coefficient of variation in the left and right kidneys. The largest intersubject variability can be seen in the right kidney at trigger delays of 100 ms when the pgse waveform is used for diffusion in the FH and LR directions.Discussion & Conclusion
At short trigger delays and in certain volunteers, the pgse waveform gives an overestimation of ADC in the right kidney in particular, for diffusion in the FH direction. The FH diffusion direction is the direction which is expected to be most affected by respiratory motion. The pgse waveform is not largely affected by motion at a trigger delay of 800 ms, however the optimal trigger delay may be subject specific and motion artefacts could occur at any trigger delay. The asym-vc waveform does not show as large of an ADC intersubject variability in the right kidney for the FH direction for all trigger delays at the cost of lower SNR due to the employed prolonged TE compared to the pgse waveform. This suggests that the asym-vc waveform can provide a more consistent ADC quantification in the kidneys in the FH diffusion direction compared to pgse in the presence of strong respiratory motion, making it less sensitive to any variation in the breathing patterns that exist among subjects.Acknowledgements
The present work was supported by Philips Healthcare.References
1. Zhao J, Wang ZJ, Liu M. et al. Assessment of renal fibrosis in chronic kidney disease using diffusion-weighted MRI. Clin Radiol 2014; 69: 1117–1122
2. Damasio MB, Tagliafico A, Capaccio E. et al. Diffusion-weighted MRI sequences (DW-MRI) of the kidney: normal findings, influence of hydration state and repeatability of results. Radiol Med 2008; 113: 214–224
3. Zhang JL, Sigmund EE, Chandarana H. et al. Variability of renal apparent diffusion coefficients: limitations of the monoexponential model for diffusion quantification. Radiology 2010; 254: 783–792
4. Li Q, Li J, Zhang L. et al. Diffusion-weighted imaging in assessing renal pathology of chronic kidney disease: a preliminary clinical study. Eur J Radiol 2014; 83: 756–762
5. Kline TL, Edwards ME, Garg I. et al. Quantitative MRI of kidneys in renal disease. Abdom Radiol (NY) 2018; 43: 629–638
6. Namimoto T, Yamashita Y, Mitsuzaki K. et al. Measurement of the apparent diffusion coefficient in diffuse renal disease by diffusion-weighted echo-planar MR imaging. J Magn Reson Imaging 1999; 9: 832–837
7. Kataoka M, Kido A, Yamamoto A. et al. Diffusion tensor imaging of kidneys with respiratory triggering: optimization of parameters to demonstrate anisotropic structures on fraction anisotropy maps. J Magn Reson Imaging 2009; 29: 736–744
8. Aliotta E, Wu HH, Ennis DB. Convex optimized diffusion encoding (CODE) gradient waveforms for minimum echo time and bulk motion compensated diffusion weighted MRI. Magn Reson Med 2017; 77:717–729
9. Peña-Nogales Ó, de Luis-Garcia R, Hernando D, et al. Optimal design of motion-compensated diffusion gradient waveforms. Proc. Intl. Soc. Mag. Reson. Med. 25 (2017) Abstract 3340
10. Peña-Nogales Ó, Zhang Y, Wang X, de Luis-Garcia R, Aja-Fernández S, Holmes J. H., Hernando D. Optimal Diffusion-weighting Gradient Waveform Design (ODGD): Formulation and Experimental Validation. Proc. Intl. Soc. Mag. Reson. Med. 26 (2018) Abstract 1615
11. Van AT, Cervantes B, Karampinos DC, et al. Partial velocity-compensated diffusion encoding for combined motion compensation and residual vessel signal suppression in liver DWI. Proc. Intl. Soc. Mag. Reson. Med. 26 (2018) Abstract 0079
12. Majeed W, Kalra P, Kolipaka A. Motion Compensated, Optimized Diffusion Encoding (MODE) Gradient Waveforms. Proc. Intl. Soc. Mag. Reson. Med. 26 (2018) Abstract 1614
13. Peña-Nogales Ó, Zhang Y, Wang X, de Luis-Garcia R, Aja-Fernández S, Holmes J. H., Hernando D. Optimized Diffusion-Weighting Gradient Waveform Design (ODGD) formulation for motion compensation and concomitant gradient nulling. Magn. Reson. Med. 2018;00:1–15. https://doi. org/10.1002/mrm.27462
14. Zhang Y, Peña-Nogales Ó., Holmes JH, Hernando D. Motion‐robust and blood suppressed M1‐optimized diffusion MR imaging of the liver. Magn Reson Med. 2019;00:1–10. https://doi.org/10.1002/mrm.27735
15. McTavish S, Van AT, Peeters J, Ogino T, Hock A, Rummeny E, Braren R, and Karampinos DC. Partial velocity-compensated optimized diffusion encoding for combined motion compensation and residual vessel signal suppression in liver ADC mapping. Proc. Intl. Soc. Mag. Reson. Med. 27 (2019) Abstract 1709
16. McTavish S, Van AT, Peeters J, Weiss K, Makowski M, Braren R, and Karampinos DC. Gradient non-linearity correction in liver DWI using motion compensated diffusion encoding waveforms. Proc. Intl. Soc. Mag. Reson. Med. 27 (2021) Abstract 2132
Figures