2488
Preclinical Investigation of Kidney Volume and Perfusion after Nephrectomy using Dynamic Contrast-Enhanced MRI.1Division of Cancer Sciences, The University of Manchester, Manchester, United Kingdom, 2Division of Cell-Matrix Biology and Regenerative Medicine, The University of Manchester, Manchester, United Kingdom, 3Division of Informatics, Imaging and Data Science, The University of Manchester, Manchester, United Kingdom, 4Geoffrey Jefferson Brain Research Centre , Manchester Academic Health Science Centre, Northern Care Alliance & University of Manchester, Manchester, United Kingdom, 5Division of Cardiovascular Sciences, The University of Manchester, Manchester, United Kingdom, 6Dorset Count Hospital NHS Foundation Trust, Dorset, United Kingdom, 7Division of Radiotherapy and Imaging, Institute of Cancer Research, London, United Kingdom
Synopsis
Compensatory hypertrophy of the remaining kidney is observed in mice after nephrectomy using structural MRI. By fitting the two-compartment filtration model to dynamic contrast-enhanced MRI data we examined the effects of nephrectomy on the passage of blood through the remaining kidney over time. Total kidney plasma volume (vp) increases at 1 week post-nephrectomy, along with T1. This is followed by a decrease at week 4, which is coupled to a decrease in total and per unit volume plasma flow and an increase in plasma mean transit time.
Introduction
Chronic kidney disease (CKD) affects 10% of the global population and is an independent risk factor for cardiovascular disease and stroke. The correlation between high blood pressure and CKD progression is established1, however the associated microvascular and molecular changes associated with increased mechanical load acting on glomerular capillaries are not understood. Mechanical load in the kidney can be manipulated in mice by removing a single kidney and tracking the changes over time in the remaining kidney. Here we present a preliminary investigation of structural and functional MRI data in mouse pre- and post-nephrectomy using volumetric and dynamic contrast-enhanced (DCE) MRI.Methods
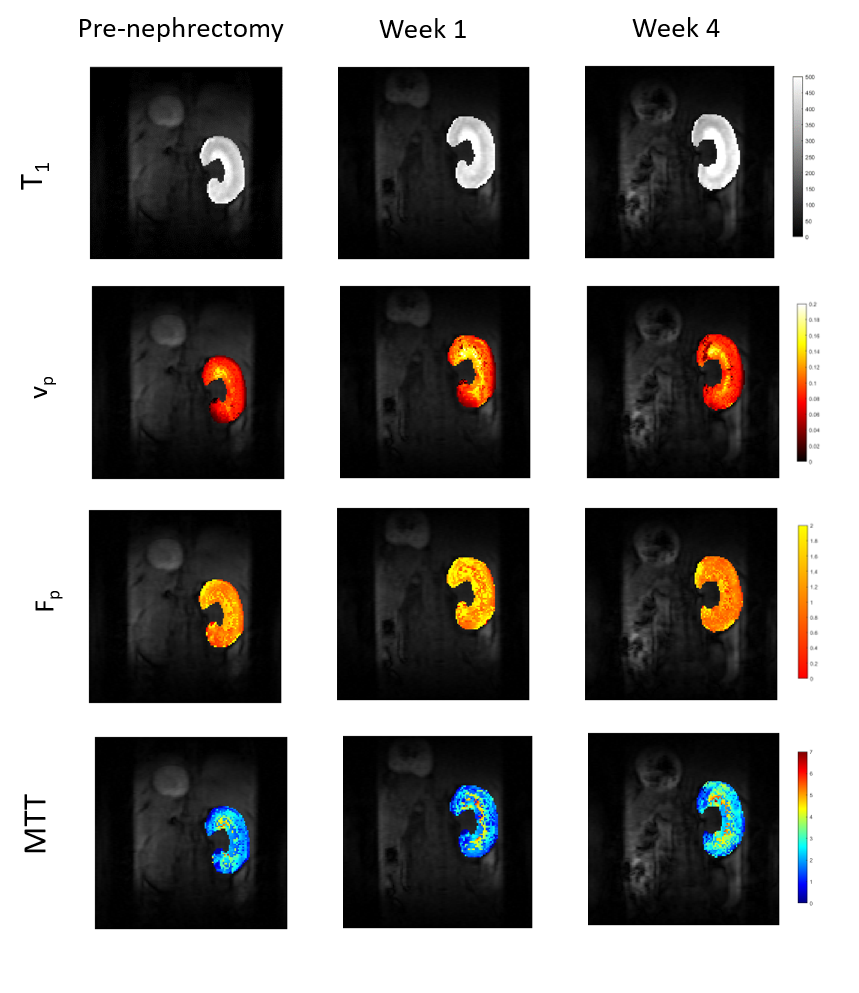
Experimental procedures were approved in accordance with the UK Animals (Scientific Procedures) Act 1986 and EU Directive 2010/63/EU for animal experiments. Six C57BL76J mice, aged 8 weeks, were scanned on a Bruker Avance III console interfaced with an Agilent 7T magnet at baseline (pre-nephrectomy), 1 week and 4 weeks after nephrectomy. In each mouse the left kidney was removed under anaesthesia. Each scanning session involved high-resolution volumetric and DCE-MRI. DCE sequence: T1-weighted FLASH with TE = 1 ms, TR = 8 ms, 128 x 128, 20 slices, 0.23 x 0.23 x 0.75 mm3. Four variable flip angle (FA) scans to calculate T1: 2, 5, 12 and 20° and a dynamic acquisition of 140 images with FA = 20°. Dotarem (Guerbet, gadoteric acid) was administered intravenously on the 38th dynamic scan at a dose of 0.1 mmol/kg body weight using an automatic contrast injector at a rate of 0.25 ml/min. Post-contrast structural sequence: T2-weighted RARE with TE = 25 ms, TR = 2.55 s, 256 x 256, 30 slices, 0.12 x 0.12 x 0.5 mm3.Whole kidney volumes (V in cm3) were calculated using in-house Python code and down-sampled masks created for DCE-MRI. T1 (ms) was calculated2 and an arterial input function manually defined at the aortic branch to the renal artery using a single voxel ROI. Median DCE-MRI parameters were created for the whole kidney by fitting the two-compartment filtration model (2CFM)3 implemented in Madym4. The model estimates 4 parameters: Plasma flow Fp (ml/ml/min) from an arterial region into the tissue which distributes over plasma volume vp. A fraction of the contrast agent is filtered out of the vascular space and is carried by a tubular flow, PS (ml/ml/min), into the tubular system where it distributes over the tubular volume, ve. Three addition parameters were calculated: Total kidney vp = median vp × V, plasma mean transition time (MTT) = (median vp/median Fp) × 60 and total kidney plasma flow = median Fp × V.3
Results
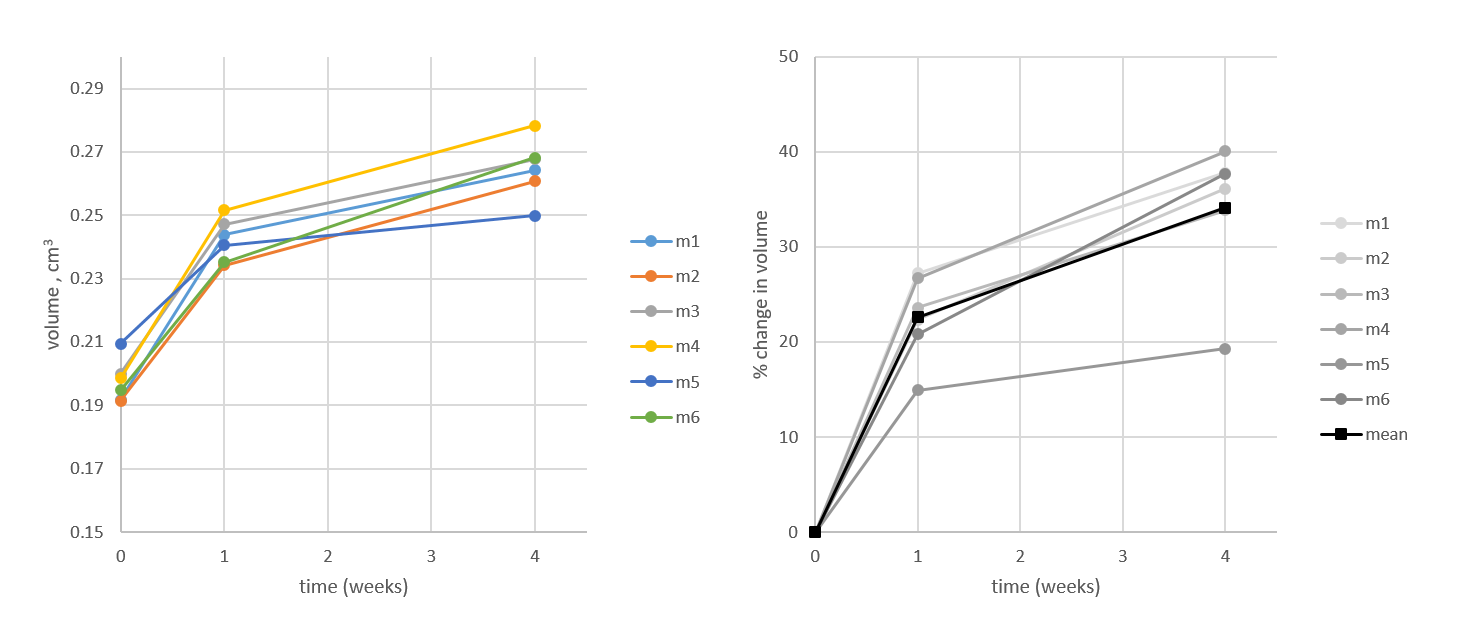
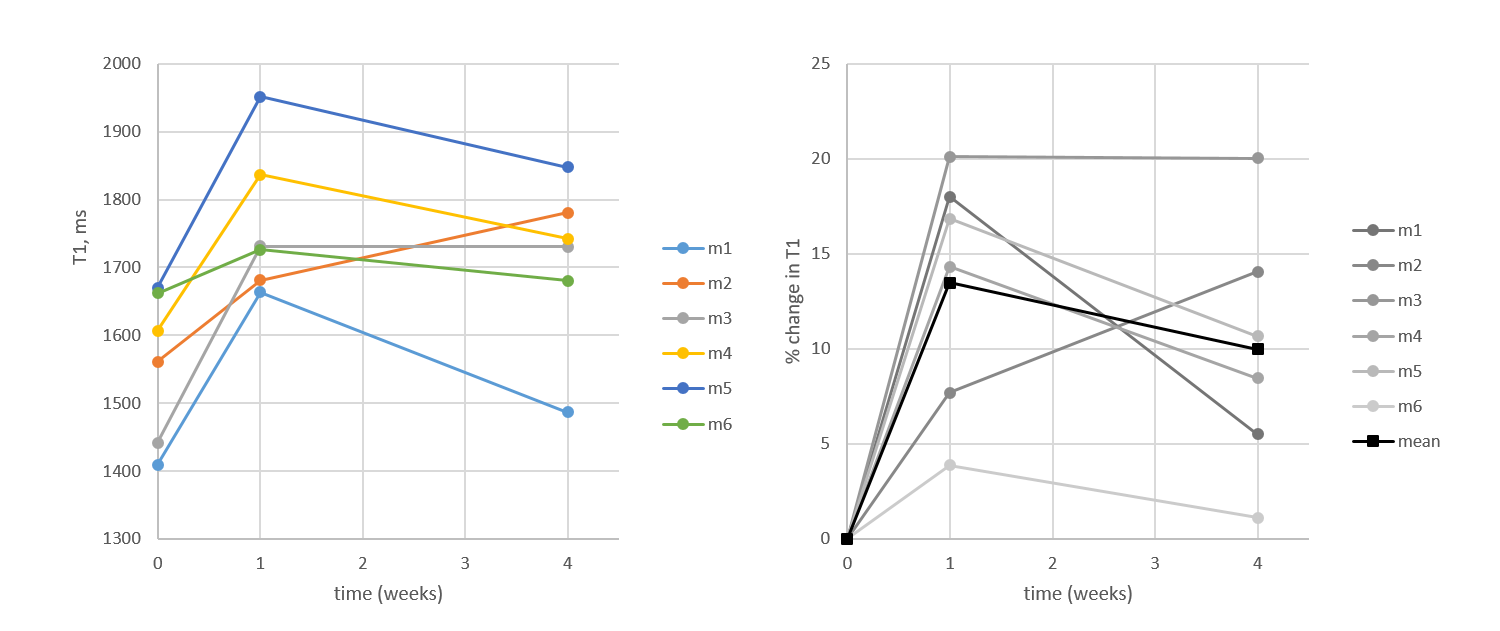
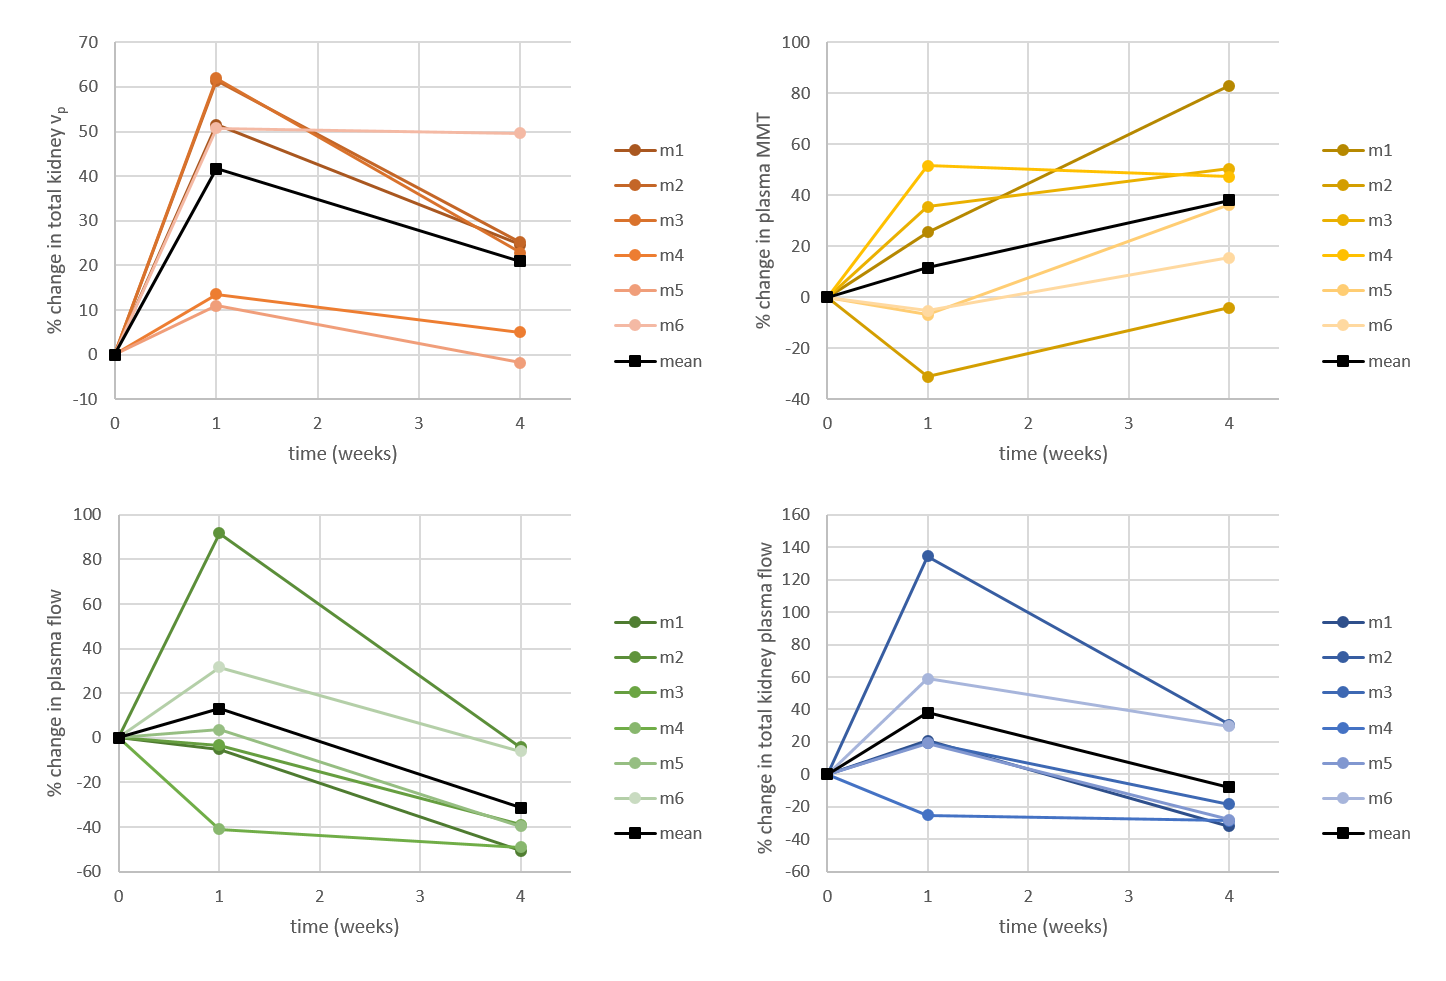
We acquired kidney volume measurements at baseline, week 1 and week 4 for n = 6 mice (Table 1). Representative images are shown (Figure 1). A significant cohort increase in size was observed from baseline to week 1 (23%) and week 4 (34%) with organ volume increasing for each mouse (Figure 2). Similarly, a significant T1 increase was observed from baseline to week 1 (13%) and week 4 (10%) (Figure 3).Total kidney vp increased at week 1 (42%) and 4 (21%), relative to baseline (Figure 4a), whereas the plasma MMT showed a significant increase from baseline (38%) only at week 4 (Figure 4b). Plasma flow decreased significantly from baseline to week 4 (-31%) (Figure 4c). Total kidney plasma flow in ml/min showed a non-significant increase at week 1, followed by a return to baseline flow at week 4 (Figure 4d).
Discussion
Compensatory hypertrophy of the remaining kidney is known to occur after unilateral kidney nephrectomy in both humans5 and animal models6. It is hypothesised that the reduction of kidney tissue releases specific growth factors into the circulation. A change in kidney blood flow may initiate this hypertrophic response7.By fitting the 2CFM to our DCE-MRI data we examined the effects of nephrectomy on blood through the remaining kidney over time. Early increases in blood flow have been observed using electromagnetic flow probe7 and autoradiography8. Here, although total kidney plasma flow mostly increases post nephrectomy, this change was not significant. Only total kidney vp showed a significant increase from baseline at week 1. When accounting for the change in kidney volume, the perfusion per unit of tissue decreased relative to baseline at week 4. This suggests that the hypertrophic response over compensates for the increased blood volume, leaving some redundancy in the system. The increased kidney volume also leads to an increase in the mean transit time of the blood through the kidney. T1 values of the remaining kidney increase at 1 week and remain elevated at week 4, likely reflecting increased blood volume.
Conclusion
Modelling of the DCE-MRI data allows dynamic assessment of kidney perfusion parameters. When correlated with molecular and ultrastructural analyses, these data could impact our currently limited ability to assess the risk of future CKD and the safety of kidney donation.Acknowledgements
No acknowledgement found.References
[1] Horowitz B, Miskulin D, and Zager P. Epidemiology of Hypertension in CKD. Adv Chronic Kidney Dis 2005;22(2):88–95.
[2] Fram EK, Herfkens RJ, Johnson GA, et al. Rapid calculation of T1 using variable flip angle gradient refocused imaging. Magn Reson Imaging 1987;5(3):201–208.
[3] Sourbron SP, Michaely HJ, Reiser MF, Schoenberg SO. MRI-measurement of perfusion and glomerular filtration in the human kidney with a separable compartment model. Invest Radiol. 2008;43(1):40–8.
[4] Berks M, Parker GJM, Little R, Cheung S. Madym: A C++ toolkit for quantitative DCE-MRI analysis. Available from: https://gitlab.com/manchester_qbi/manchester_qbi_public/madym_cxx/-/wikis
[5] Rojas-Canales DM, Li JY, Makuei L, Gleadle JM. Compensatory renal hypertrophy following nephrectomy: When and how? Nephrology. 2019;24(12):1225–32.
[6] Dicker SE, Shirley DG. Mechanism of compensatory renal hypertrophy. J Physiol. 1971;219(3):507–23.
[7] Sigmon, D. H., Gonzalez-Feldman, E., Cavasi, et al, W. H. Role of nitric oxide in the renal hemodynamic response to unilateral nephrectomy. J. Am. Soc. Nephrol. 2004;15:1413–1420.
[8] Young, L. S. et al. Changes in regional renal blood flow after unilateral nephrectomy using the techniques of autoradiography and microautoradiography. J. Urol. 1998;160, 926–931.
Figures