2487
Spatial Heterogeneity in Quantitative Renal ADC, ASL perfusion and R2* Maps Using Texture Analysis1NorthShore University HealthSystem, Evanston, IL, United States, 2Pritzker School of Medicine, University of Chicago, Chicago, IL, United States, 3Langone School of Medicine, New York University School of Medicine, New York, NY, United States
Synopsis
While regions of interest analysis is widely used in quantitative MRI, emphasis usually is placed only on the spatial average and information of spatial heterogeneity is ignored. Texture analysis has gained increasing interest in the context of applying artificial intelligence. These Radiomic tools are now readily available in image analysis tool boxes for more widespread adoption. We illustrate an application of such analysis on quantitative renal MRI, including ADC, ASL and R2* maps. Our results show that several measures of heterogeneity of cortical voxel-wise maps discriminate between healthy and individuals with chronic kidney disease.
INTRODUCTION
Chronic kidney disease (CKD) and the role of chronic hypoxia in the progression of CKD has gained attention [1]. The role of non-invasive quantitative MRI methods such as arterial spin labeling (ASL) perfusion MRI, R2* mapping for renal oxygen availability and apparent diffusion coefficient (ADC) mapping for fibrosis have also gained interest [2]. However, our previous data on comparison of mean value of renal cortical BOLD and ADC did not show significant difference between group of moderate CKD and healthy controls [3]. To-date, all reported data only evaluated differences in the spatial averages and have not included spatial heterogeneity in the analysis.Texture analysis tools allow us to extract quantitative spatial information from digital images and using them to differentiate objects using artificial intelligence. These methods have been applied to diagnostic imaging to differentiate certain renal cancers based on data with multi-parametric MRI [4].
The purpose of this study was to evaluate whether textural parameters from multi-parametric MRI images can differentiate kidneys in individuals with moderate CKD from those in healthy volunteers. Note, that prior analysis based on mean values only showed significant differences in ASL perfusion.
MATERIALS AND METHODS
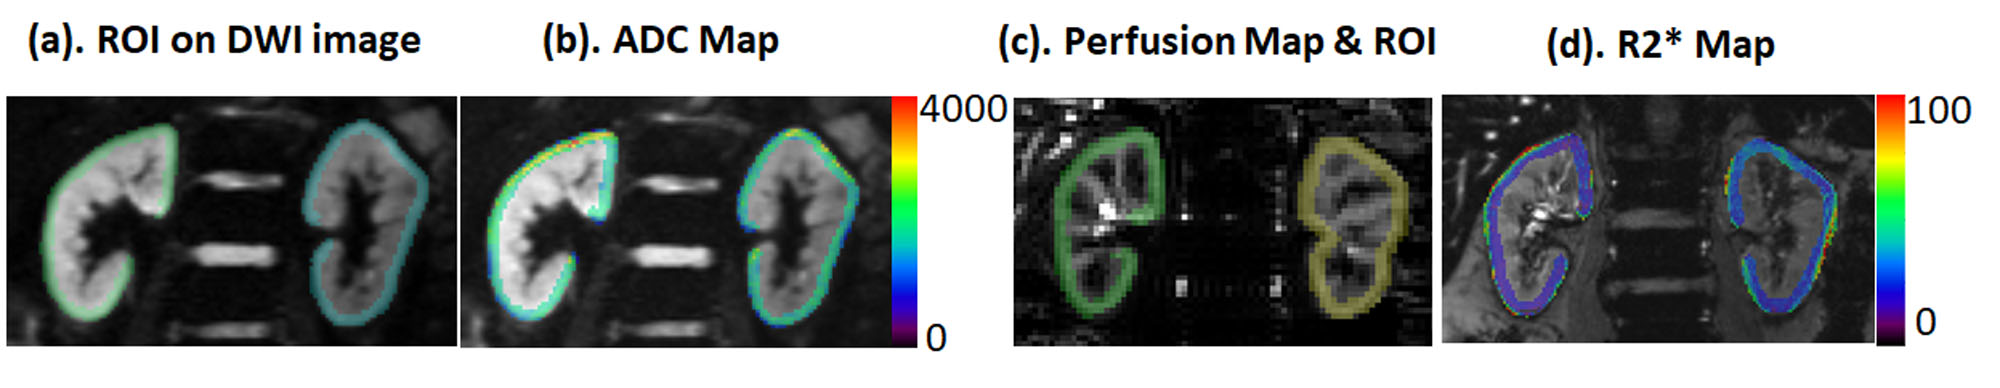
MRI Data from a previously published study was utilized [3]. All experiments were performed with approval from the institutional review boards and written subject consent. Thirteen healthy controls (age 59 ± 9 and 6 males) and 41 individuals with stage 3 CKD and diabetes (age 66 ± 9 and 20 males) participated in this study. Analysis excluded 12 cases (2 healthy and 10 CKD) due to presence of cysts and 2 more for missing DWI scans (1 health and 1 CKD), yielding a total sample size of 40. All experimental MR procedures were performed on a 3 Tesla whole body scanner (Siemens Healthcare, Erlangen, Germany).MRI data were analyzed using FireVoxel (FV) (https://firevoxel.org/ ) and custom Matlab code (for processing renal ASL). Images were coregistered by rigid transform to correct for respiratory motion. ROIs were defined left and right side cortex separately (see Figure 1), and then functional maps were generated based on BOLD and diffusion weighted images. Radiomic features (N=53) included first order statistics, gray level co-occurrence matrix (GLCM) and gray level run length matrix (GLRLM) textural parameters. SPSS Statistics 22 was used to perform one-way ANOVA for evaluating differences between healthy controls and CKD patients using a significance level of 0.05. Spearman correlation coefficient was used to evaluate associations between the textural features and with renal function, estimated glomerular filtration rate (eGFR).
RESULTS
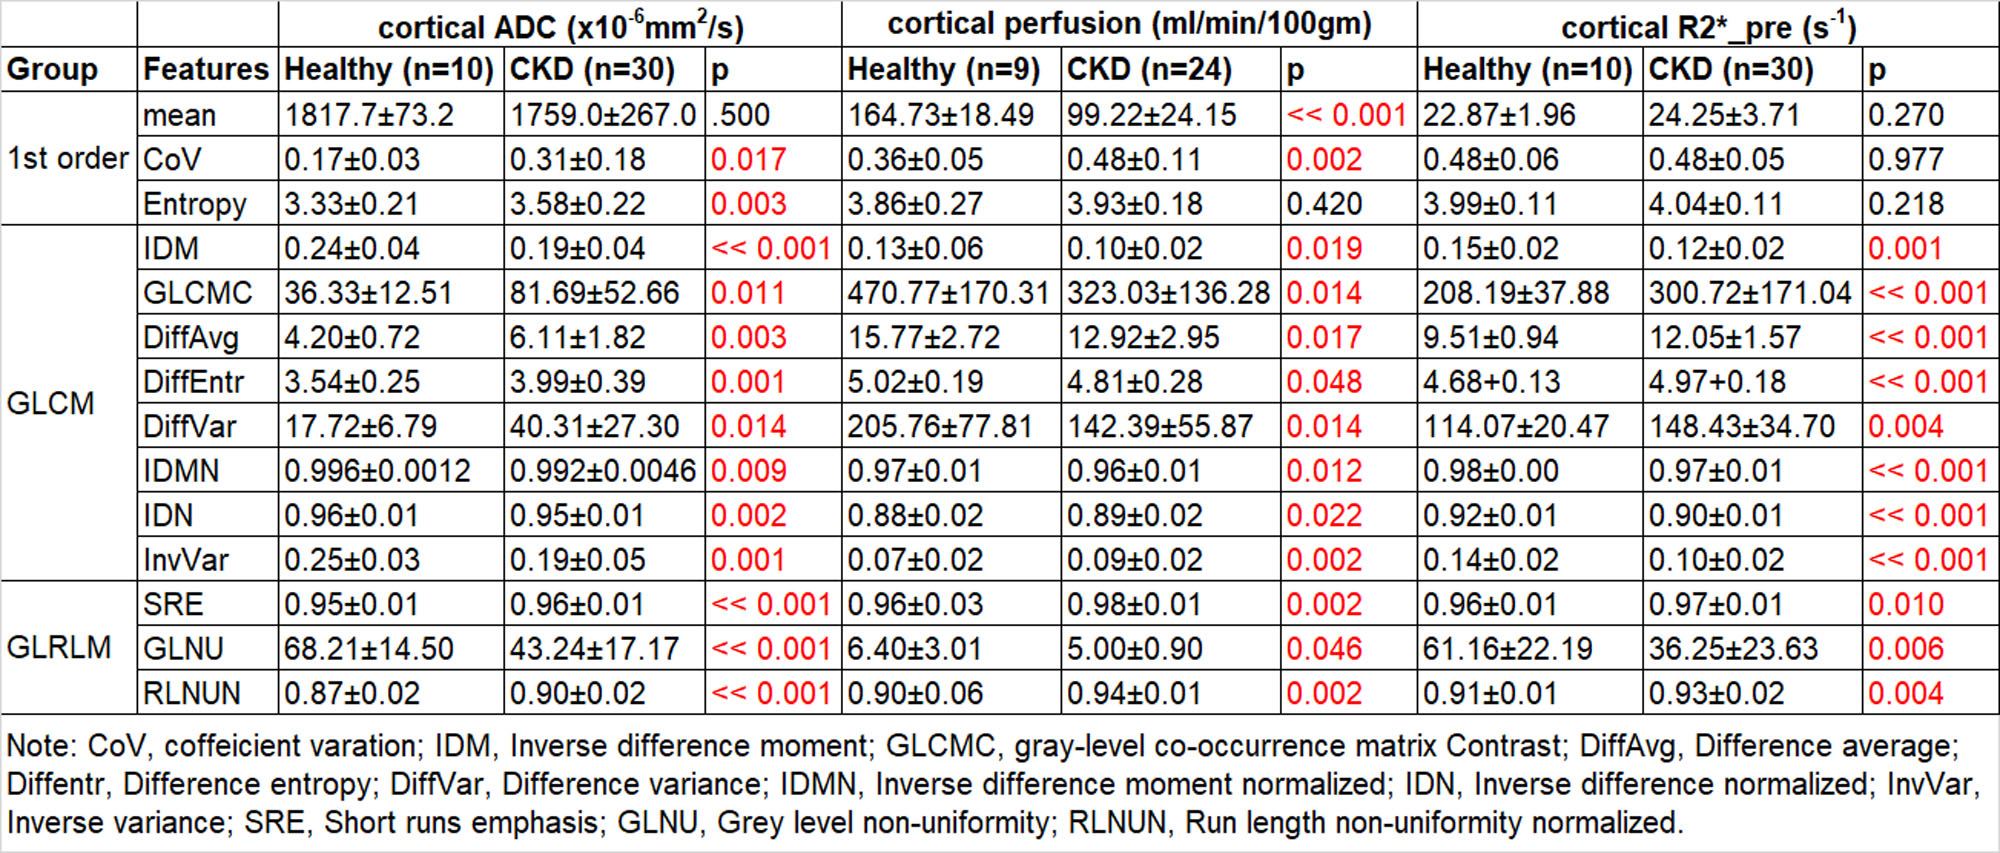
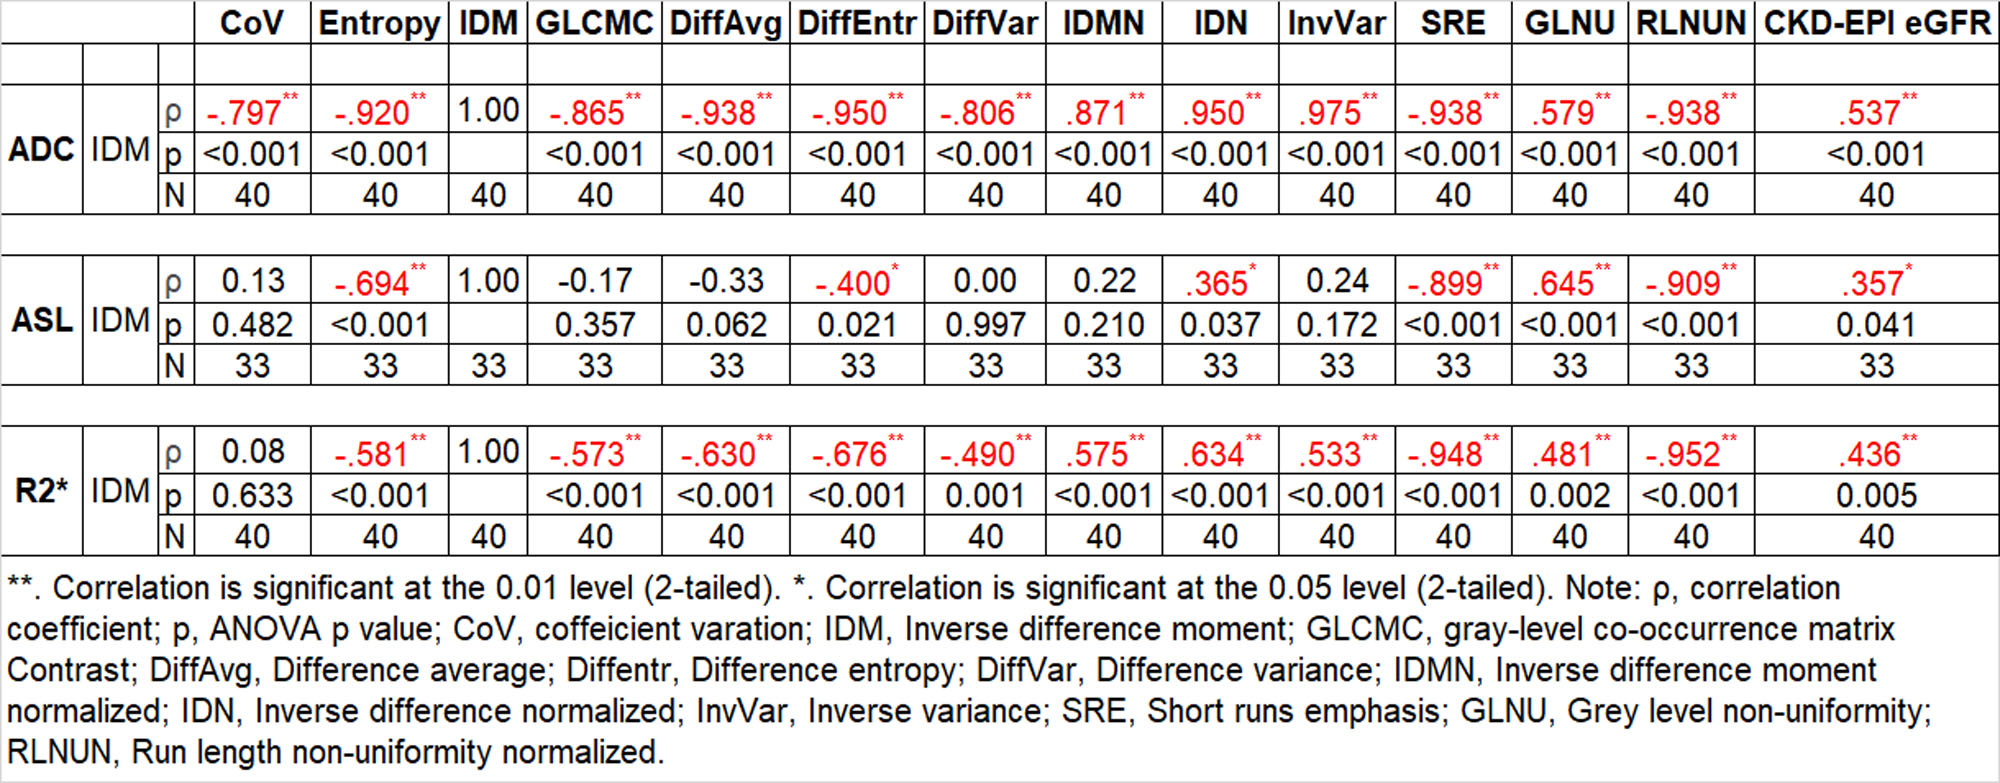
Among the 53 Radiomic features evaluated by FV a subset of 14 features reached statistical significance with at least one of three MRI parameters (ADC, ASL perfusion, and R2*) between CKD and controls (Table 1). Table 2 summarizes the interdependence of the parameters and any association with renal function, eGFR. For brevity, only IDM, the textural feature that showed significant differences between CKD and healthy with all three MRI parameters is shown. Interestingly, ADC showed strong and significant association between all the textural parameters.R2*, even though showed less number of features with significant differences between the groups, showed moderate but significant associations with most other textural parameters.
Cortical perfusion by ASL, the only parameter that showed significant differences in mean values between CKD and controls, showed the least number of textural features that were significantly associated with each other.
DISCUSSION AND CONCLUSION
Even though spatial average of ADC failed to differentiate CKD from controls, the spatial heterogeneity as evaluated by first and higher order textural parameters from ADC maps were significantly different between the groups. Interestingly, all these parameters were strongly and significantly associated with each other. While this could suggest that just one or a few texture features are needed, it is possible that a richer set, when entered in a multivariate model, would be more accurate and more robust for monitoring the progression of CKD. This variability in spatial heterogeneity in ADC is consistent with the patchy nature of renal tissue fibrosis [5] on histopathology.R2* showed none of the first order features were significantly different between the groups. But there were several higher order parameters that were different. Additionally, there was a moderate but significant association between all the other textural features. This may suggest that IDM could be the one parameter that could be used in concert with mean value in the evaluation of R2* mapping.
ASL perfusion maps showed the least number of textural features that were associated with each other suggesting there may be more independent parameters that may need to be included in evaluating differences between CKD and controls.
Future studies using larger datasets and data mining algorithms are needed to define the best multivariate MRI-based CKD biomarker. Further studies are also necessary to understand the basis of spatial heterogeneity as related to histology.
Summary of Main Findings
Several measures of heterogeneity of cortical voxel-wise maps of ADC, R2* and ASL perfusion using higher order texture analysis can discriminate kidneys of healthy individuals and those with chronic kidney disease.Acknowledgements
Work supported in part by grant DK093793 from NIDDK (PVP) and U24 EB028980 from NIBIB (HR).References
1. Fine LG, Orphanides C and Norman JT. Progressive renal disease: the chronic hypoxia hypothesis. Kidney Int Suppl. 1998;65:S74-8.
2. Selby NM, Blankestijn PJ, Boor P, Combe C, Eckardt KU, Eikefjord E, Garcia-Fernandez N, Golay X, Gordon I, Grenier N, Hockings PD, Jensen JD, Joles JA, Kalra PA, Kramer BK, Mark PB, Mendichovszky IA, Nikolic O, Odudu A, Ong ACM, Ortiz A, Pruijm M, Remuzzi G, Rorvik J, de Seigneux S, Simms RJ, Slatinska J, Summers P, Taal MW, Thoeny HC, Vallee JP, Wolf M, Caroli A and Sourbron S. Magnetic resonance imaging biomarkers for chronic kidney disease: a position paper from the European Cooperation in Science and Technology Action PARENCHIMA. Nephrol Dial Transplant. 2018;33:ii4-ii14.
3. Prasad PV, Li LP, Thacker JM, Li W, Hack B, Kohn O and Sprague SM. Cortical Perfusion and Tubular Function as Evaluated by Magnetic Resonance Imaging Correlates with Annual Loss in Renal Function in Moderate Chronic Kidney Disease. American journal of nephrology. 2019;49:114-124.
4. de Leon AD, Kapur P and Pedrosa I. Radiomics in Kidney Cancer: MR Imaging. Magn Reson Imaging Clin N Am. 2019;27:1-13.
5. Bulow RD and Boor P. Extracellular Matrix in Kidney Fibrosis: More Than Just a Scaffold. J Histochem Cytochem. 2019;67:643-661.
Figures