2486
Evaluating renal fibrosis in a nephrotoxic nephritis model using DTI-MRI1Research Biology, Genentech, South San Francisco, CA, United States, 2Biomedical Imaging, Genentech, South San Francisco, CA, United States, 3Research Pathology, Genentech, South San Francisco, CA, United States
Synopsis
Accurate estimation of kidney function is crucial to the detection, evaluation, and treatment of chronic kidney disease (CKD). The traditional methods are inaccurate or invasive. Here, we used DTI-MRI to evaluate kidney function with disease progression in nephrotoxic serum- induced CKD model (NTN). We detect changes associated with renal inflammation and fibrosis prior to functional decline. Moreover, AD and ADC of the cortex-outer medulla border were highly correlated with histologic evidence of fibrosis. These results suggest that DTI-MRI can detect early stages of CKD non-invasively in-vivo and can be used for fibrosis mapping in a variety of renal diseases.
Introduction
Immune-mediated glomerular injury is the cause of various forms of chronic kidney disease (CKD), including membranous nephropathy, IgA nephropathy, lupus nephritis, and anti-glomerular basement membrane disease1. During disease progression, tissue damage generally spreads from the glomerulus to the tubulointerstitial and perivascular regions, leading to fibrosis of the renal parenchyma2. Kidney function is typically assessed by estimated glomerular filtration rate (eGFR); however, GFR measurements can vary according to patient background, age, and biological and measurement variability3. Magnetic resonance imaging (MRI) offers a method to evaluate the renal structure and function noninvasively in real time4. Moreover, previous studies have highlighted associations between diffusion and renal fibrosis5-9. Here, we used the glomerular immune injury model, nephrotoxic nephritis (NTN), to model CKD in mice, and evaluated disease progression using diffusion tensor MRI (DTI-MRI). NTN was induced by injecting nephrotoxic serum and verified by CKD parameters including proteinuria, mesangial expansion, and renal fibrosis.Methods
Animal model: Animal procedures were approved by the institutional AAALAC-accredited review board. C57BL/6J male mice were injected once with 5 µl/g saline (n=5) or NTS (n=15) on day 0. Mice were imaged longitudinally at baseline (0 weeks), 1 week, 3 weeks, and 6 weeks post injection. Proteinuria was measured on days 0, 1, 7 and then weekly until endpoint. Two animals and datasets were excluded due to severe clinical conditions or severe image motion artifacts. NTS-injected mice were euthanize after 1 week (n=4), 3 weeks (n=5), and 6 weeks (n=5). Control mice were euthanize at the final time point (6 weeks). Kidneys were harvested 1 day after MRI and prepared for histology (H&E, PAS, and Masson’s trichrome). Histology was evaluated for glomerular injury score (0-4 ranging from normal to sclerotic; 20 random glomeruli were scored per mouse) and fibrosis severity (score of 0-5 ranging from no fibrosis to multifocal regionally expansive).MRI: During imaging, animals were anaesthetized with ~2% isoflurane and maintained at 37ºC. Imaging was performed on a Bruker 7T (Billerica, MA) with a volume transmit and cryogenic surface receive coil. A custom in vivo holder was constructed with 3D printing (Stratasys Dimension) to provide secure positioning of the animal. A T2 map covering the kidney was generated with a multi-slice multi-echo sequence with these parameters: TR=4s, TE1/spacing/TE8=5/5/40ms (8 echoes), matrix=110×110×15, and resolution=200×200×1000μm3. DTI (single-shot EPI) was performed with local shims and these parameters: TR=4s, TE=42ms, gradient directions=12, matrix=110×110×15, and resolution=200×200×1000μm3. DTI was used to compute these parametric maps: fractional anisotropy (FA), apparent diffusion coefficient (ADC), axial diffusivity (AD), and radial diffusivity (RD). A combination of these maps was used to determine kidney volumes. MRI parameters were measured in 4 renal regions: cortex (CO), outer medulla (OM), inner medulla (IM), and cortex-outer medulla border (CM). Whole kidney volumes were segmented manually using Amira (Thermo Fisher Scientific).
Results
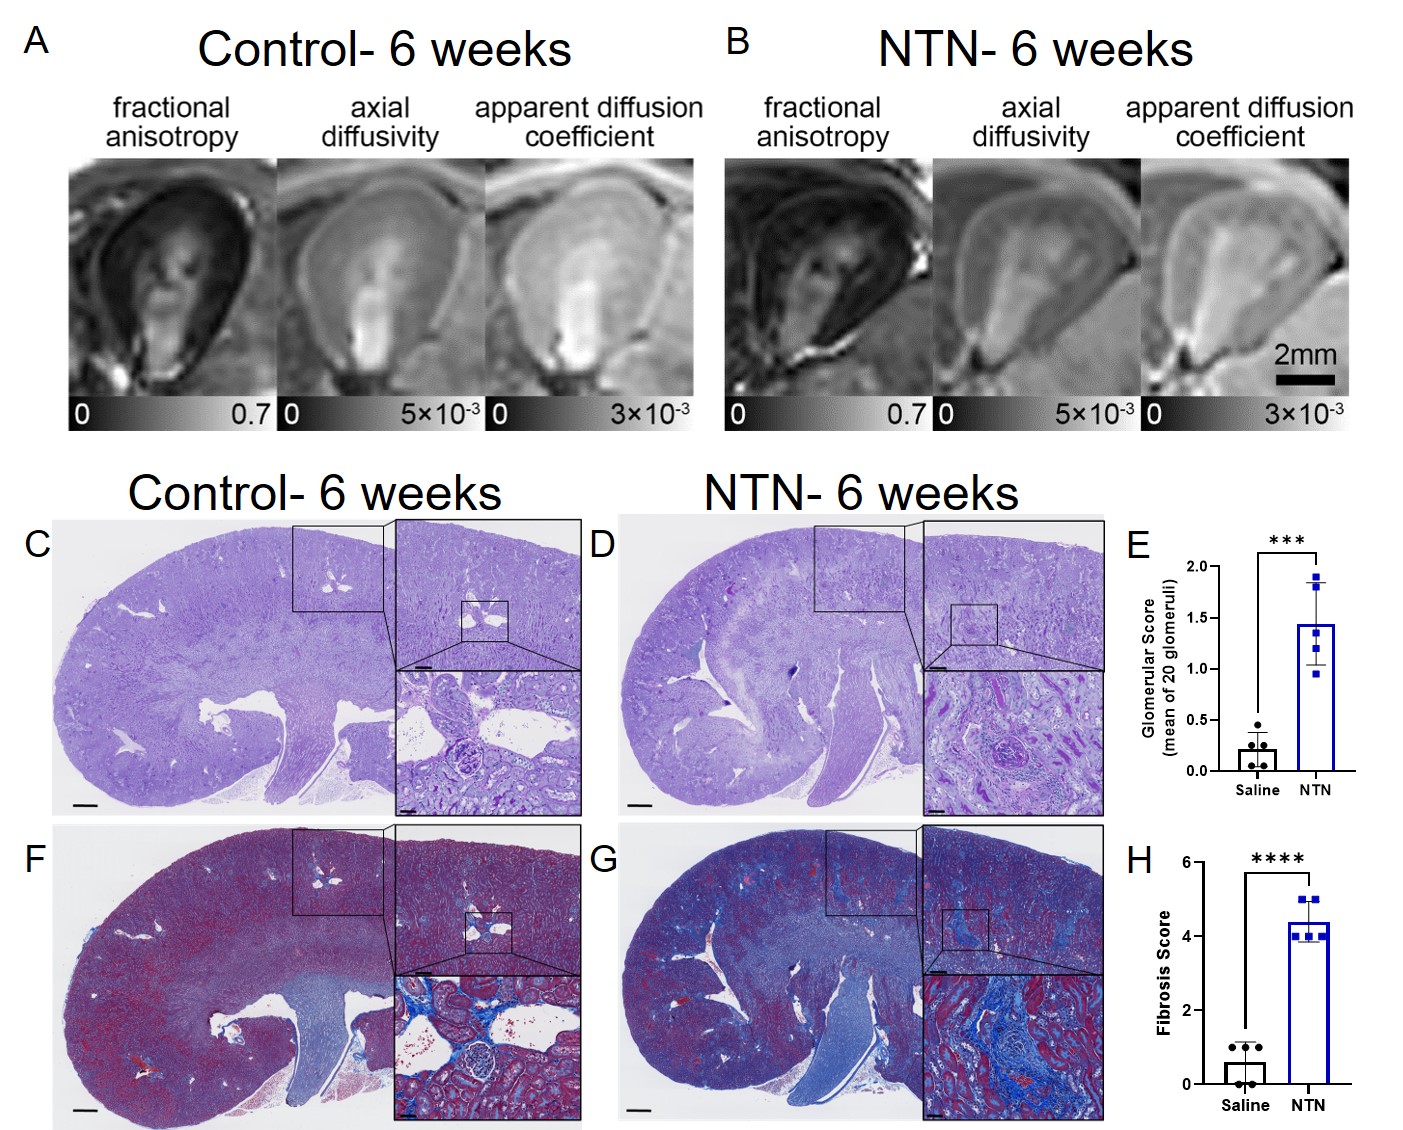
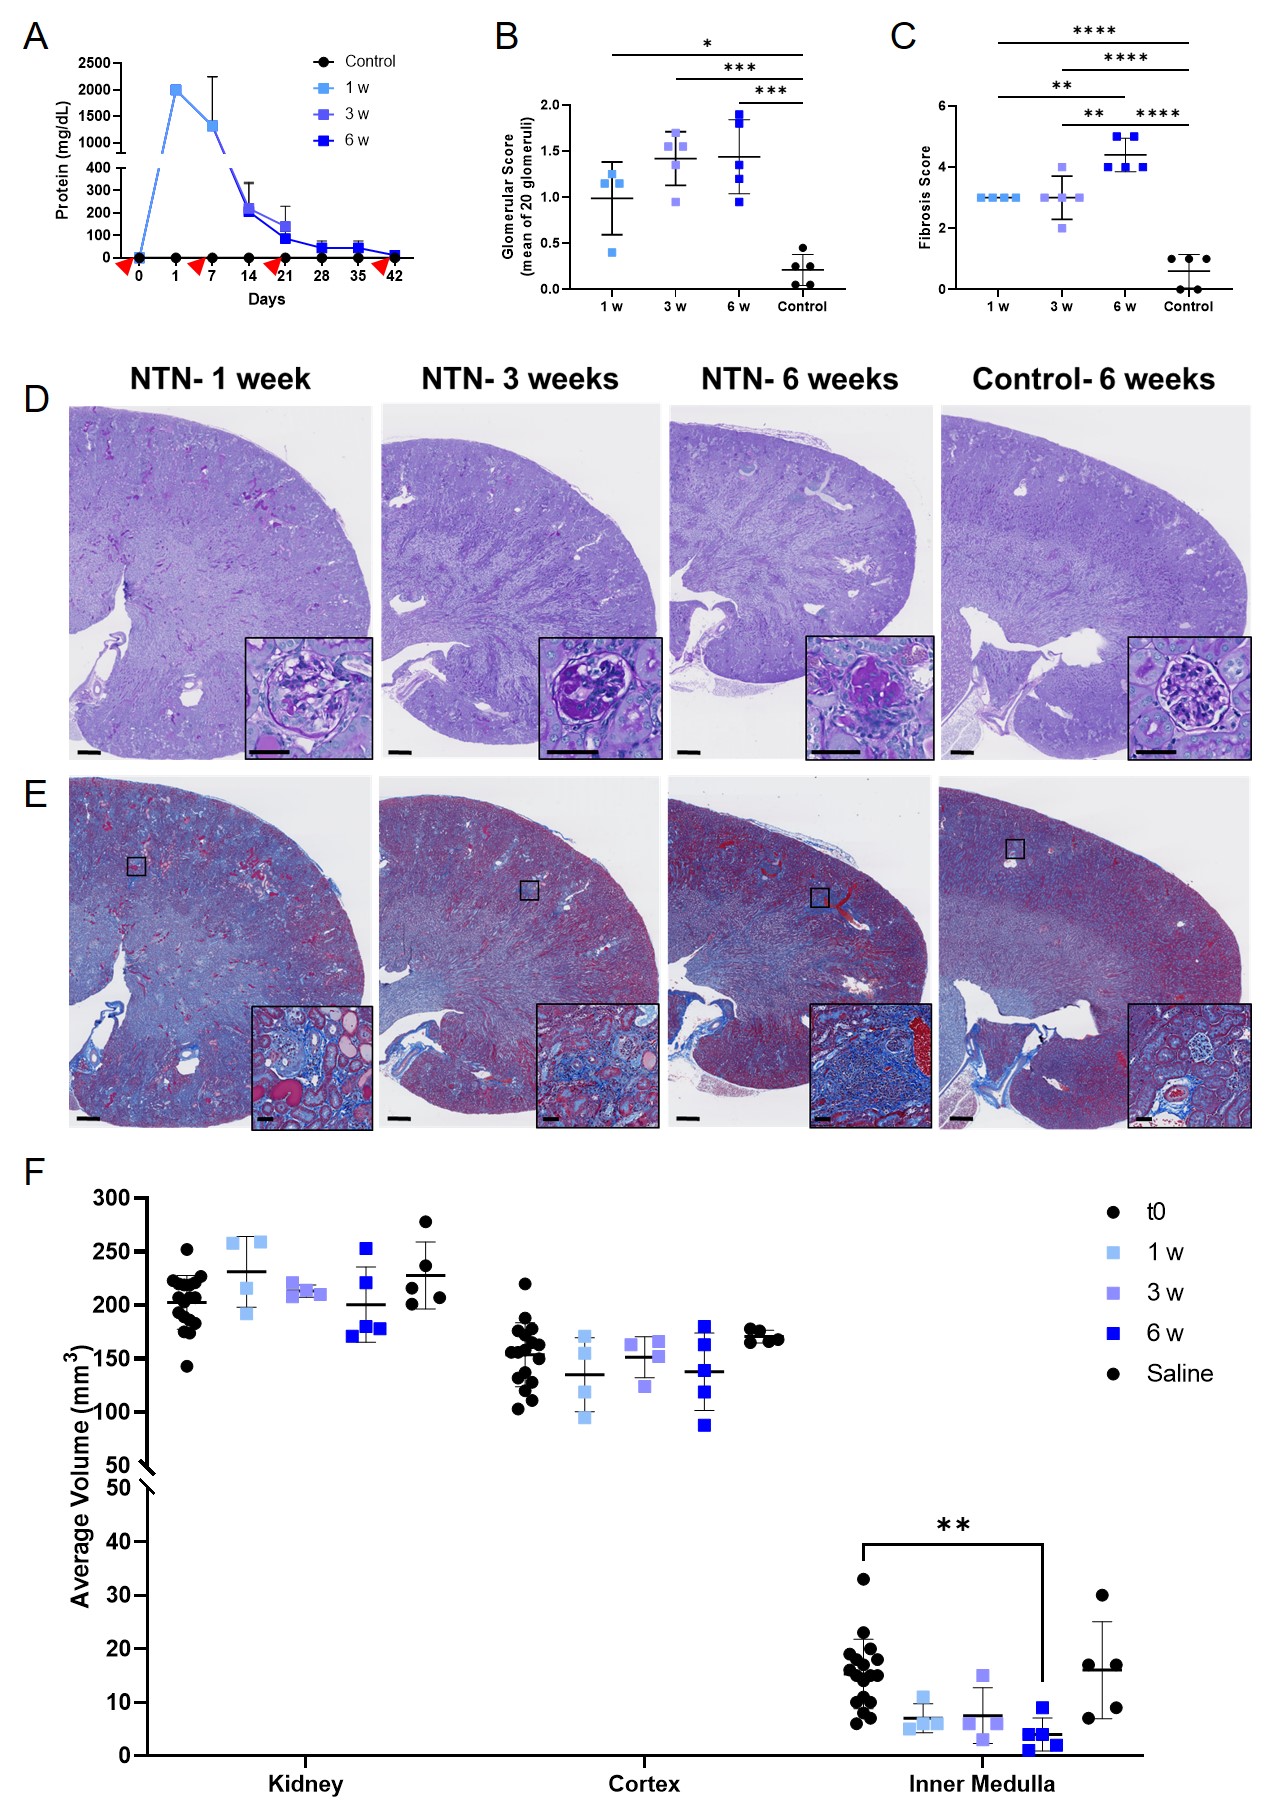
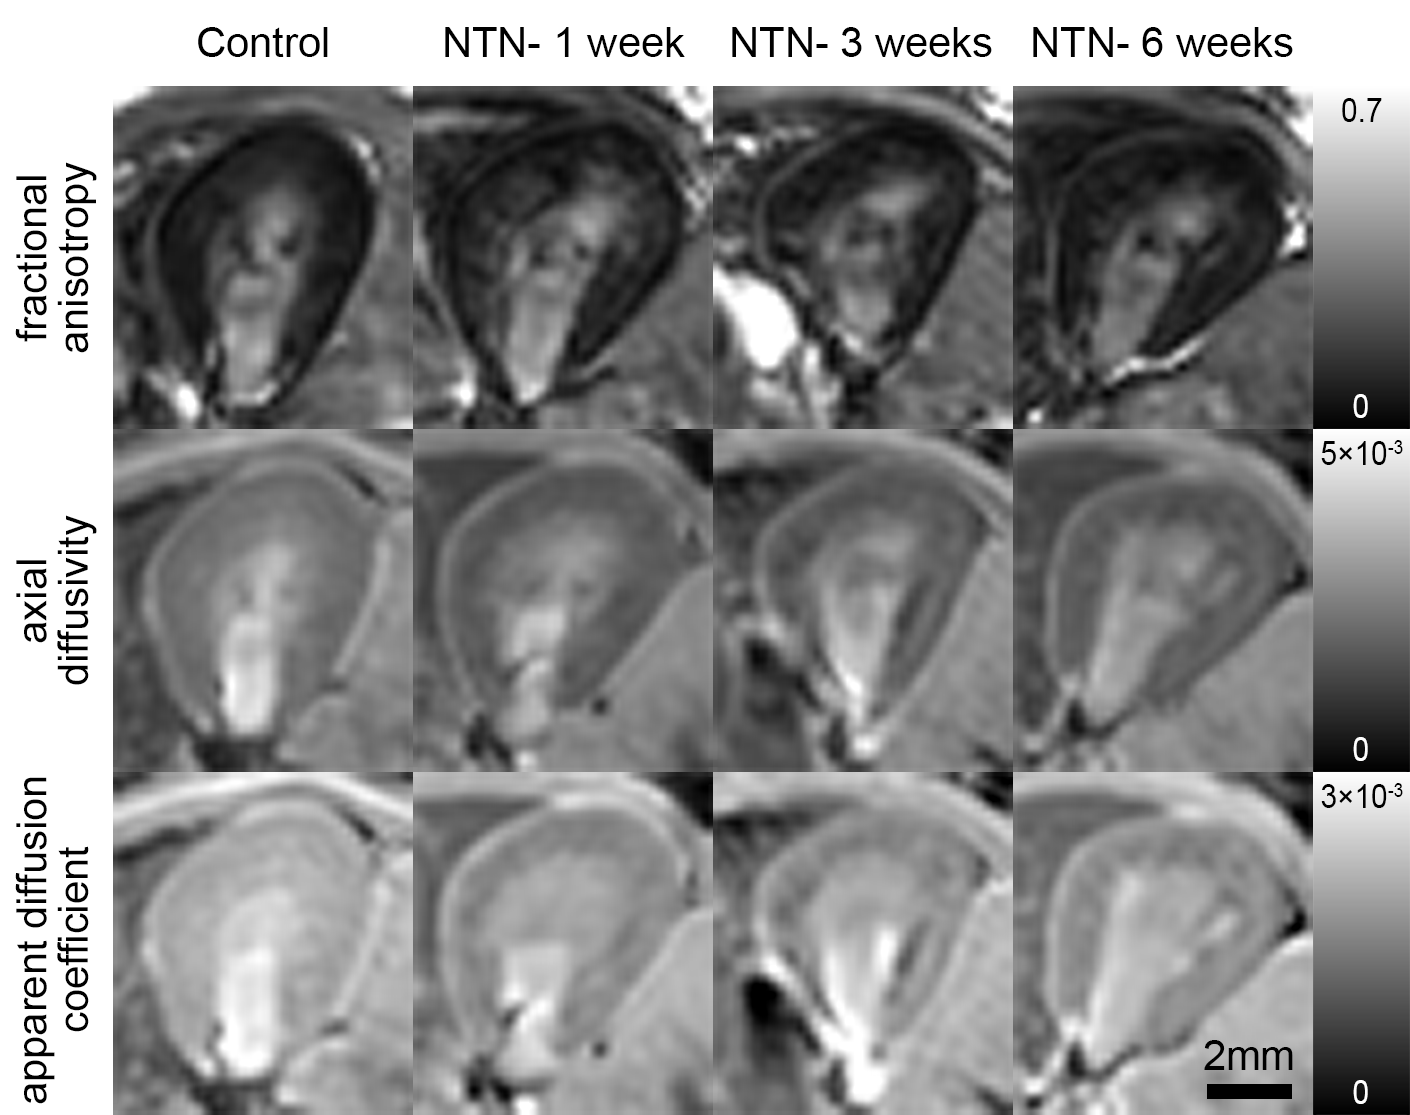
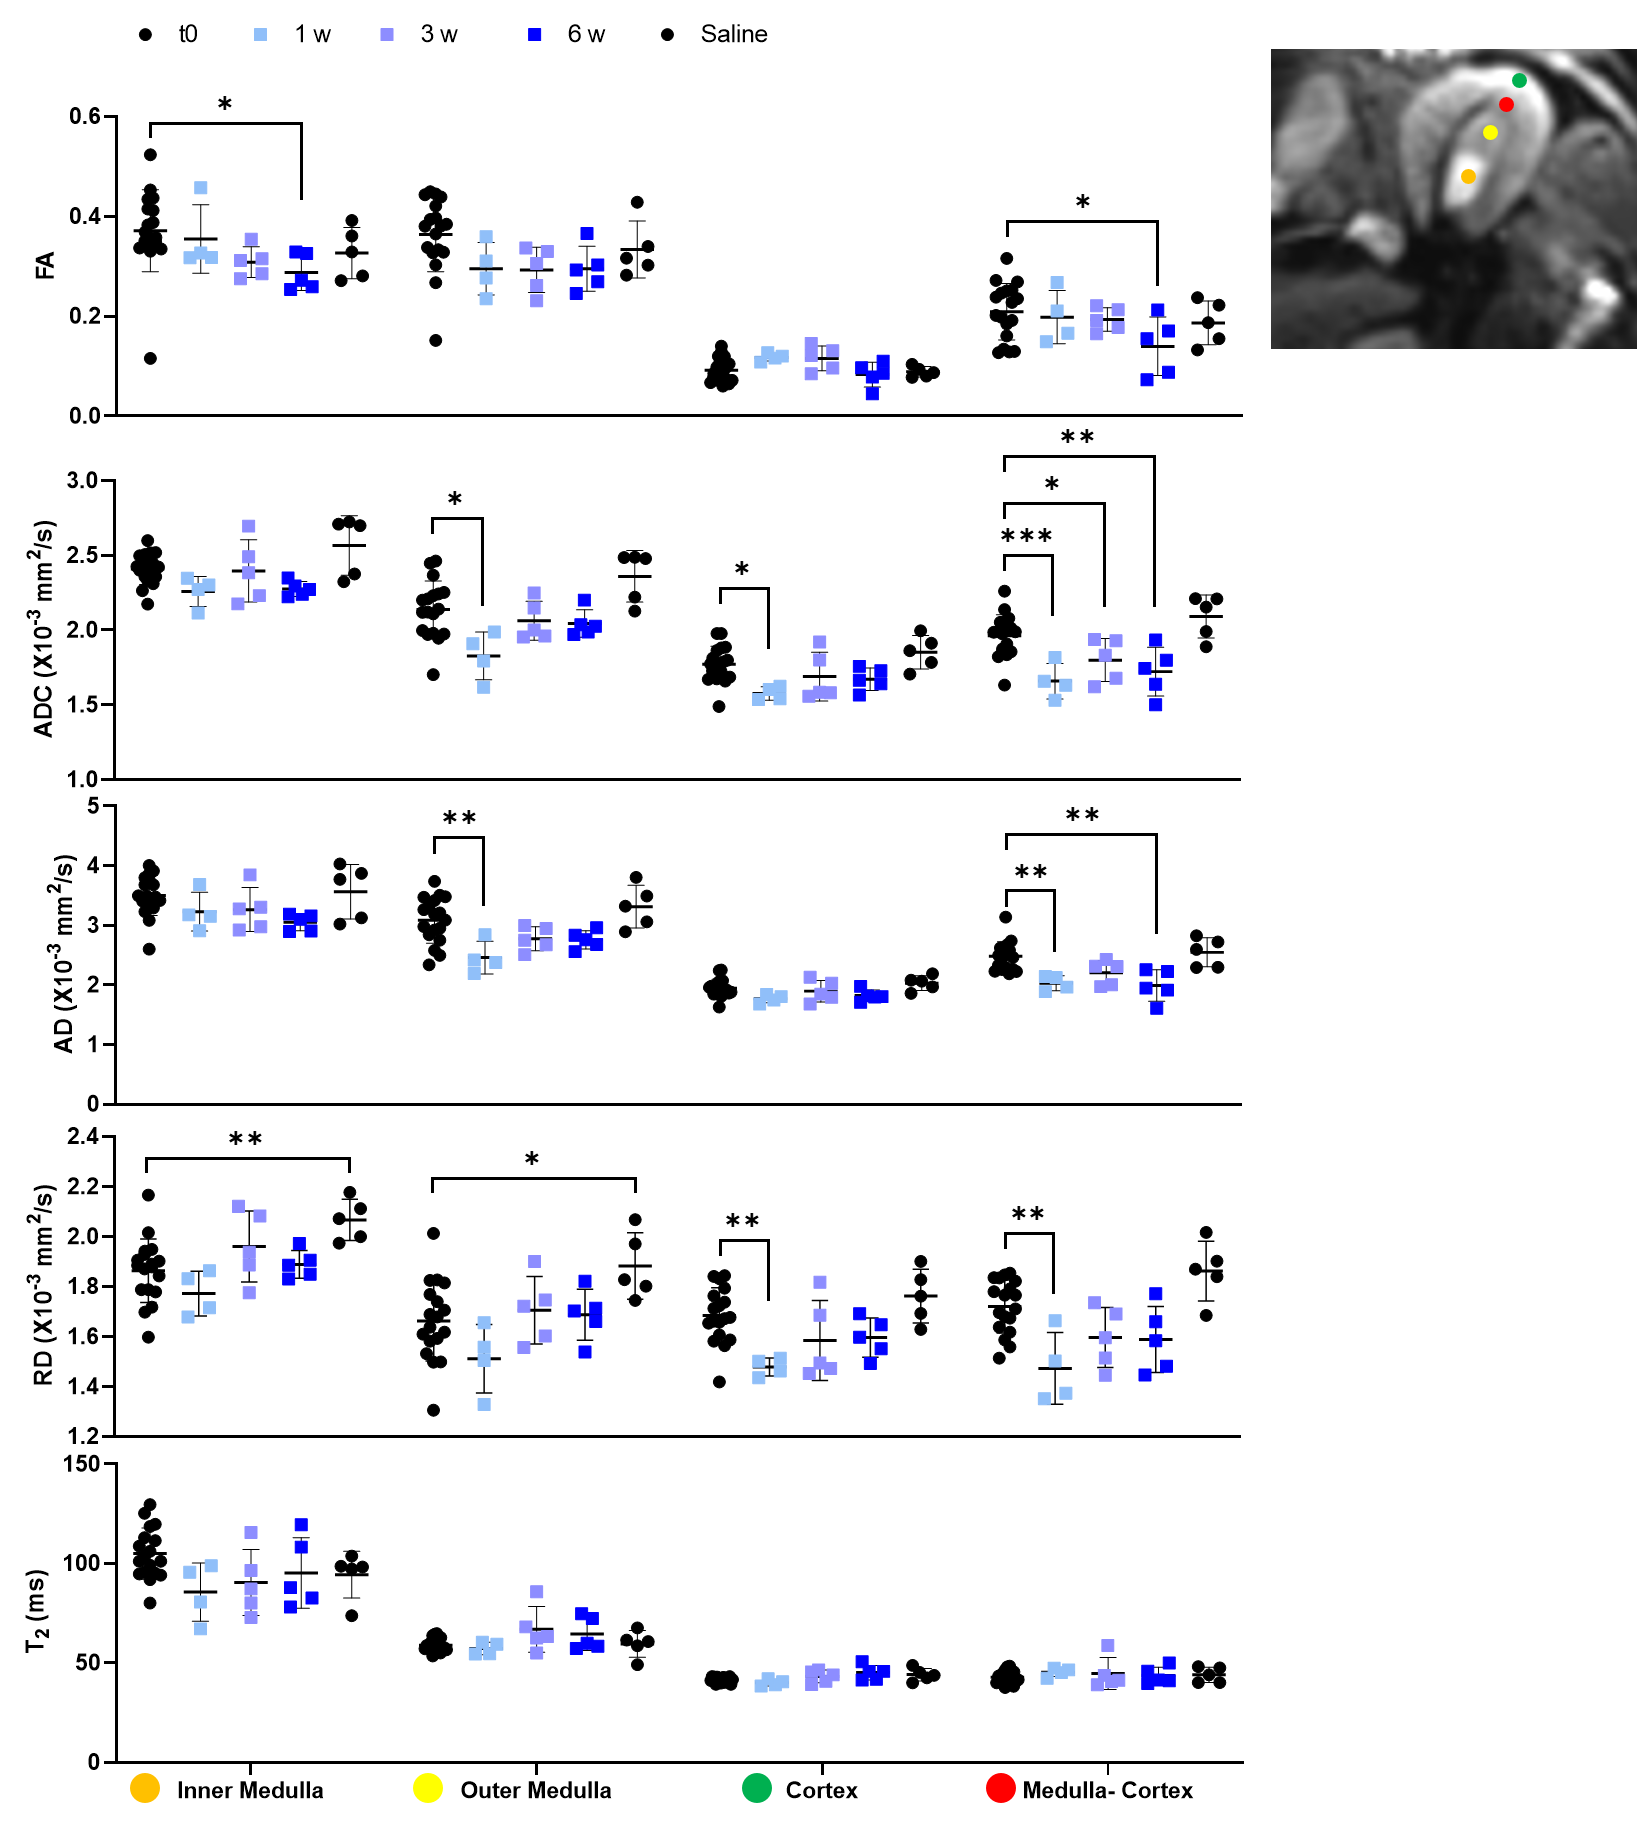
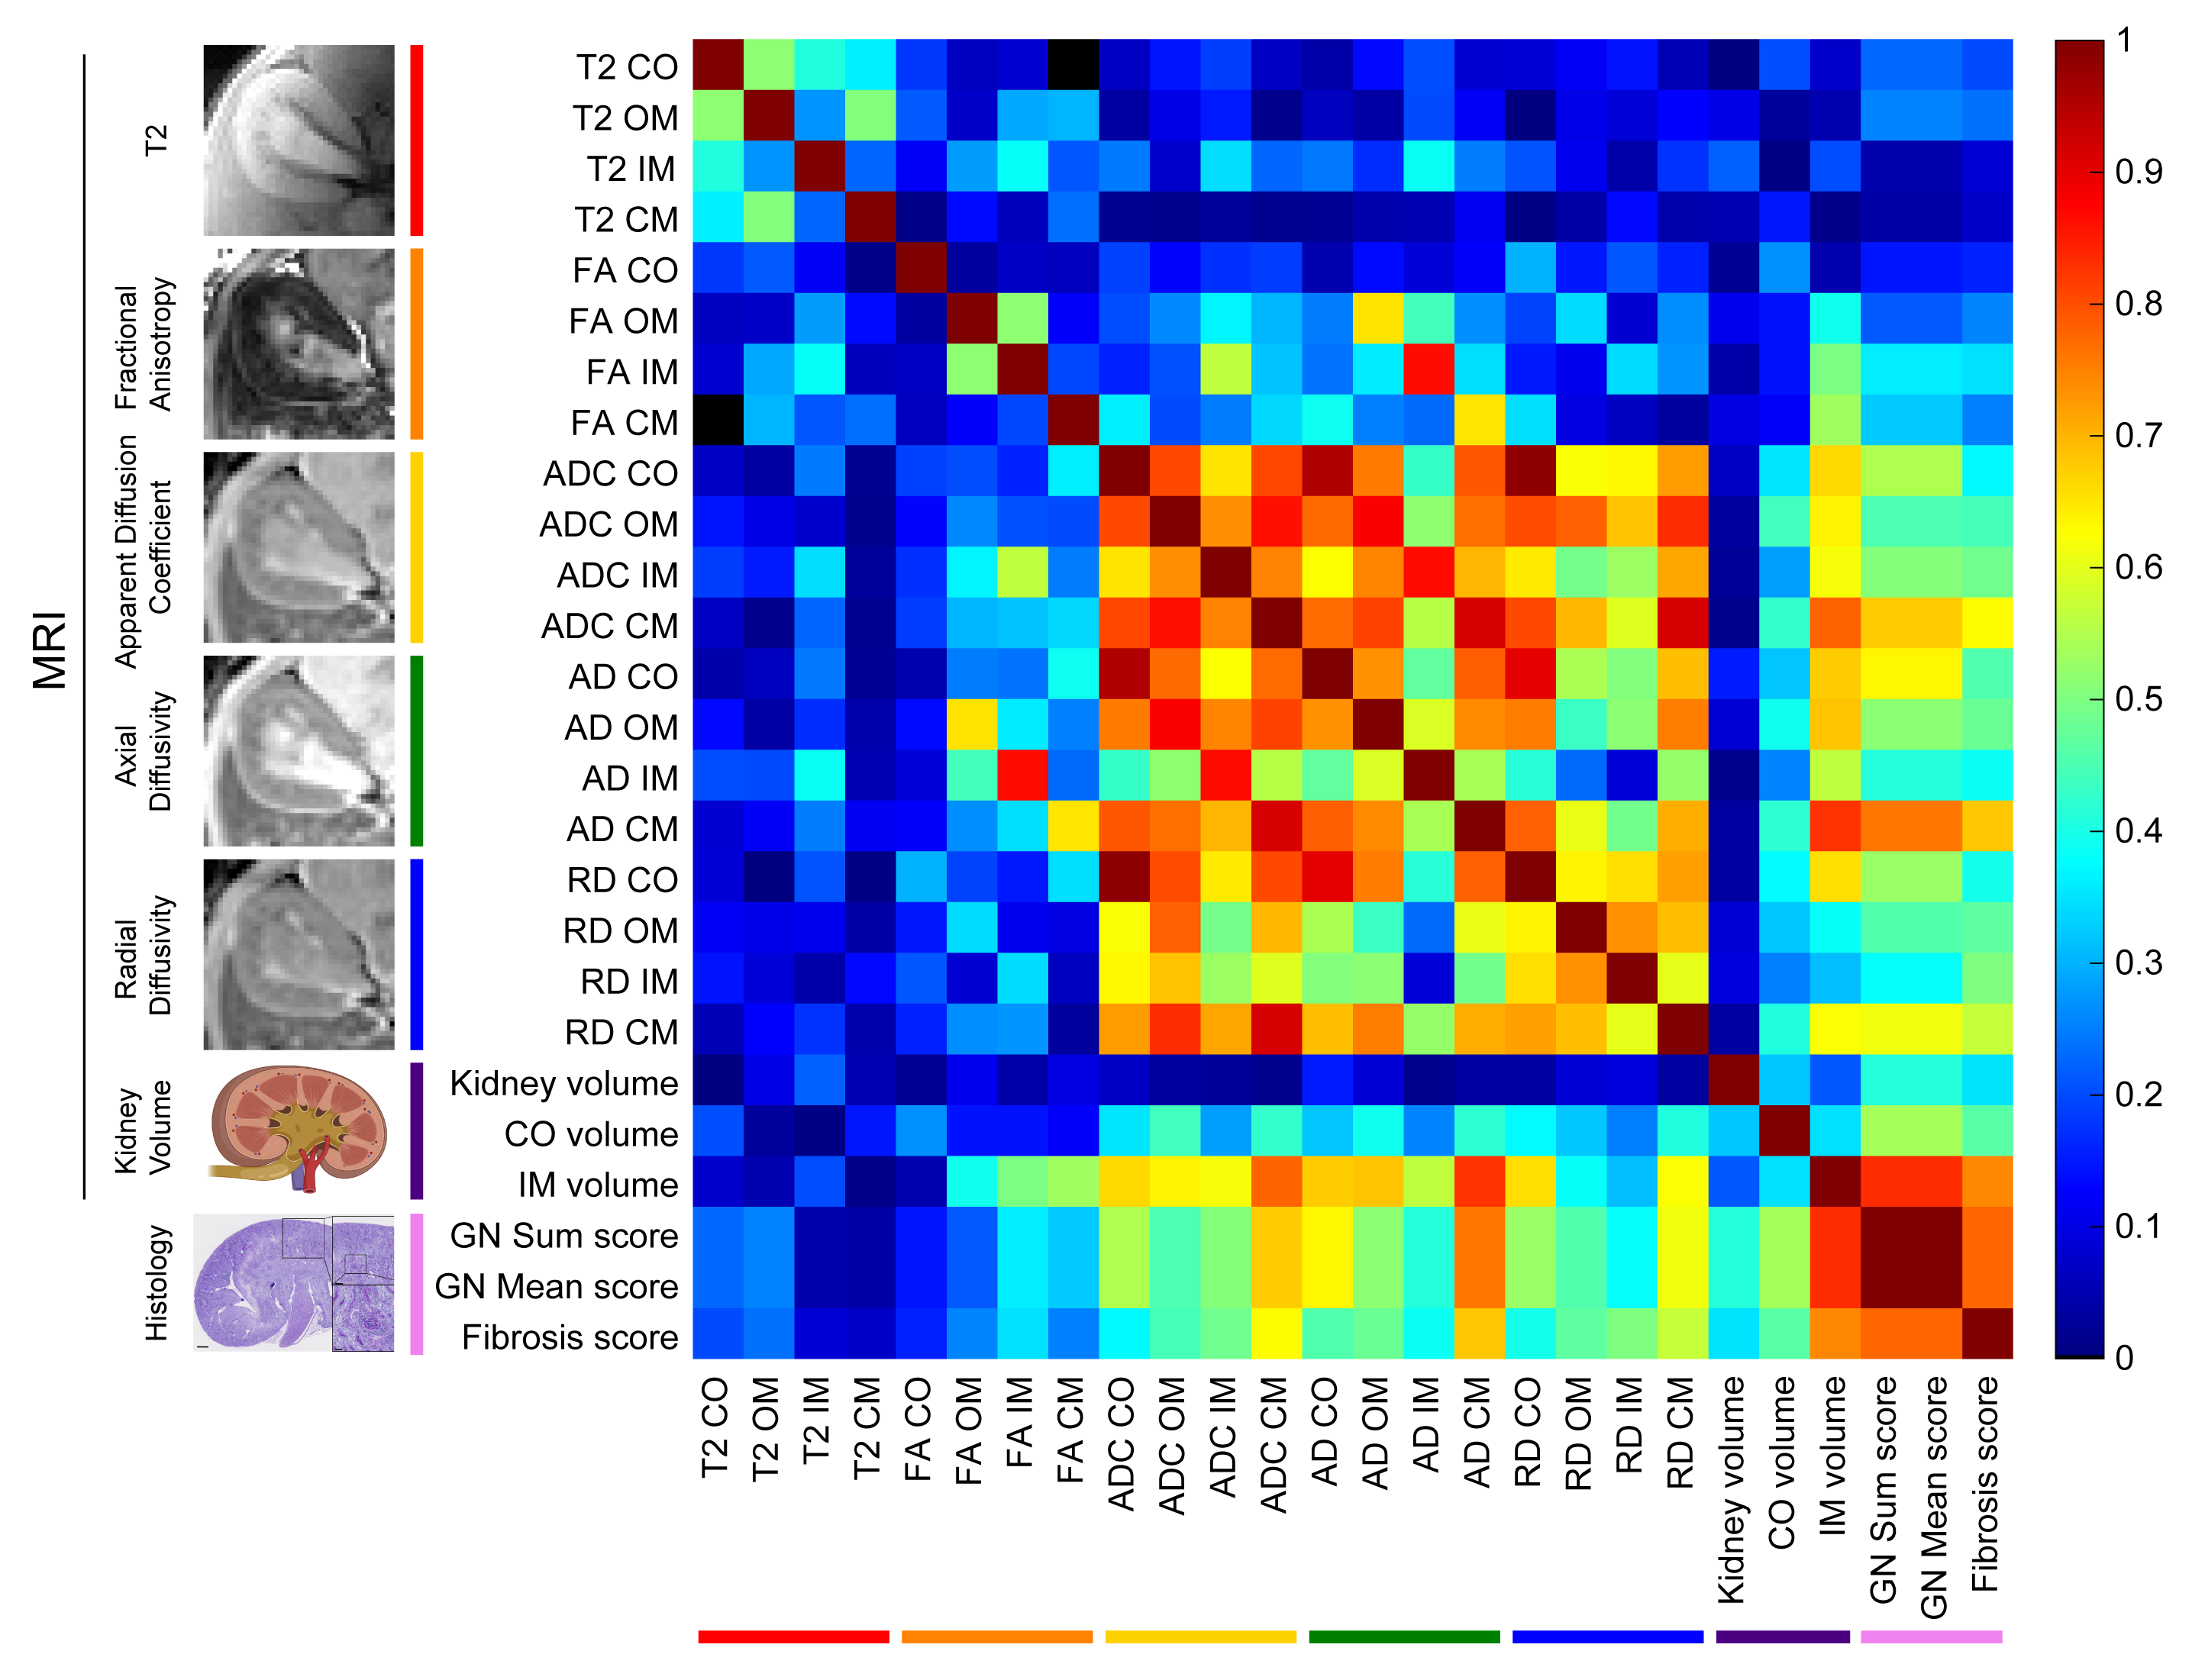
Representative MRI and histology of control and NTN after 6 weeks from injection are shown in Fig. 1. AD and ADC decreased in the NTN group compared to control (Fig. 1A-1B). The NTN group had increased glomerular injury (Fig. 1C- 1E) and fibrosis (Fig. 1F- 1H). T2-weighted and diffusion tensor imaging were performed longitudinally and compared with high-resolution terminal endpoints. The NTN group developed CKD with high proteinuric episodes on days 1-14 (Fig. 2A), along with mesangial expansion (Fig. 2B and D), and renal fibrosis (Fig. 2C and E). In addition, the average volume of the kidney’s inner and outer medulla was reduced with disease progression (Fig. 2E). Example diffusion parametric maps are shown in Fig. 3. FA, ADC and AD were reduced with time especially in the cortex-outer medulla border (Fig. 4). In vivo imaging metrics were correlated with ex vivo pathology scores (glomerulonephritis mean/sum score; fibrosis score) pairwise using the Spearman’s correlation coefficient and displayed in a correlation matrix (Fig. 5) to determine the relative strength of the metrics. ADC, AD, and RD had moderate correlations with glomerulonephritis and fibrosis scores; among all the regions correlations were strongest in CM. Regarding volume measurements, IM volume had the strongest correlation with pathology scores, while CO volume and whole kidney volume were moderately correlated.Discussion and Conclusion
Using DTI-MRI, we were able to detect changes associated with inflammation and interstitial fibrosis. Utilizing a comprehensive correlation analysis, we found diffusivities in the cortex-outer medulla border to be highly correlated with fibrosis, demonstrating the importance of local analysis and suggesting that fibrosis might be more focal than homogeneous. This demonstrates the value of whole kidney non-invasive imaging. For example, even a fibrosis-specific histology section from a needle biopsy can easily miss the focal fibrosis emanating from the glomeruli. Glomeruli only occupy for <2% of the total kidney volume in both animal and human kidneys4. Increased immune inflammation and new collagen fibers can both act as physical barriers that reduce water diffusion along the tubules. Indeed, FA, AD, and ADC decreased over time in accordance with the increase in injured glomeruli and fibrosis of the kidney found in histology. These results suggest that DTI-MRI can detect early stages of CKD prior to significant functional decline. Our study validates the advantages of DTI-MRI over traditional measurements and can be used for the development of diagnostic techniques of a variety of renal diseases.Acknowledgements
No acknowledgement found.References
1. Couser WG. Basic and Translational Concepts of Immune-Mediated Glomerular Diseases. J Am Soc Nephrol. 2012; 23, pp. 381-399.
2. Gilbert RE, Cooper ME. The tubulointerstitium in progressive diabetic kidney disease: More than an aftermath of glomerular injury?. 1999; Kidney Int 56: 1627–1637.
3. Levey AS, Coresh J, Tighiouart H, et al. Measured and estimated glomerular filtration rate: current status and future directions. Nat Rev Nephrol. 2020; 16(1):51-64.
4. Xie L, Koukos G, Barck K, et al. Micro-CT imaging and structural analysis of glomeruli in a model of Adriamycin-induced nephropathy. Am J Physiol Renal Physiol. 2019; 316(1):F76–F89.
5. Friedli I, Crowe LA, Berchtold L, et al. New Magnetic Resonance Imaging Index for Renal Fibrosis Assessment: A Comparison between Diffusion-Weighted Imaging and T1 Mapping with Histological Validation. Sci Rep. 2016; 6:30088.
6. Berchtold L, Crowe LA, Friedli I, et al. Diffusion magnetic resonance imaging detects an increase in interstitial fibrosis earlier than the decline of renal function. Nephrology, dialysis, transplantation: official publication of the European Dialysis and Transplant Association - European Renal Association 2020.
7. Selby NM, Blankestijn PJ, Boor P, et al. Magnetic resonance imaging biomarkers for chronic kidney disease: a position paper from the European Cooperation in Science and Technology Action PARENCHIMA. Nephrology, dialysis, transplantation: official publication of the European Dialysis and Transplant Association - European Renal Association 2018; 33(suppl_2):ii4-ii14.
8. Buchanan CE, Mahmoud H, Cox EF, et al. Quantitative assessment of renal structural and functional changes in chronic kidney disease using multi-parametric magnetic resonance imaging. Nephrology, dialysis, transplantation: official publication of the European Dialysis and Transplant Association - European Renal Association 2020; 35(6):955-964.
9. Xie L, Gandham V, Barck K, et al. T2 and diffusion tensor imaging of kidney disease in an epicutaneous TLR7 enhanced lupus mouse model. ISMRM 2020. p 0950.
Figures