2485
Mapping spatially heterogeneous single nephron function in the kidney using MRI.1Radiology, Washington University in St. Louis School of Medicine, St. Louis, MO, United States, 2Pediatric Nephrology, University of Virginia, Charlottesville, VA, United States, 3Radiology, Washington University in St. Louis School of Medicine, Saint Louis, MO, United States
Synopsis
Nephrons are the functional units of the kidney, coordinated with surrounding nephrons through the vasculature to filter blood plasma. We used in vitro CFE-MRI combined with Gd-DTPA contrast enhanced MRI to dynamically map single nephron physiology throughout the isolated, perfused rat kidney. We were able to map the heterogeneity and spatial variability of macromolecular binding and single nephron filtration. MRI appears to measure similar dynamics in single nephron filtration as intra-vital optical microscopy, with the advantage of measuring all nephrons in the kidney.
Introduction
Nephrons are the functional units of the kidney, coordinated with surrounding nephrons through the vasculature to filter plasma. Previous tools to investigate single nephron function have been restricted to superficial nephrons(1–3), and inadequate to understand how nephrons are functionally coordinated throughout the kidney. Here, we used MRI to dynamically map single nephron physiology in the isolated, perfused rat kidney. We compared macromolecular binding and filtration in each nephron, providing a multi-scale view of the relationship between kidney structure and function.Methods
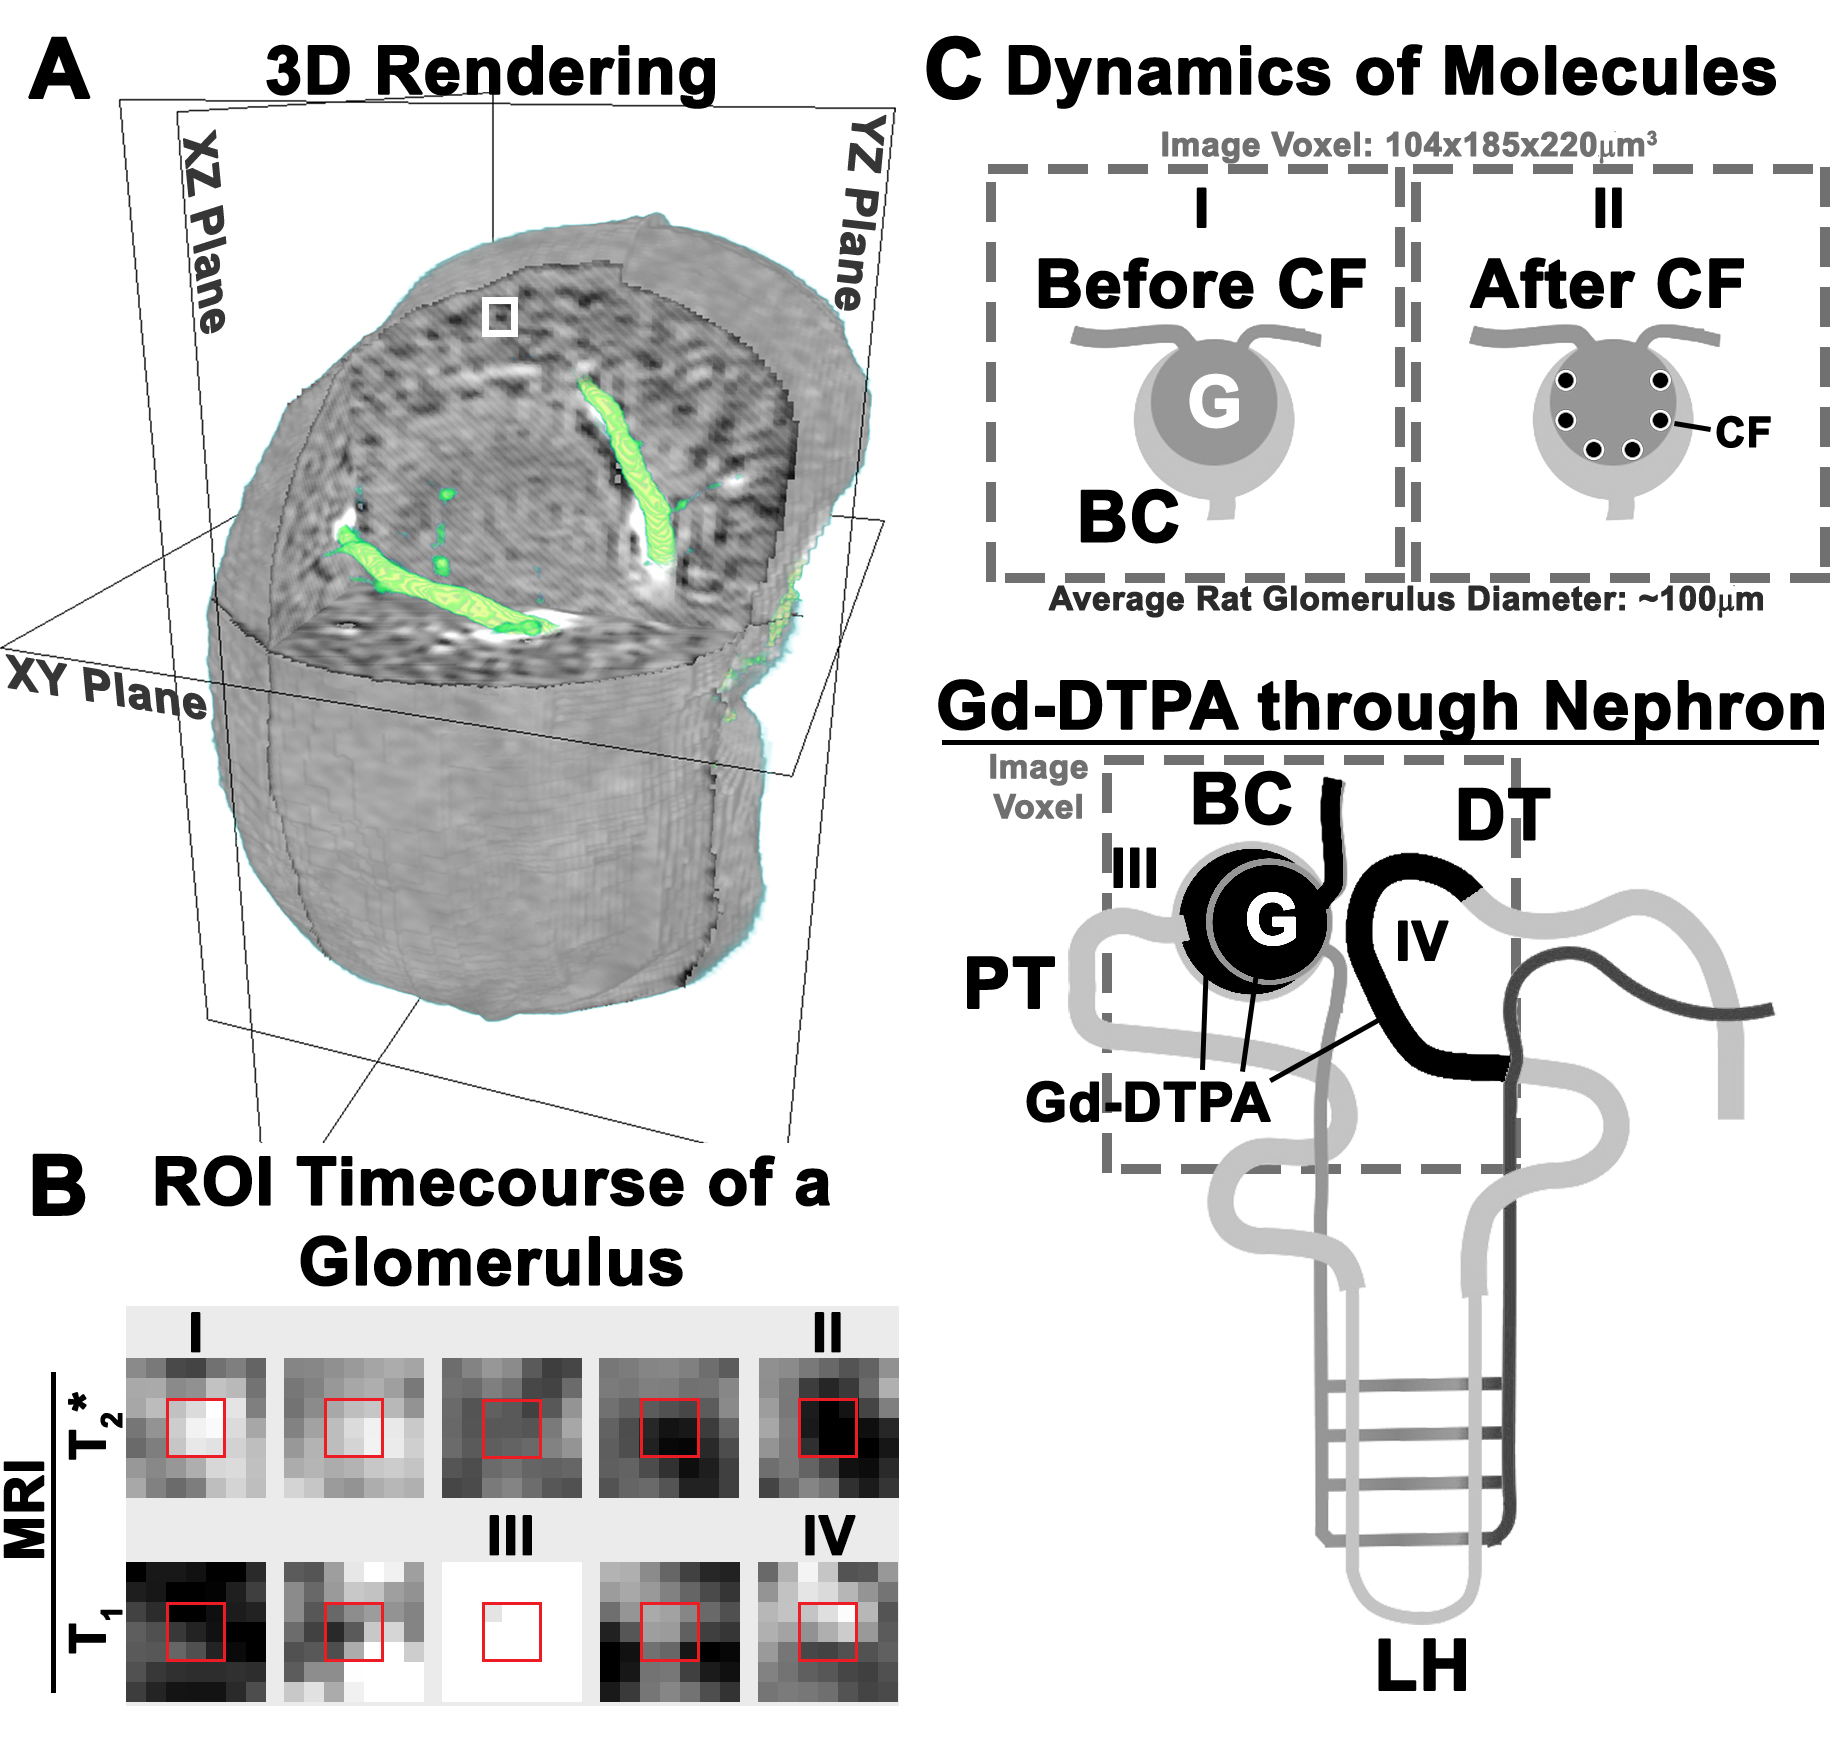
Male Sprague-Dawley rats (n=4) were anesthetized (ketamine/xylazine). We removed the right kidney. Kidneys were flushed with Lifor(4), and placed on ice for transport to MRI and connection to perfusion apparatus with a custom imaging platform and RF probe. Temperature was maintained at 37°C. A cell-free physiological medium was used containing Krebs-Ringer solution with Fraction V BSA (5.5g/100mL), select amino acids(5,6), and 95/5% O2/CO2 bubbled in. Flow rate was maintained at 6ml/min and line pressure was measured at the beginning and end of each experiment(7,8).Glomerular macromolecular binding: We used cationic ferritin (CF) as a glomerulus targeted contrast agent(9–12). CF binds to the glomerular basement membrane, allowing us to identify all individual glomeruli and measure CF binding kinetics using T2*-weighted MRI (CFE-MRI)(11,13). 0.033mg/mL of CF in medium was perfused for 10 minutes after ~5 minutes of perfusion without CF. Single nephron filtration: Gadolinium-DTPA (Gd-DTPA) is freely filtered with negligible reabsorption(14). A bolus of 12.5umol of Gd-DTPA was administered and was not recirculated, ensuring any signal enhancement at the glomerulus after the initial bolus would reflect only Gd-DTPA in the distal tubule. Following the bolus, the kidney was perfused with physiological medium without contrast for ~10min.
Imaging was performed using a Bruker 7T/30 MRI. All experiments used a 3D gradient recalled echo (GRE) with flow-compensation and a resolution of 104.2x184.9x220.0 um3. For CFE-MRI, we used T2*-weighted (T2*w) GRE with TE/TR = 12.6/45, flip angle (FA)=45°, and temporal resolution = 2.83min. For imaging Gd-DTPA filtration, we used T1-weighted (T1w) GRE with TE/TR = 3.23/22, FA=45°, and temporal resolution = 1.38min.
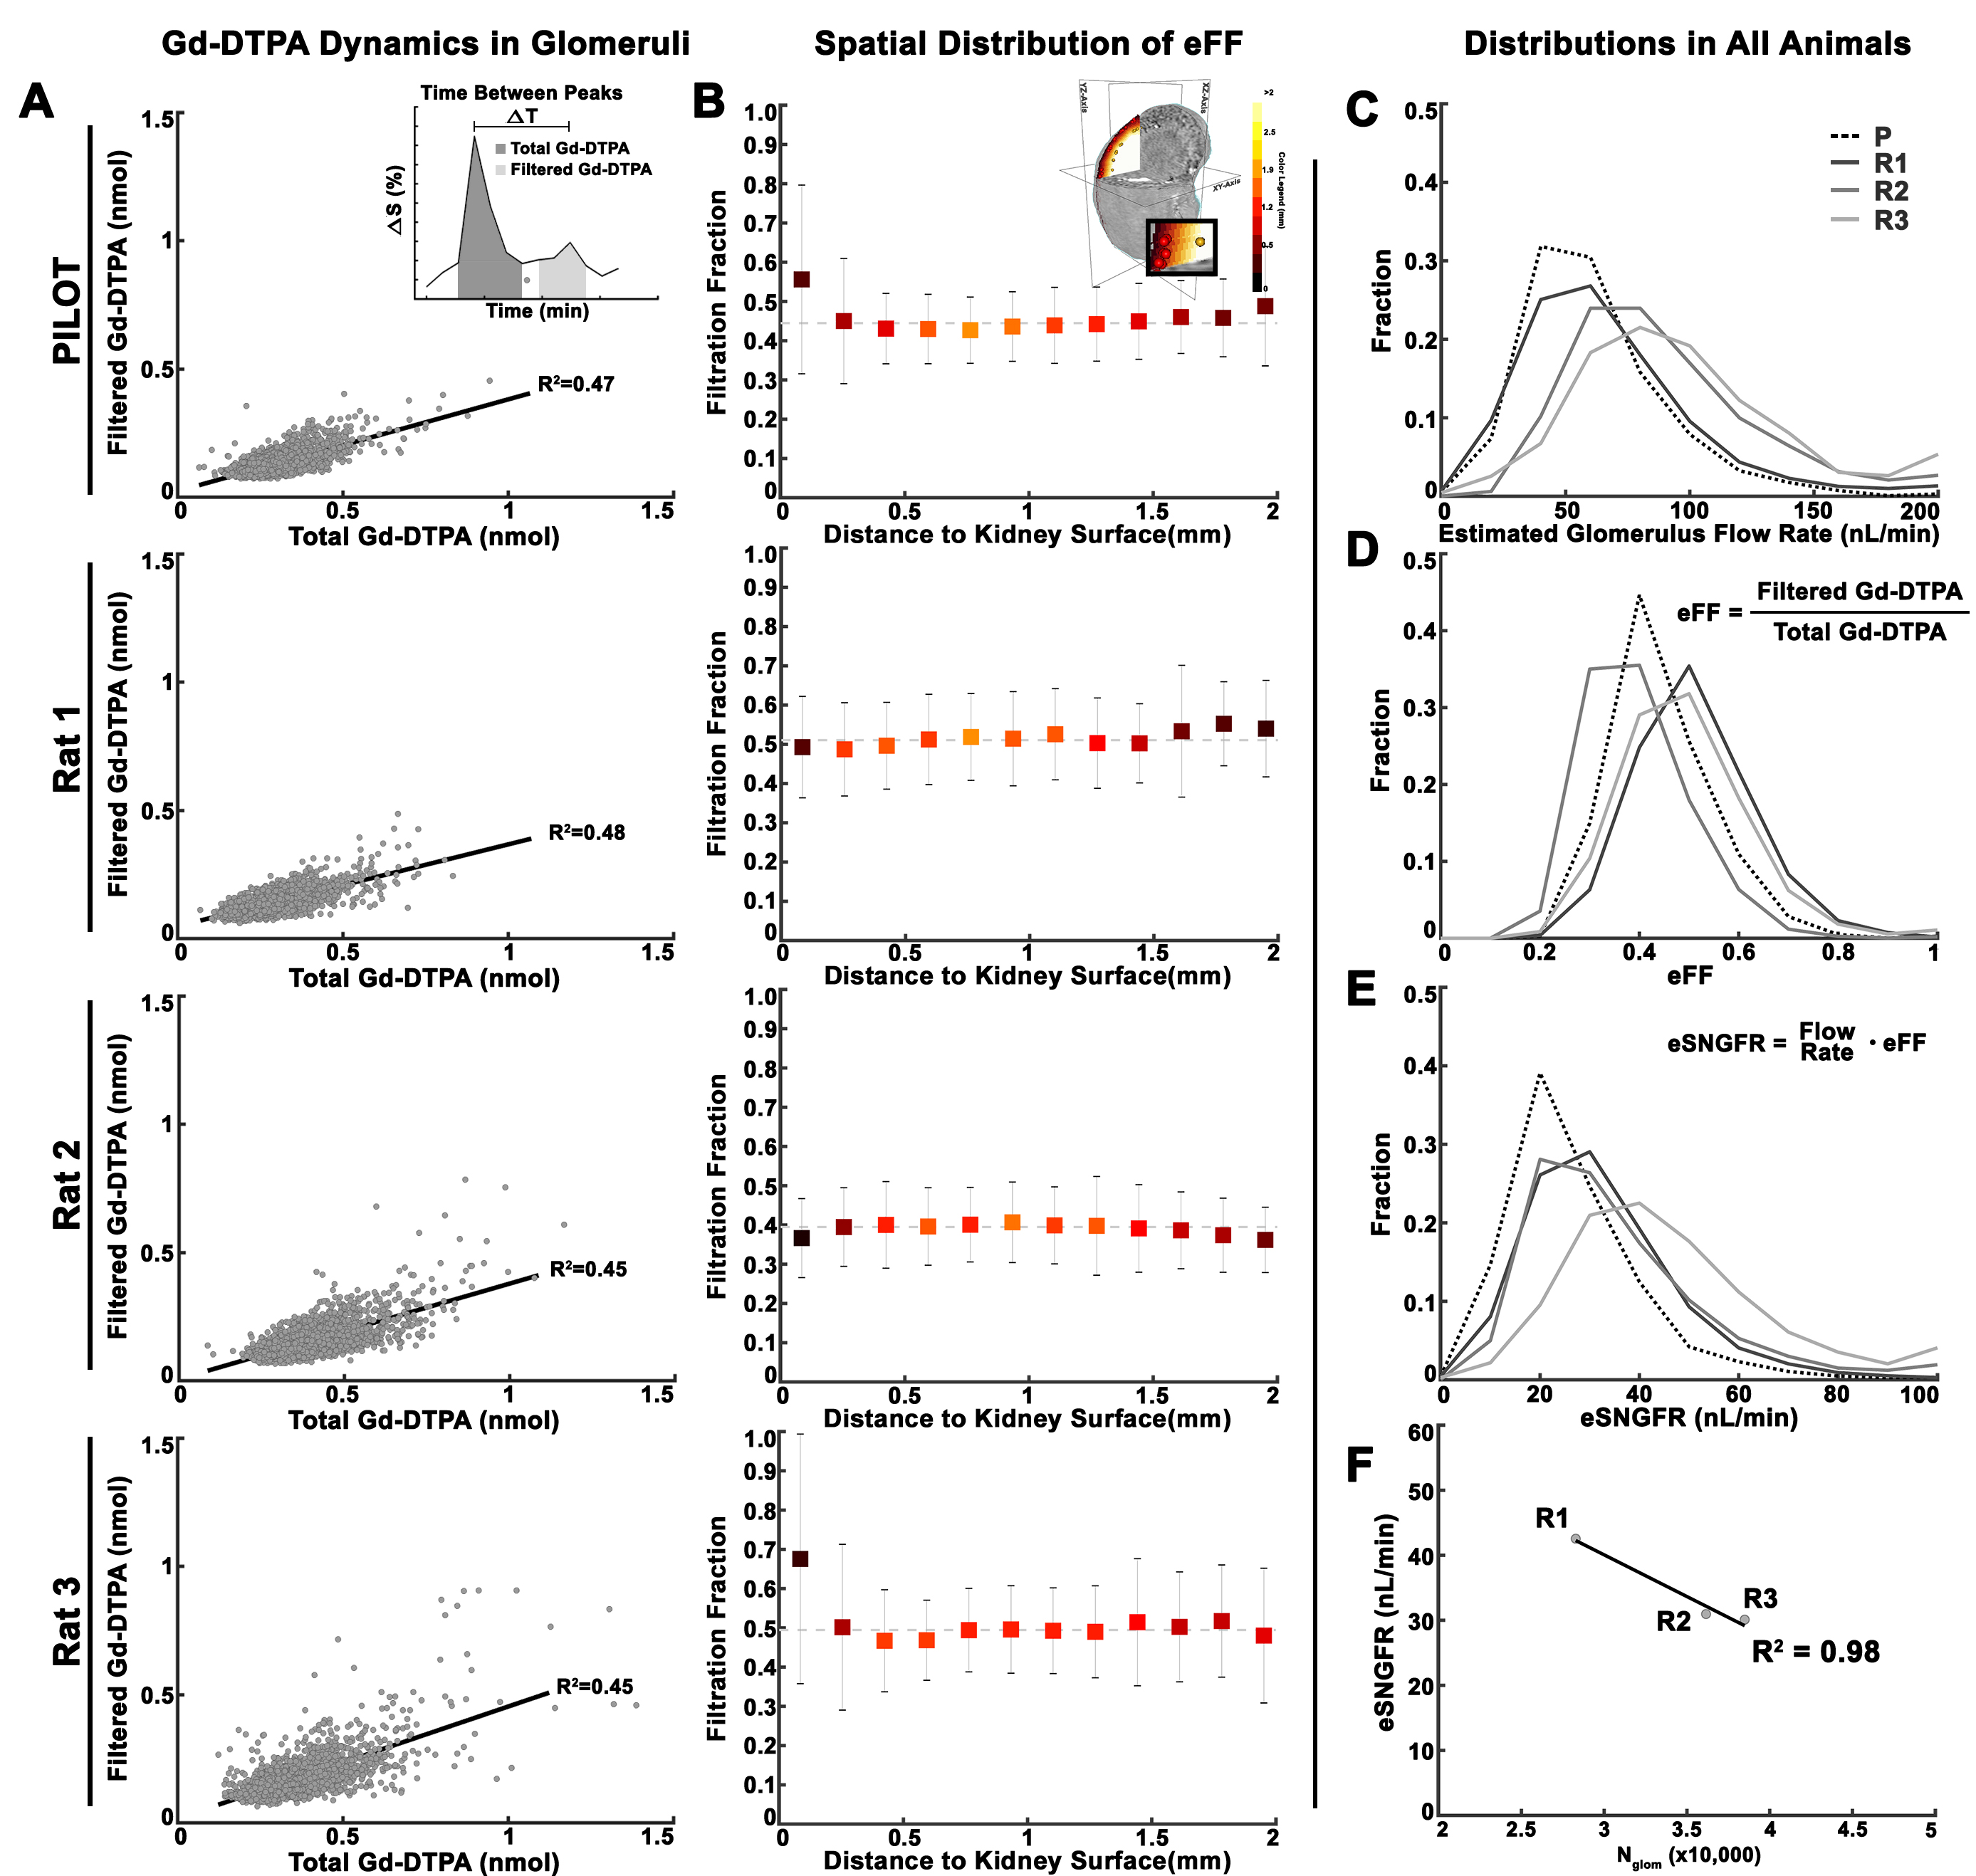
AFNI and Matlab were used for 3D co-registration and analysis. To investigate macromolecular binding of CF, we characterized the time course during and after CF injection using a bi-exponential model and nonlinear least squares fitting. To investigate Gd-DTPA filtration we calculated the area under each of two peaks in the time course, observed only near glomeruli. We used time-courses from the renal artery at injection to calibrate [Gd-DTPA]. Area under the first peak was a measure of total [Gd-DTPA] through the voxel. Area under the second peak (~7 minutes later) was a measure of Gd-DTPA filtered through glomerulus and concentrated in the distal tubule near the glomerulus after passage through the loop of Henle. We estimated filtration fraction (eFF) using the ratio of filtered Gd-DTPA (AUC second peak) to total Gd-DTPA (AUC first peak). A mono-exponential model was fitted to measure glomerular flow rate (Qglom). We then estimated single nephron glomerular filtration rate (eSNGFR) usng: (15). Glomerular number (Nglom) was measured using ex vivo 3D T2*w MRI and custom software(10).
Results
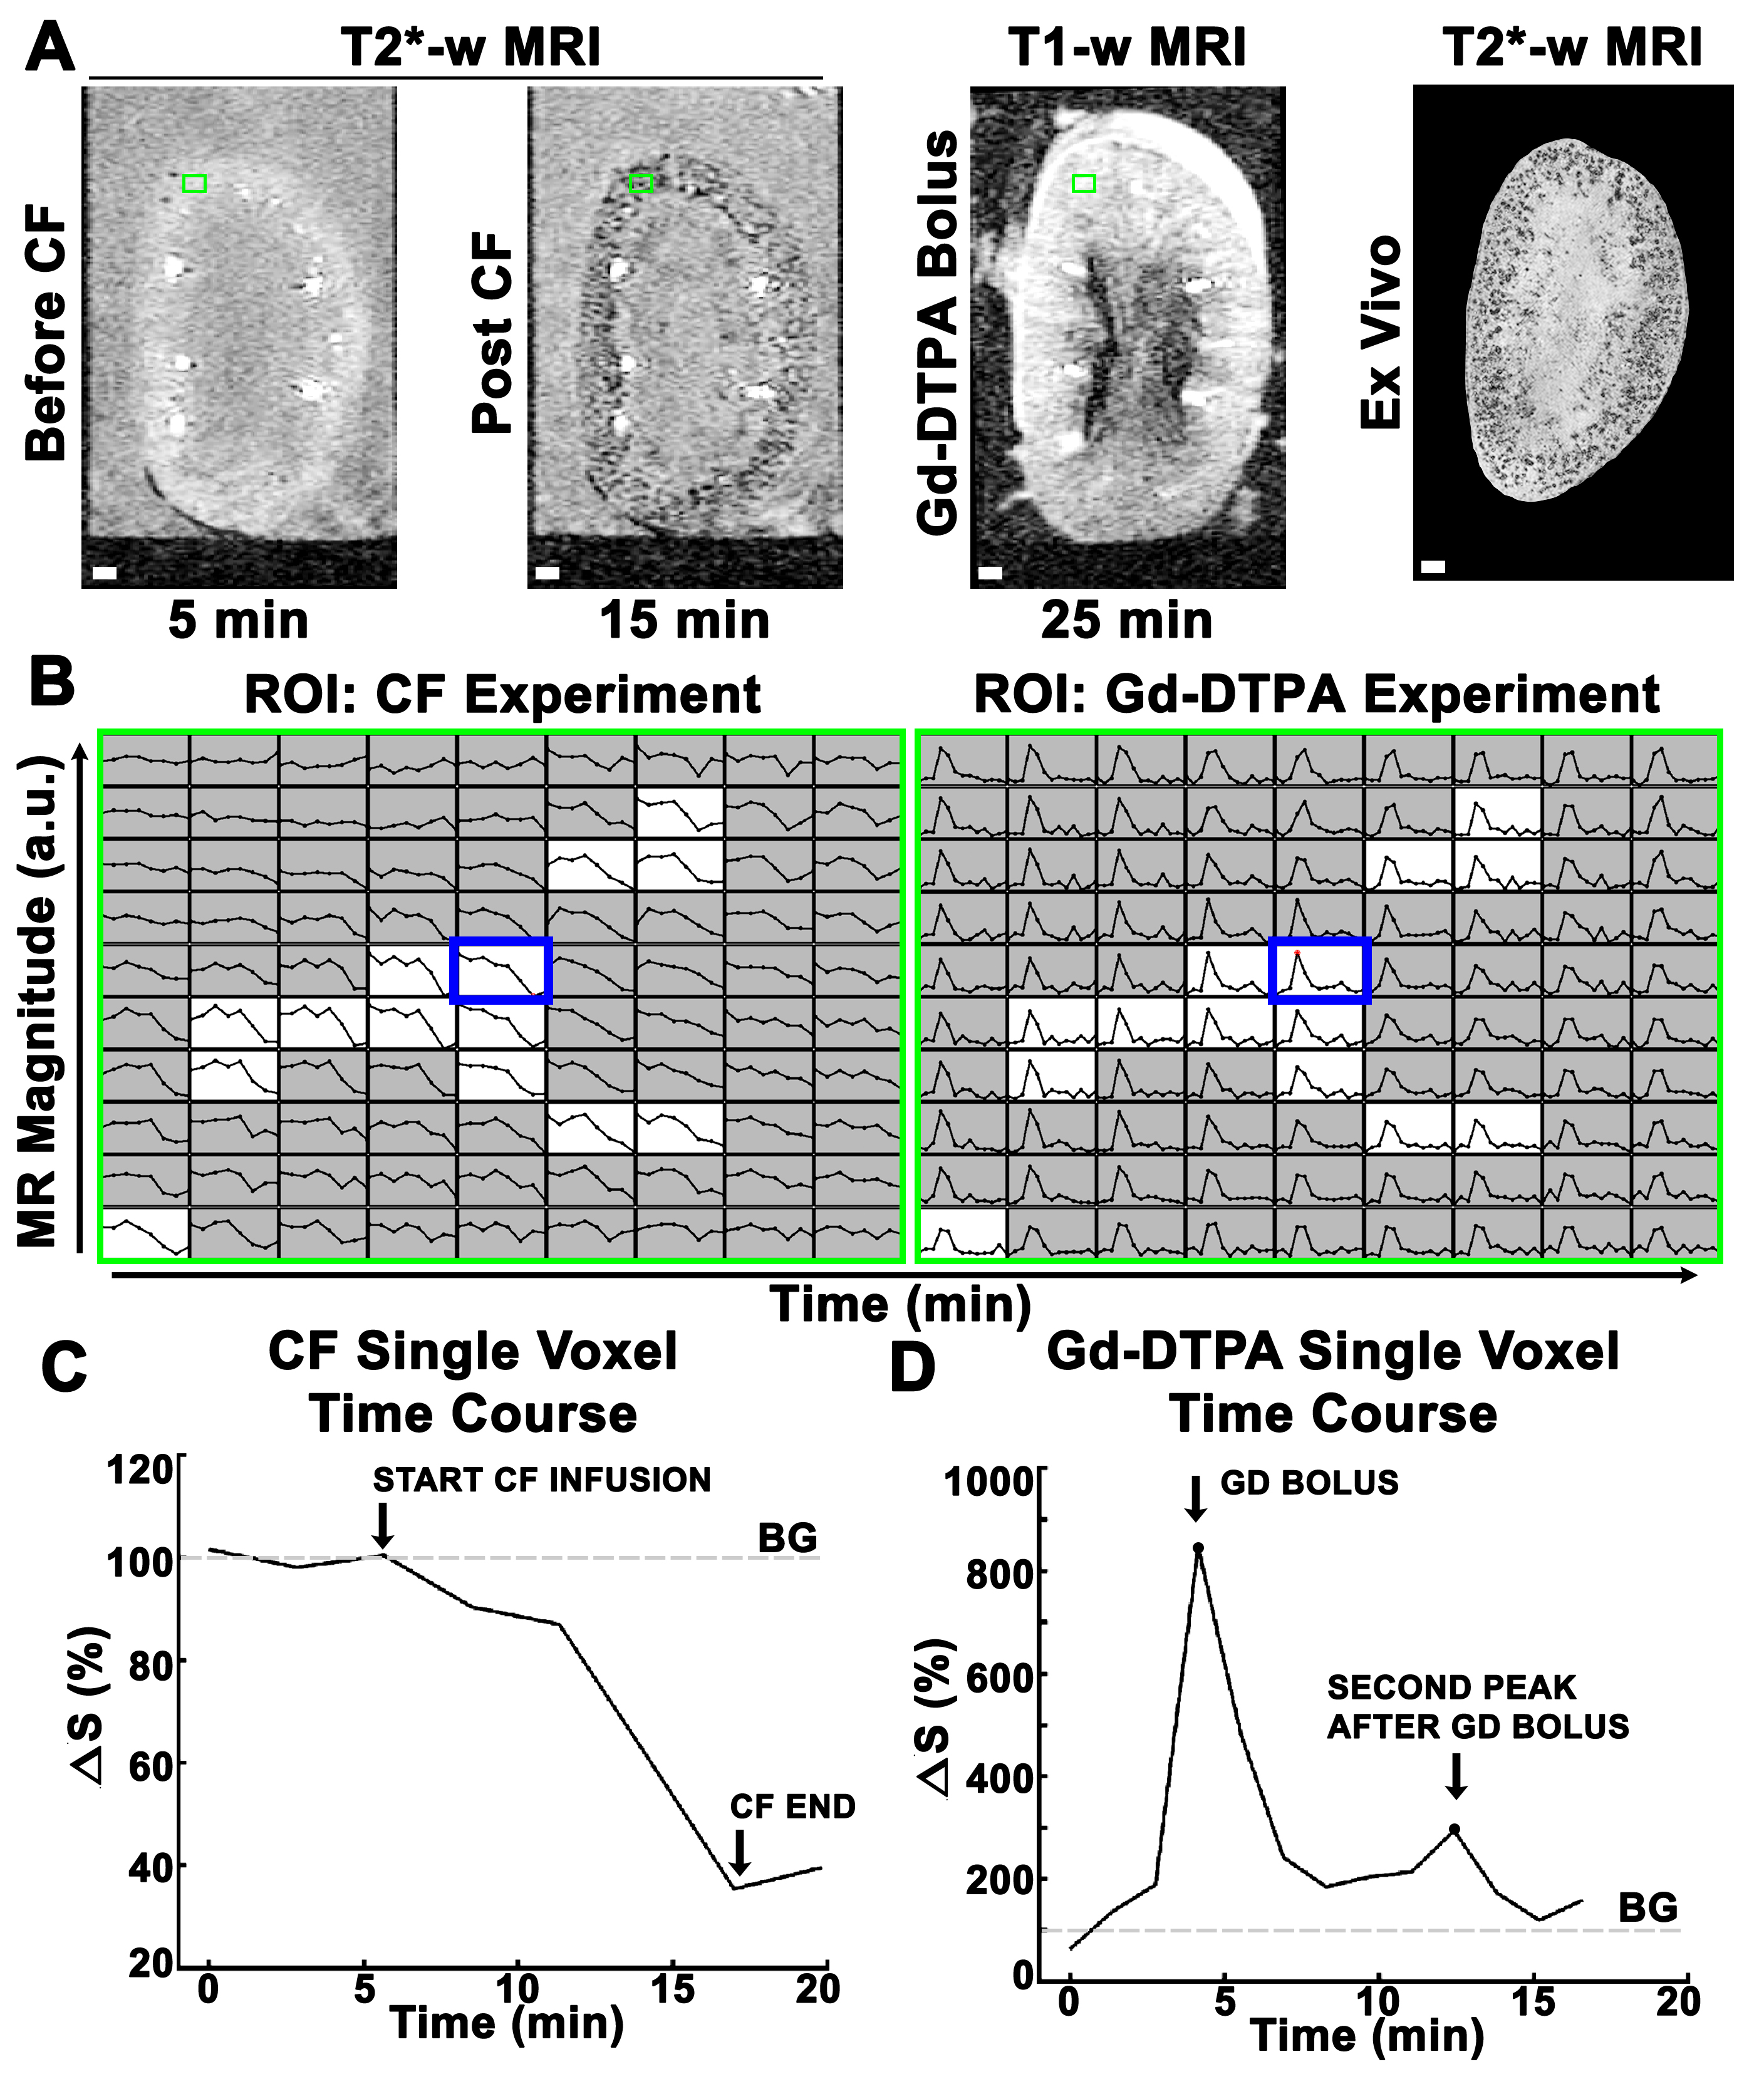
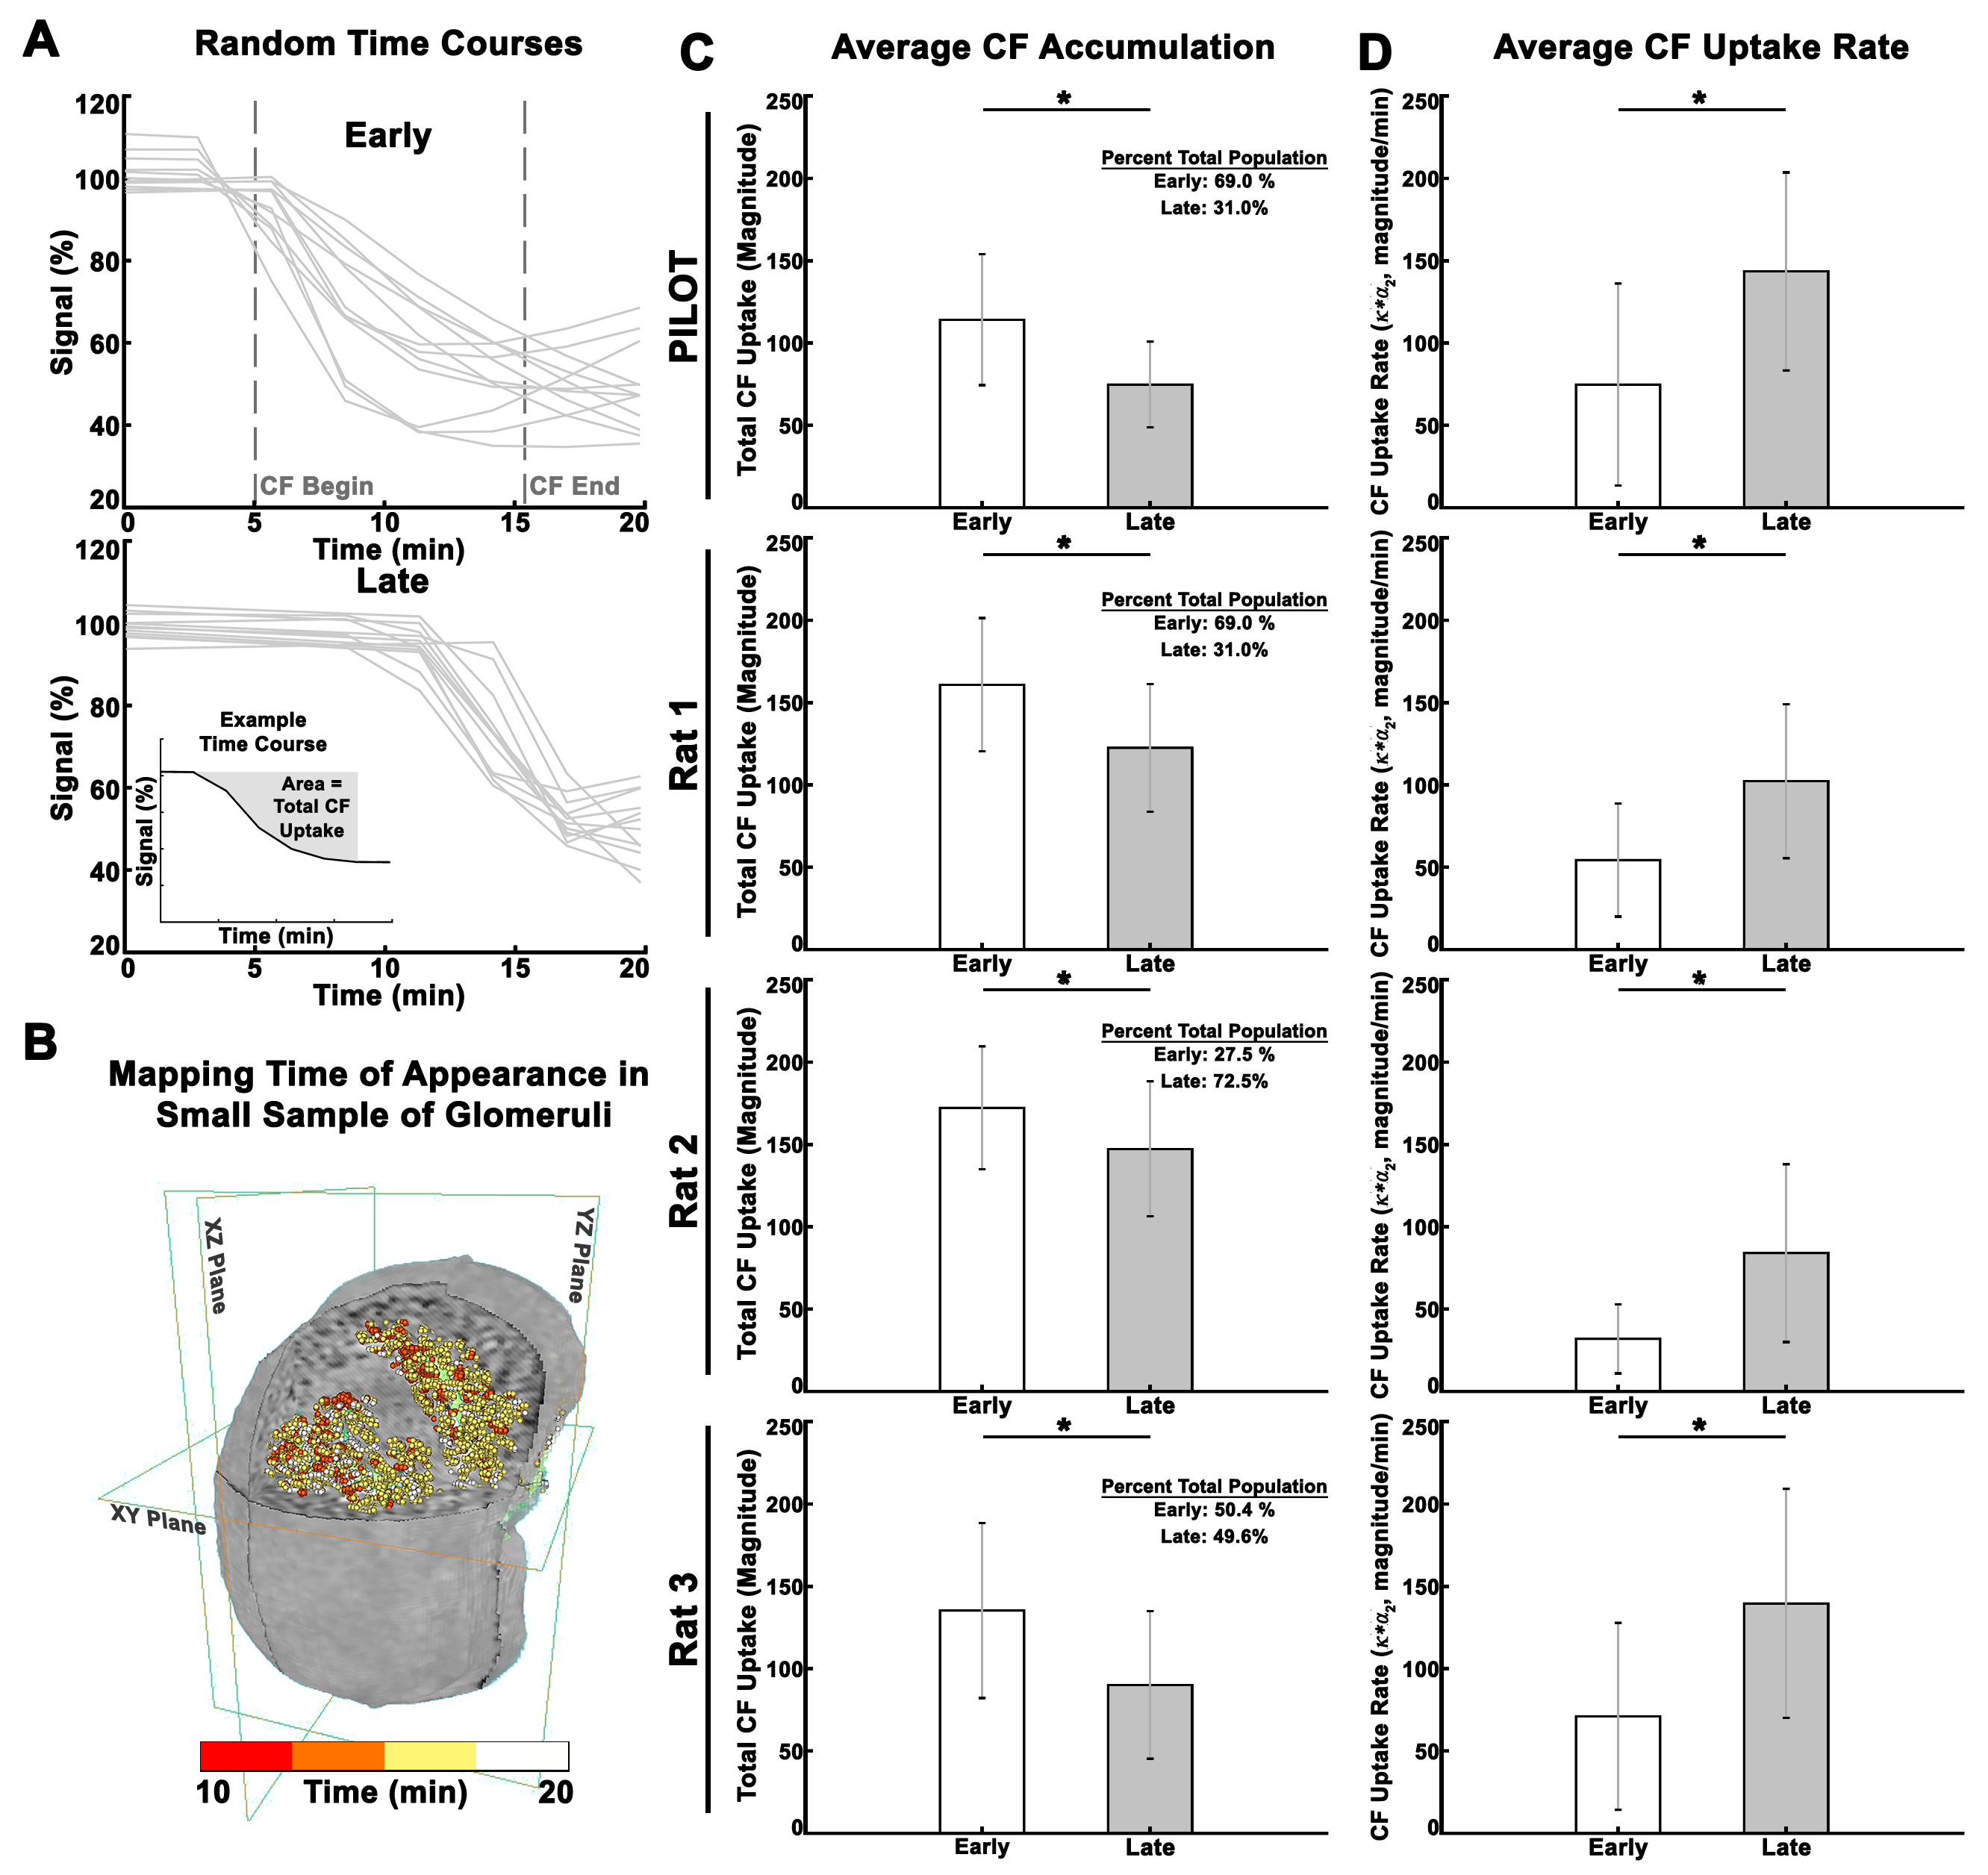
We mapped the signal time course in each voxel in the kidney (Fig. 1A-B). During CF injection (10min), CF- labeled glomeruli became slowly visible as dark punctate spots (Fig. 1A, C). Vasculature remained bright because of the low CF concentration in vessels (Fig1A). We observed variability in the time glomeruli appeared (Fig. 2A-B). We categorized glomeruli into early and late groups, based on the timing of the normalized signal to initially decrease. Early group glomeruli had significantly higher total CF binding compared to late group glomeruli (Fig. 2C), but significantly slower binding rates (Fig. 2D).To map single nephron filtration, kidneys received a bolus of Gd-DTPA. Signal enhancement was observed shortly after bolus (Fig. 1A). Voxels with no glomeruli or voxels in medulla exhibited only one peak. In and near glomerular voxels, there was a second peak several minutes later (Fig.1D). We quantified both peaks (Fig. 3A, top inset). On average, [Gd-DTPA] from the second peak was higher when [Gd-DTPA] from the first peak was higher (Fig. 3A, mean R2 = 0.46±0.2). eFF was spatially heterogeneous, but did not vary significantly with depth from kidney surface (Fig. 3B). eSNGFR was computed for each nephron (Fig. 3C-E), and median eSNGFR was strongly inversely correlated with Nglom (Fig. 3F, R2 = 0.98).
Discussion
We used MRI to investigate macromolecular and free-filtration dynamics in isolated perfused rat kidneys. Mean values of eSNGFR measured here matched literature values(1). This study controlled for constant flow, but future work will examine single nephron filtration using constant pressure. MRI appears to measure similar dynamics as intra-vital optical microscopy(16) in the individual nephron, with the advantage of capturing all nephrons in the kidney. This work provides a framework to use MRI to map single nephron physiology (Fig. 4) and examine spatially coordinated filtration across the whole kidney.Acknowledgements
No acknowledgement found.References
1. Horster M, Thurau K. Micropuncture studies on the filtration rate of single superficial and juxtamedullary glomeruli in the rat kidney. Pflüger’s Archiv Für Die Gesamte Physiologie Des Menschen Und Der Tiere 1968;301:162–181 doi: 10.1007/bf00362733.
2. Vallon V. Micropuncturing the nephron. Pflügers Archiv - European J Physiology 2008;458:189 doi: 10.1007/s00424-008-0581-7.
3. Peti-Peterdi J, Kidokoro K, Riquier-Brison A. Novel in vivo techniques to visualize kidney anatomy and function. Kidney International 2015;88:44–51 doi: https://doi.org/10.1038/ki.2015.65.
4. Regner KR, Nilakantan V, Ryan RP, et al. Protective Effect of Lifor Solution in Experimental Renal Ischemia-Reperfusion Injury. J Surg Res 2010;164:e291–e297 doi: 10.1016/j.jss.2010.08.033.
5. Brezis M, Rosen S, Silva P, Epstein FH. Selective vulnerability of the medullary thick ascending limb to anoxia in the isolated perfused rat kidney. J Clin Invest 1984;73:182 190 doi: 10.1172/jci111189.
6. Kaths JM, Paul A, Robinson LA, Selzner M. Ex vivo machine perfusion for renal graft preservation. Transplant Rev 2017;32 doi: 10.1016/j.trre.2017.04.002.
7. Ross BD. The Isolated Perfused Rat Kidney. Clinical Science and Molecular Medicine 1978;55:513 521.
8. Rosenberger C, Rosen S, Shina A, et al. Hypoxia-inducible factors and tubular cell survival in isolated perfused kidneys. Kidney Int 2006;70:60–70 doi: 10.1038/sj.ki.5000395.
9. Charlton JR, Xu Y, Wu T, et al. Magnetic resonance imaging accurately tracks kidney pathology and heterogeneity in the transition from acute kidney injury to chronic kidney disease. Kidney International 2020 doi: https://doi.org/10.1016/j.kint.2020.08.021.
10. Baldelomar EJ, Charlton JR, Beeman SC, Bennett KM. Measuring rat kidney glomerular number and size in vivo with MRI. Am J Physiol-renal 2018;314:ajprenal.00399. doi: 10.1152/ajprenal.00399.2017.
11. Baldelomar EJ, Charlton JR, Beeman SC, et al. Phenotyping by magnetic resonance imaging nondestructively measures glomerular number and volume distribution in mice with and without nephron reduction. Kidney Int 2016;89:498–505 doi: 10.1038/ki.2015.316.
12. Bennett KM, Zhou H, Sumner JP, et al. MRI of the basement membrane using charged nanoparticles as contrast agents. Magnet Reson Med 2008;60:564–574 doi: 10.1002/mrm.21684.
13. Beeman SC, Cullen-McEwen LA, Puelles VG, et al. MRI-based glomerular morphology and pathology in whole human kidneys. Am J Physiol-renal 2014;306:F1381 F1390 doi: 10.1152/ajprenal.00092.2014.
14. Grenier N, Mendichovszky I, Senneville BD de, et al. Measurement of Glomerular Filtration Rate With Magnetic Resonance Imaging: Principles, Limitations, and Expectations. Semin Nucl Med 2008;38:47–55 doi: 10.1053/j.semnuclmed.2007.09.004.
15. Tucker RHAJDKARCBABJ. Effects of recombinant human insulin-like growth factor I on glomerular dynamics in the rat. J Clin Invest 1991;87:1200–1206 doi: 10.1172/jci115119.
16. Yu W, Sandoval RM, Molitoris BA. Quantitative intravital microscopy using a Generalized Polarity concept for kidney studies. Am J Physiol-cell Ph 2005;289:C1197–C1208 doi: 10.1152/ajpcell.00197.2005.
Figures