2483
Renal T2-mapping with a T2-preparation sequence: comparison of signal models1The University of Sheffield, Sheffield, United Kingdom, 2University of Leeds, Leeds, United Kingdom
Synopsis
A recent consensus paper recommends a mono-exponential signal model to determine T2-values from a T2-preparation sequence. However, this assumes complete signal recovery after each readout, and therefore necessitates long acquisition times. In this study, we compare the mono-exponential model against a forward modelling approach which is also accurate with incomplete recovery. Simulations, phantom data and repeatability data in healthy volunteers show the forward model is significantly more accurate and allows for a 7-fold reduction in acquisition time with a negligible cost in T2 precision.
Introduction
The most common method to measure T2 relaxation time is multi-echo spin-echo (MESE) sequence. However, MESE sequences are sensitive to imperfect slice selection pulses, diffusion, flow and field-inhomogeneities1,2. As a result, a recent consensus effort1 was inconclusive on the optimal sequence for renal T2-mapping and also considered T2-prepared sequences as a possible approach for T2-mapping. The consensus paper recommends modelling the data using a mono-exponential model3. However, this requires complete recovery after each readout, leading to very long acquisition times or a significant bias in sequences with incomplete recovery 4.A possible solution is to shorten the acquisition by allowing for incomplete recovery, and analyze the data with a forward model that correctly accounts for incomplete recovery in the propagation of magnetization through the pulses. In a multiparametric setting where T1 is measured as well, a further improvement may be possible by fitting the T2-data with a measured T1. The aim of this study is to compare the forward modelling approach against the recommended mono-exponential approach using numerical simulations, phantom and repeated healthy volunteer MR data.
Methods
T2-preparation sequence & modelling: A T2-preparation ([0 30:10:120]ms) was immediately followed by a 2D-FLASH readout (TE=2.36ms, TR=4.6ms, GRAPPA=2, phase partial Fourier=6/8), the T2-preparation sequence was acquired without complete longitudinal recovery. A forward model was created which explicity describes the propagation of magnetization through each pulse and free recovery in the sequence (Figure 1).Numerical simulations: Numerical simulations with a T2=134ms and T1=1340ms were performed to compare the relative error (RE) of the forward model and mono-exponential in data with complete and incomplete recovery at different noise levels SNR=[0.1-100]. The forward model was used into two variations a joint T1&T2 fit and a T2 alone (fixed T1). Numerical simulations were repeated 1000 times, RE was calculated and displayed in a boxplot for the different SNR, the bias (median RE) and random-error (interquartile-range) were assessed.
Phantom experiments: the NIST/ISMRM phantom5 was scanned using a MAGNETOM-Prisma 3.0T MRI (Siemens Healthcare GmbH, Erlangen, Germany). T2 mapping data was acquired using the described T2-preparation sequence. Using MATLAB, three ROI’s were placed over three T2 reference spheres: T2-5:(T2=134ms;T1=1340ms), T2-6:(T2=94ms;T1=1017ms) and T2-7:(T2=62ms;T1=782ms) and fitted using a mono-exponential and the forward model.
Volunteer data: the same protocol was used to scan five healthy volunteers (breathold) over four distinct time points, using a coronal-oblique orientation. Renal cortex and medulla ROIs were created on the middle slice using MATLAB. T2-signal decay from cortex and medulla ROI masks were fitted using mono-exponential fit and the forward model (fixed T1).
Results
Numerical simulations: Figure 2 shows the bias of the forward and the mono-exponential model goes towards 0% as SNR increases, when the pulse sequence allows a complete recovery. The mono-exponential model produces large systematic errors in case of incomplete recovery (73.9% at SNR 20, the lowest SNR found in our MRI dataset) while the forward model (joint T1&T2) has 2.0% bias and a random error of 2.8%. By fixing T1 the bias decreases further to 1.4% and random error to 1.3% at SNR 20. The forward model permits a 7-fold reduction in scan time, with a negligible penalty in the bias (0.5–1.4% at SNR 20) and random error (0.63-1.3% at SNR 20). For a complete recovery, a scan time of 109.6 seconds/slice would be needed to achieved 0% bias, compared to only 16s for a sequence with incomplete recovery.Phantom experiments: Figure 3 shows mono-exponential fit fails to accurately quantify the T2 showing a bias of -66.4%, -50.0%, -30.6% in the spheres T2-5, T2-6, T2-7. The forward model with a joint T1&T2 reduces these biases to -30.6%, -28.7% and -4.8%. By fixing T1 the forward model was able to correctly determine the T2 of all the reference spheres (bias of 3.0%, 5.3% and 3.2%).
Volunteer Experiments: Figure 4 shows the calculated T2 values using the forward model (fixed T1) are in the range reported in the literature6 while T2-values calculated from mono-exponential are far outside and show limited sensitivity to differences between volunteers and scan time points.
Discussion
This work shows that a forward model correctly account for incomplete recovery to accurately quantify renal T2, allowing 7-fold reduction in scan time by removing the need to wait for the complete longitudinal recovery. The accuracy of the T2-mapping using this sequence was also proven in cardiac MRI to characterize myocardial edema7. This strategy should be considered in the next iteration of the renal consensus formation1 not only to offer a faster approach to T2-mapping but also to avoid possible misuse of the mono-exponential model. There is a lack of renal T2-mapping studies to compare, some studies report a larger T2 in medulla when compared to cortex6. In our case that was not verified for most of the subjects regardless of the perfect cortical/medullar T2 fit (figure 5). In the future, we plan to investigate this in a larger number of subjects.Conclusion
A forward model for T2-preparation sequences allows significant reduction in scan times with negligible loss in accuracy and precision compared to complete recovery sequence analyzed with a mono-exponential model. The consensus recommendations on renal T2 mapping should be updated to discourage the use of mono-exponential model fitting in T2-preparation sequences.Acknowledgements
iBEAt study is part of the BEAt-DKD project. The BEAt-DKD project has received funding from the Innovative Medicines Initiative 2 Joint Undertaking under grant agreement No 115974. This Joint Undertaking receives support from the European Union’s Horizon 2020 research and innovation programme and EFPIA with JDRF. For a full list of BEAt-DKD partners, seewww.beat-dkd.eu.
References
[1] - Dekkers, Ilona A., et al. "Consensus-based technical recommendations for clinical translation of renal T1 and T2 mapping MRI." Magnetic Resonance Materials in Physics, Biology and Medicine 33.1 (2020): 163-176.
[2] - Wolf, Marcos, et al. "Magnetic resonance imaging T1-and T2-mapping to assess renal structure and function: a systematic review and statement paper." Nephrology Dialysis Transplantation 33.suppl_2 (2018): ii41-ii50.
[3] - Williams, Catherine FM, and Thomas W. Redpath. "Sources of artifact and systematic error in quantitative snapshot FLASH imaging and methods for their elimination." Magnetic Resonance in Medicine: An Official Journal of the International Society for Magnetic Resonance in Medicine 41.1 (1999): 63-71.
[4] - Deichmann, Ralf, et al. "Fast T2-mapping with snapshot flash imaging." Magnetic resonance imaging 13.4 (1995): 633-639.
[5] - Russek, S. E., et al. "Characterization of NIST/ISMRM MRI system phantom." Proceedings of the 20th Annual Meeting of ISMRM, Melbourne, Australia. 2012.
[6] - De Bazelaire, Cedric MJ, et al. "MR imaging relaxation times of abdominal and pelvic tissues measured in vivo at 3.0 T: preliminary results." Radiology 230.3 (2004): 652-659.
[7] - Wassmuth, Ralf, et al. "Variability and homogeneity of cardiovascular magnetic resonance myocardial T2-mapping in volunteers compared to patients with edema." Journal of Cardiovascular Magnetic Resonance 15.1 (2013): 1-10.
Figures

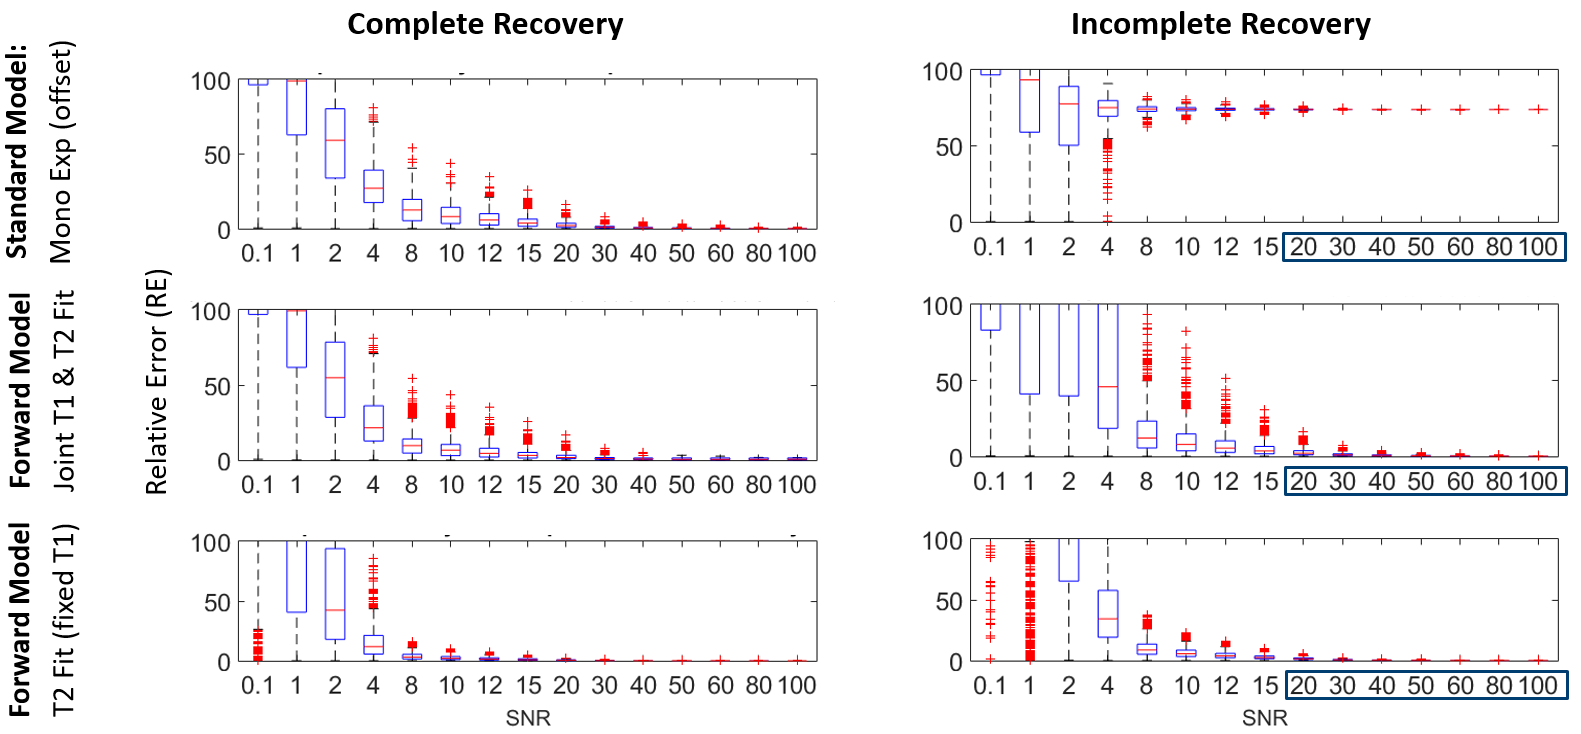
Figure 2: Box plot of the numerical simulations. The box plots compare the relative error (RE) between the standard model: mono-exponential (first row) and the forward model without T1 fixation (middle row) and with T1 fixation (bottom row) for a pulse sequence that allows a complete T1 recovery (left column) and for a pulse sequence that does not allow complete recovery (right column) under different noise levels from 0.1 to 100 SNR. The highlighted SNR values [20 100] correspond to the SNR of our volunteer MR dataset.
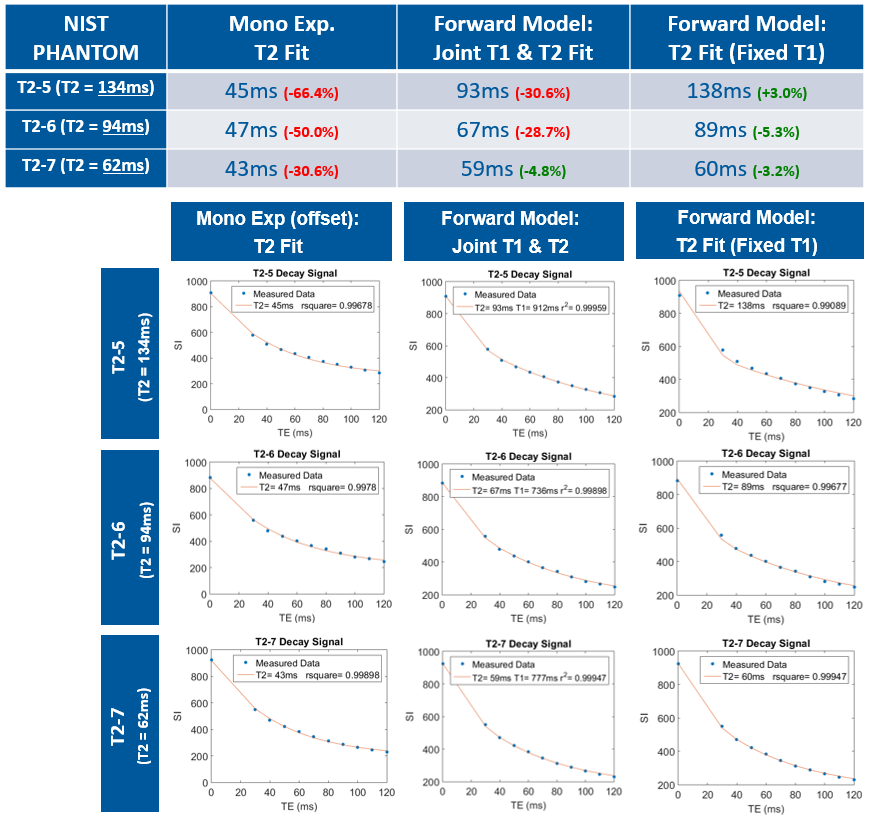
Figure 3: Summary of the NIST/ISMRM phantom MR experiments. Mono-exponential fit fails to accurately output the T2 from the three different NIST/ISMRM T2 reference spheres: T2-5, T2-6, T2-7 by having an error of 66.4%, 50.0% and 30.6% respectively, where the forward model with fixed T1 was able to achieve an error of 3.0%, 5.3%, 3.2% respectively (top table). Below, the T2 fits are displayed for each NIST/ISMRM T2 reference spheres using mono-exponential fit (left column), forward model without T1 as input (middle column) and forward model with T1 as input (right column).
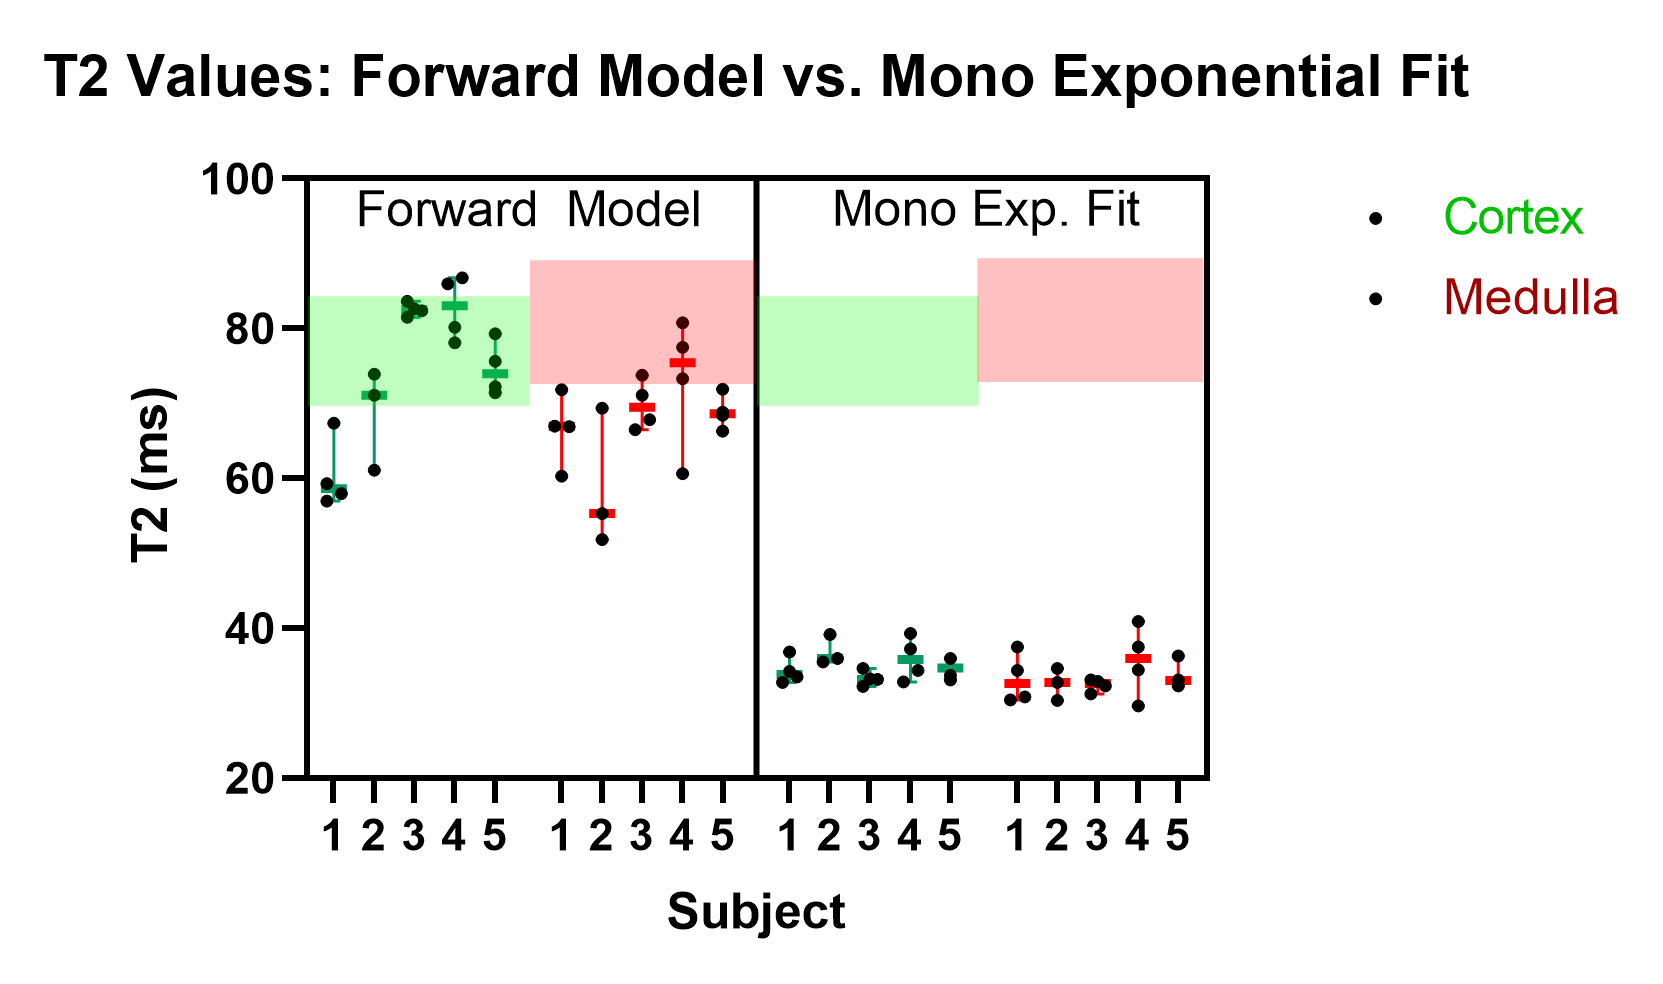
Figure 4: Summary of volunteer MR experiments. On the left, the plot shows the median of the calculated T2 values using the forward model (with fixed T1) and on the right the median of the calculated T2 using a mono-exponential fit for each of the five subjects. The area delimited in green and red represents the range of renal cortical T2 values and renal medullar values reported in literature6. Renal T2 values calculated from mono-exponential fit fail in entering in that range.

Figure 5: Cortex vs Medulla (an example where medullar T2 is lower than cortical T2). On the left the T1 (top) and T2 (bottom) pixelwise analysis using the forward model) together with the respective Rsquare maps (goodness of the fit). In the T1 is possible to clearly distinguish cortex (≈1400ms) and medulla (≈1600ms). On the right, the ROI analysis is displayed, T1 map was used as a reference to place cortical and medullar ROI’s. The same ROI’s where placed into T2 mapping data. Both T2 fits look excellent showing an rsquare > 0.995.