2482
Performance of small field of view rotated 2D selective RF excitation Diffusion Tensor (DTI) Imaging of kidneys with automatic motion correction1Department of Radiology, Austin Health, Heidelberg, Australia, 2Melbourne Medical School, University of Melbourne, Melbourne, Australia, 3MR Research Collaborations, Siemens Healthcare Pty Ltd, Melbourne, Australia, 4MR Application Predevelopment, Siemens Healthcare GmbH, Erlangen, Germany, 5Department of Endocrinology, Austin Health, Heidelberg, Australia, 6Department of Medicine, University of Melbourne, Melbourne, Australia, 7Departments of Radiology and Surgery, University of Melbourne, Melbourne, Australia
Synopsis
Renal diffusion tensor imaging (DTI) is a promising, non-invasive biomarker for kidney function. Cortical and medullary fractional anisotropy (FA) and mean diffusivity (MD) correlates with early microstructural and functional changes in kidney diseases. However, reliability of DTI metrics is affected by artifacts. The ideal renal DTI sequence for robust and reproducible measurements remains under investigation. We report on a prototype for small field-of-view (FOV) DTI incorporating 2D selective and rotated RF excitation and automatic motion correction to minimize artifacts in 9 diabetic patients and 9 controls, demonstrating high inter-reader agreement for measured FA and MD and high image quality.
Purpose
Traditional single shot echo planar imaging is affected by susceptibility artifact and B1 heterogeneity which can impact reliability of DTI metrics 1-3. Small field of view (FOV) DTI employing 2D spatially selective RF excitation can reduce these artifacts 3, 4. However, aliasing and respiratory motion may still be encountered with this technique, with recent consensus guidelines recommending unilateral kidney motion registration 1. This study aims to evaluate the performance, specifically inter-reader agreement for DTI metrics and image quality, of a prototype small FOV DTI sequence (pDTI) with rotated RF excitation 5 and automated motion correction, as well as a commercially available small FOV-DTI (cDTI).Methods
Nine type 2 diabetic patients (6M, 3F, range 41 – 75 years, mean HbA1c 7.9 %, mean eGFR 82 ml/min/1.73m2) and 9 healthy controls (3M, 6F, range 24 – 67 years) were prospectively recruited and imaged on a 3T scanner (MAGNETOM Skyra, Siemens Healthcare, Erlangen, Germany). All subjects were imaged with cDTI and pDTI performed in random order. Parameters were matched for both sequences: 2D spatially selective RF excitation EPI (ZOOMit, Siemens Healthcare, Erlangen, Germany), respiratory-triggering, TR/TE/ES = 3000/74 /0.75 ms, FA = 90°, FOV 240 x 192 mm2, matrix 90 x 72, slice thickness 5 mm, 5 slices, b 0, 150 and 500 s/mm2 (1/1/3 averages), 12 directions, parallel imaging (GRAPPA, R = 2, separate calibration scan), SPAIR fat suppression, typical TA 4 min. pDTI differed by: a) a 10 deg rotation of the field of excitation to minimize aliasing artefacts from outside the excitation FOV, b) in-line complex averaging of the three b500 images and c) in-line 2D non-rigid image registration. A radiologist reviewed all images, removing images with poor signal to noise 1, and performed manual motion correction (MC) on unilateral kidneys from each sequence using open-source software (FireVoxel, NYUMC, NY, USA). 5 sets of fractional anisotropy (FA) and mean diffusivity (MD) maps were then generated for each subject from the following source images: 1. Non-MC cDTI; 2. Manual-MC cDTI; 3. Non-MC pDTI; 4. Automatic-MC pDTI (performed inline); and 5. Manual-MC pDTI. Three readers (2 radiologists and 1 resident), blinded to subject and technique, scored image quality (IQ) and artifact severity on a Likert scale (1=best, 5=non-diagnostic), and measured cortical and medullary FA and MD with manual ROIs in open-source software (3D Slicer, BWH, USA) 6.Inter-reader reliability (poor 0 – 0.5, moderate 0.5 – 0.75, good ICC 0.75 – 0.90 or excellent > 0.90) of derived DTI metrics comparing results across the 5 sets of FA/MD maps was assessed with a two-way mixed effect model intra-class correlation coefficient (ICC). 7 Inter-reader reliability of DTI metrics within each set was then assessed, including reliability in patients only. Pair-wise comparison of sequences were used to calculate mean absolute difference in derived DTI metrics for MC-corrected maps. Lastly, odds of significant image degradation and artifact (IQ/artifact score ≥4) compared to manual-MC cDTI as the reference standard were calculated with mixed effects logistic regression analysis.
Results
All subjects completed DTI imaging with representative images shown in Figure 1 and descriptive statistics in Table 1.There was poor agreement for cFA and mFA between the 5 different source DTI images (ICC 0.54 and 0.28 respectively) while good agreement was observed for cMD and mMD (ICC 0.83 and 0.80 respectively).
Poor inter-reader agreement was observed for cFA for Non-MC cDTI (ICC 0.40) and Manual-MC cDTI (ICC 0.48). mFA agreement was poor for Non-MC cDTI (ICC 0.15) and moderate for Manual-MC cDTI (ICC 0.51). In comparison, inter-reader agreement for cFA and mFA were good and poor for Non-MC pDTI (ICC 0.76 and 0.49 respectively) and moderate to good for both Automatic-MC pDTI and Manual-MC pDTI (Table 2). cMD and mMD inter-reader agreement was good to excellent for all sequence reconstructions. pDTI inter-reader measurements remained reliable in sub-analysis of patient images, with ICCs of cFA 0.89, mFA 0.59, cMD 0.95 and mMD 0.97 recorded for Automatic-MC pDTI.
Pair-wise comparison of mean absolute difference between Manual- MC cDTI and Manual-MC and Automatic-MC pDTI are shown in Table 3.
The reported objective ICC findings are supported by subjective IQ/artifact scores. When compared against Manual-MC cDTI, Manual-MC pDTI and Automatic-MC pDTI odds ratios for image degradation were OR 0.75 (95% CI 0.27 – 2.14) and OR 0.75 (95% CI 0.27 – 2.14) respectively. Similar trends were seen for artifact severity scores; OR 0.65 (95% CI 0.23 – 1.86) and OR 0.76 (95% CI 0.27 – 2.14) respectively.
Discussion / Conclusion
High inter-reader agreement for derived DTI metrics was observed for pDTI. The high observed reliability is perhaps only partly explained by MC. Note is made that only poor to modest inter-reader agreement was observed for Manual-MC cDTI. The addition of rotated RF excitation and complex b500 averaging likely contributed to high inter-reader agreement through reduction in aliasing and minimization of motion artifacts. This is supported by qualitative IQ scores of pDTI, although better scores did not achieve statistical significance compared to Manual-MC cDTI, limited by small sample size. High inter-reader reliability was preserved in the patient group alone, providing promise of the prototype DTI sequence for monitoring impact of patient therapy on the kidneys. Further validation of these findings in a larger population is underway.Acknowledgements
This work was supported by funding from the Royal Australian and New Zealand College of Radiologists and Boehringer Ingelheim.
References
1. Ljimani A, Caroli A, Laustsen C, Francis S, Mendichovszky IA, Bane O, et al. Consensus-based technical recommendations for clinical translation of renal diffusion-weighted MRI. Magma. 2020;33(1):177-95.
2. Caroli A, Schneider M, Friedli I, Ljimani A, De Seigneux S, Boor P, et al. Diffusion-weighted magnetic resonance imaging to assess diffuse renal pathology: a systematic review and statement paper. Nephrol Dial Transplant. 2018;33(suppl_2):ii29-ii40.
3. He YL, Hausmann D, Morelli JN, Attenberger UI, Schoenberg SO, Riffel P. Renal zoomed EPI-DWI with spatially-selective radiofrequency excitation pulses in two dimensions. Eur J Radiol. 2016;85(10):1773-7.
4. Williams J, Perchyonok Y, Churilov L, Hornsey E, Mikheev A, Rusinek H, et al., editors. Small field of view 2D spatially selective RF excitation diffusion tensor (DTI) imaging of the kidneys: initial experience in healthy controls and patients with Type 2 diabetes [Abstract]. International Society for Magnetic Resonance in Medicine (ISMRM) 27th Annual Meeting and Exhibition; 2019.
5. Finsterbusch J. Improving the performance of diffusion-weighted inner field-of-view echo-planar imaging based on 2D-selective radiofrequency excitations by tilting the excitation plane. J Magn Reson Imaging. 2012;35(4):984-92.
6. Fedorov A, Beichel R, Kalpathy-Cramer J, Finet J, Fillion-Robin JC, Pujol S, et al. 3D Slicer as an image computing platform for the Quantitative Imaging Network. Magn Reson Imaging. 2012;30(9):1323-41.
7. Benchoufi M, Matzner-Lober E, Molinari N, Jannot AS, Soyer P. Interobserver agreement issues in radiology. Diagnostic and Interventional Imaging. 2020;101(10):639-41.
Figures

Table 1: Descriptive summary statistics of commercial and prototype DTI sequences with and without motion correction. IQR = interquartile range, MC = motion correction, cDTI = commercial DTI, pDTI = prototype DTI, cFA = cortical FA, mFA = medullary FA, cMD = cortical MD, mMD = medullary MD, IQ = image quality
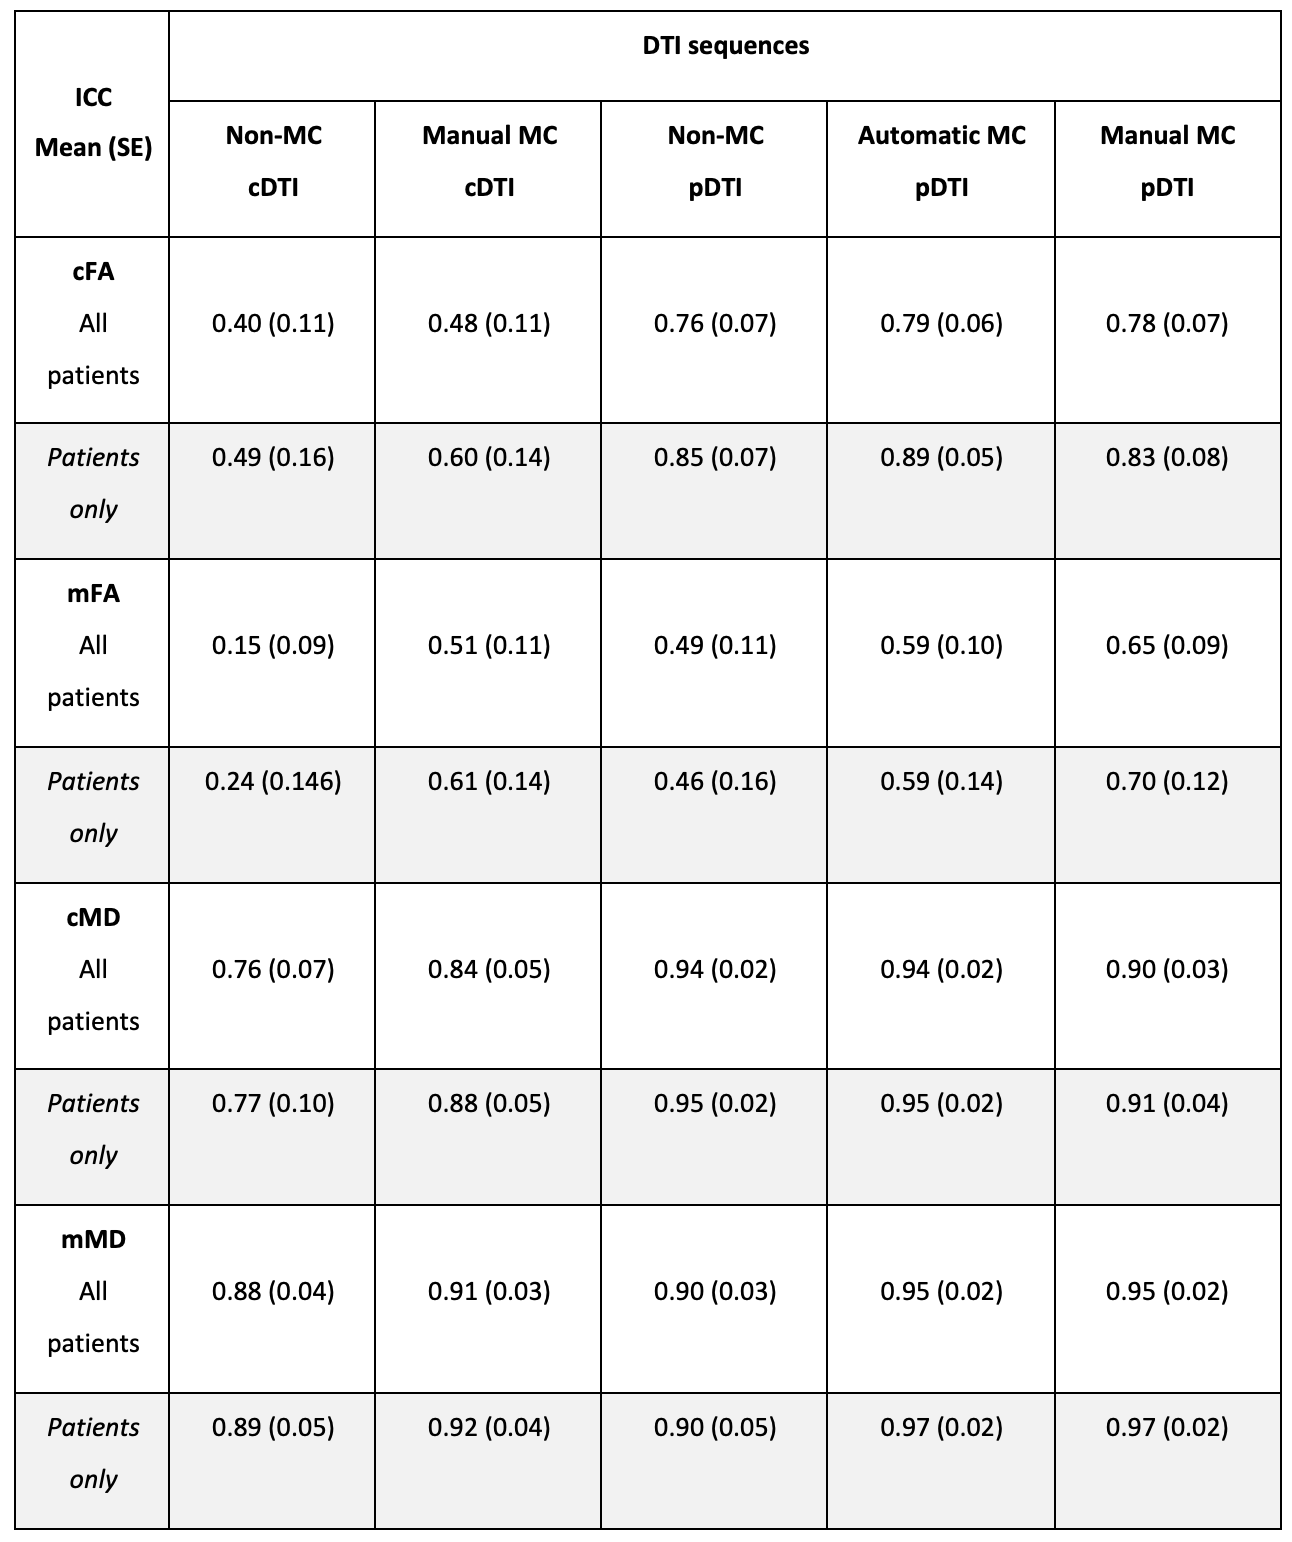
Table 2: Intraclass correlation coefficient of commercial and prototype DTI sequences with and without motion correction. ICC = intraclass correlation coefficient, SE = standard error, MC = motion correction, cDTI = commercial DTI, pDTI = prototype DTI, cFA = cortical FA, mFA = medullary FA, cMD = cortical MD, mMD = medullary MD, IQ = image quality
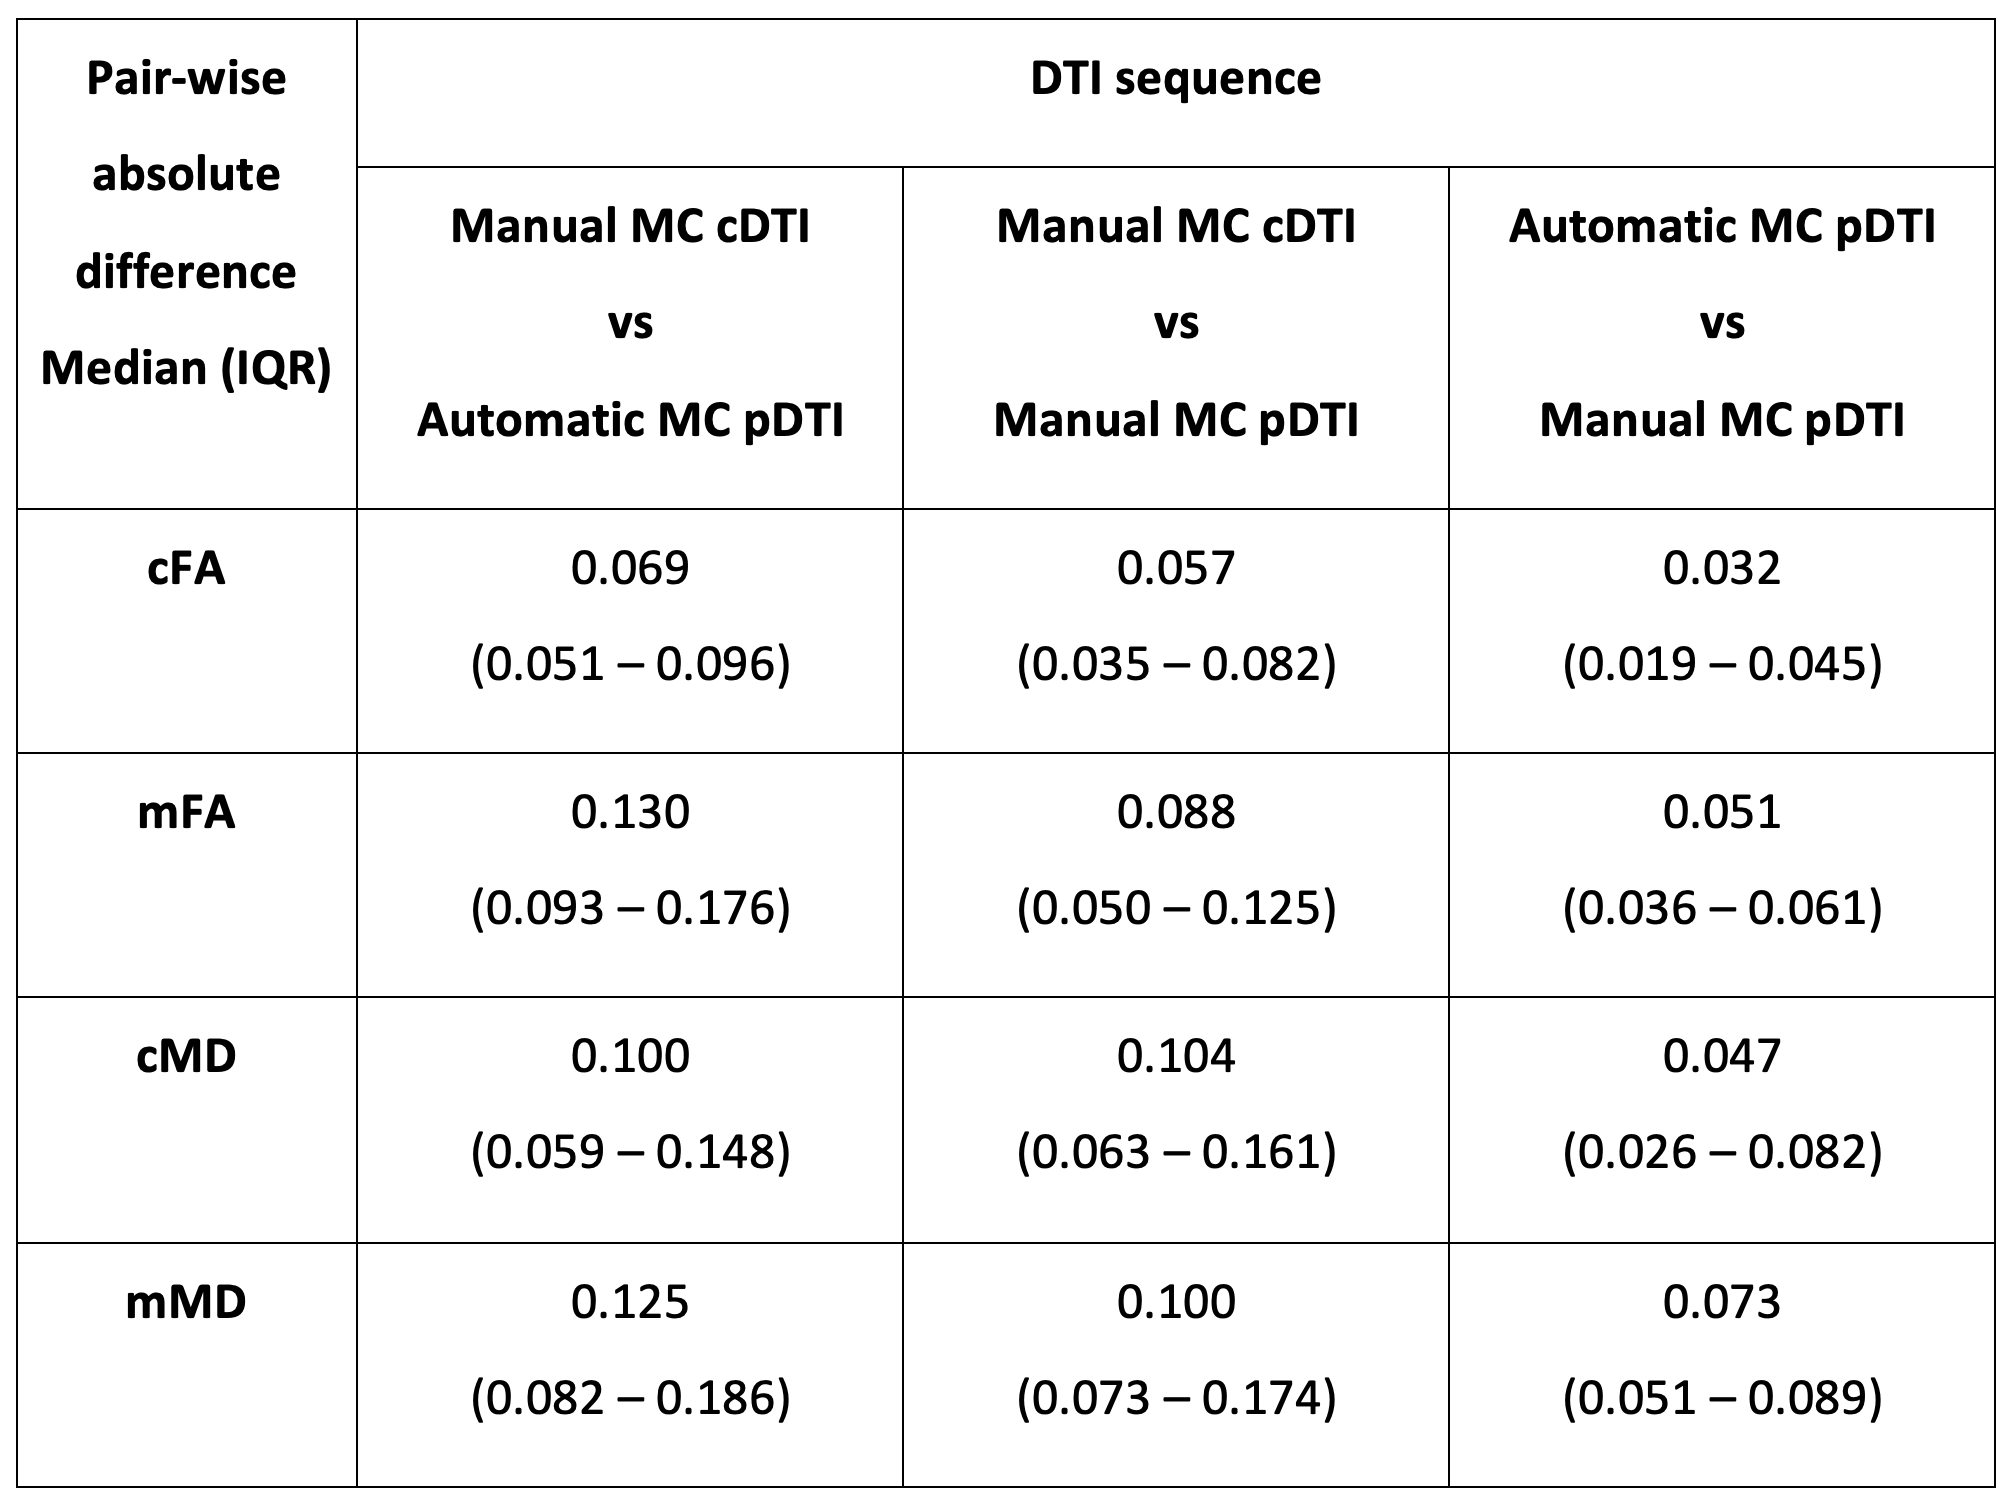
Table 3: Pairwise absolute differences in DTI metrics between commercial DTI with manual correction and product DTI with manual and automatic motion correction. IQR = inter-quartile range, MC = motion correction, cDTI = commercial DTI, pDTI = prototype DTI, cFA = cortical FA, mFA = medullary FA, cMD = cortical MD, mMD = medullary MD
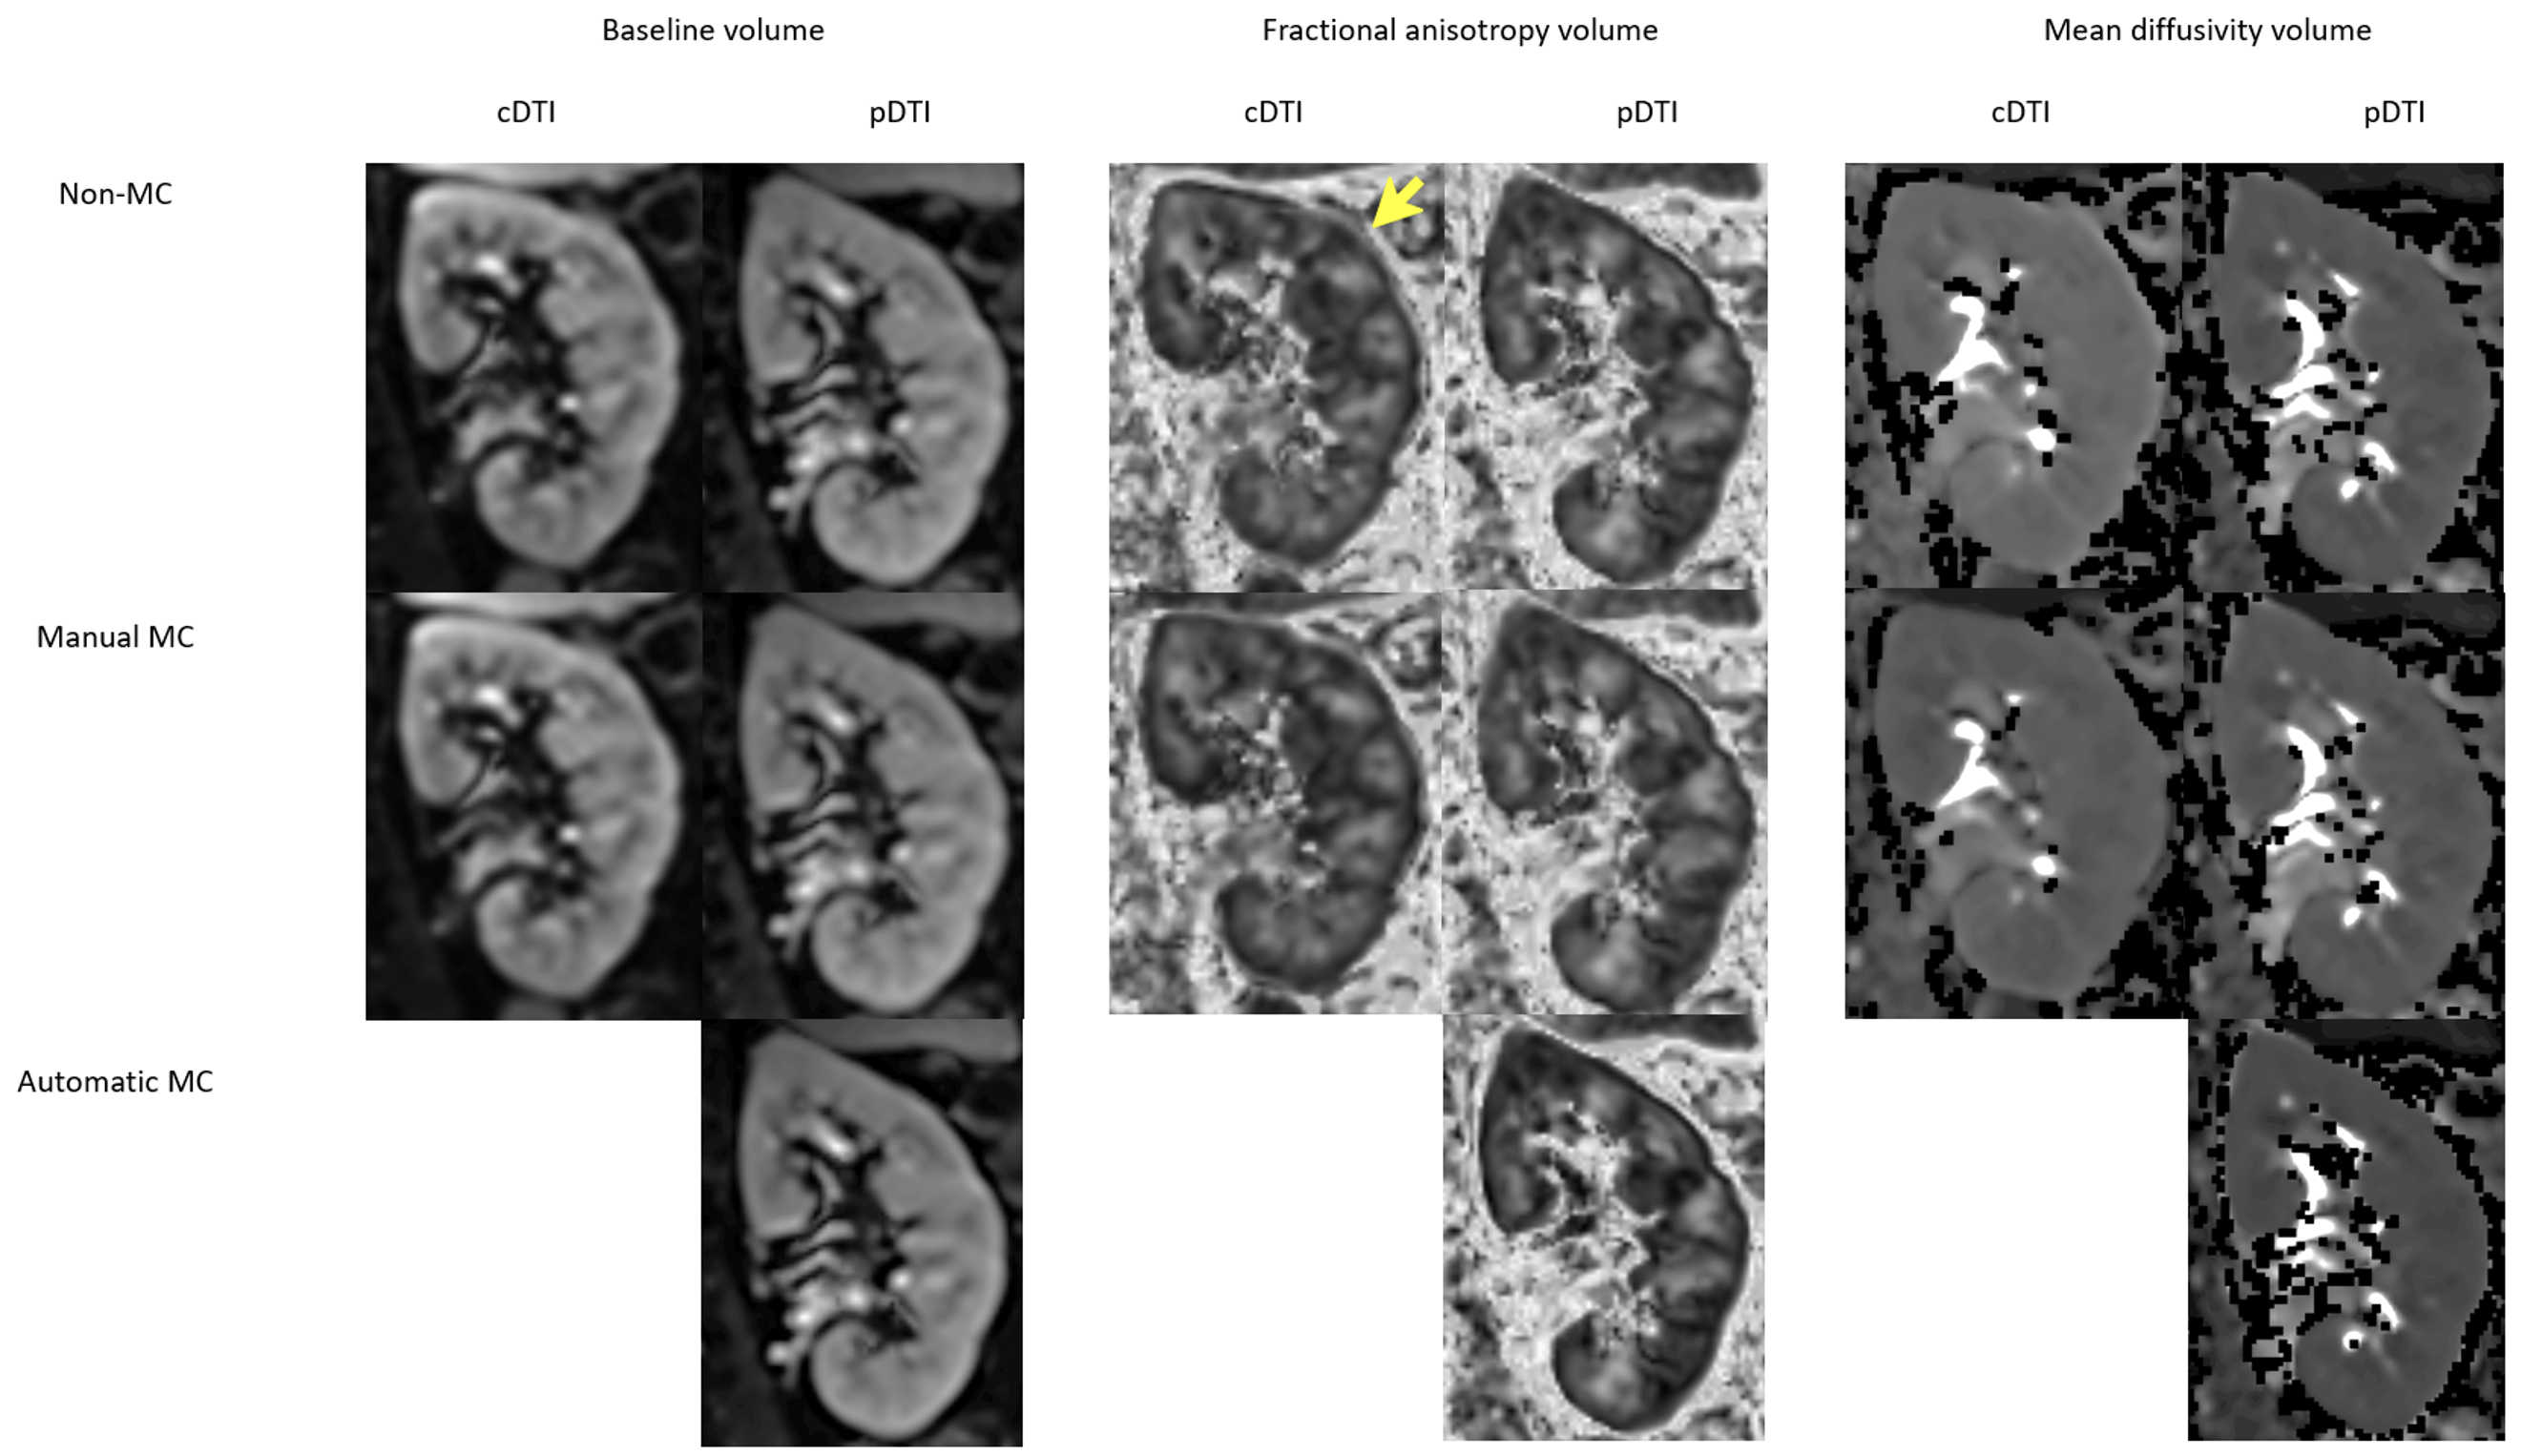
Figure 1. Representative images from the left kidney of a 57-year-old male diabetic patient (eGFR > 90 ml/min/1.73m2, HbA1c 7.3%) imaged using commercial DTI (cDTI) versus prototype DTI (pDTI) with and without motion correction (MC). The margin of the kidney is less well defined for Non-MC cDTI (yellow arrow), which is better defined for Manual-MC cDTI and all pDTI derived FA maps.