2481
Abnormal static and dynamic functional network connectivity in patients with capsular stroke based on the triple-network model.1The First Affiliated Hospital of Zhengzhou University, Zhengzhou, China, 2GE Healthcare MR Research, Beijing, China
Synopsis
To explore the mechanisms of cognitive impairment and reorganization in patients with left- and right-sided capsular stroke (CS_L, CS_R), we collected resting-state fMRI data from 62 CS_L, 56 CS_R patients and 57 normal controls (NC). Based on the triple-network model [involving the default mode, central executive and salience networks], static (SFNC) and dynamic functional network connectivities (DFNC) were performed to calculate inter-network functional connectivities and estimate temporal features in each state among the three groups. We found more significant SFNC and DFNC changes in CS_R group, suggesting more extensive cognitive impairment and reorganization in CS_R patients than those with CS_L.
Introduction
Cognitive impairment is one of the most common symptoms in stroke patients[1]. The triple-network model [including the default mode network (DMN), executive control network (ECN) and salience network (SAN)] can be used to explain the neuropathological processes of cognitive, affective and social dysfunction in neurological and psychiatric disorders[2]. However, it remains unclear that the role of triple-network model in cognitive impairment and recovery of stroke patients. In addition, previous studies assumed that functional connectivities (FC) remained constant over the entire resting-state scanning, but recent studies have indicated the time-varying effects of FC during the acquisition process[3]. This study intends to explore the mechanisms of functional impairment and reorganization in patients with CS_L and CS_R by SFNC and DFNC analysis based on the triple-network model.Materials and Methods
This study recruited 62 patients with CS_L (40 males and 22 females, age: 55.21±8.10 years), 56 patients with CS_R (36 males and 20 females, age: 54.02±9.15 years) and 57 age-, sex-, and education-matched NC (34 males and 21 females, age: 55.81±8.05 years). The images of all subjects were collected on a 3.0 Tesla GE Discovery 750 MR scanner. The resting-state fMRI data were obtained using a single-shot echo planar imaging sequence BOLD (TR/TE = 2000/30 ms, thickness = 3.0 mm, gap=1mm, FOV = 240 × 240 mm2, matrix = 64 × 64, slices = 38, volumes=180). The visual spatial 1-back task was used to assess the cognitive function. Independent component analysis (ICA) was used to extract independent components (ICs) belonging to the three-network model, and Pearson correlation coefficients of the mean time courses were computed between all pairs of ICs for each subject, namely the SFNC. Subsequently, the sliding window (window size=22TRs, step length=1 TR) and k-means clustering analysis were performed to calculate DFNC matrices and estimate distinct dynamic connectivity states. We evaluated differences of SFNC and DFNC parameters (including the reoccurrence fraction and dwell time for each DFNC state, and transition number between states) in a three-level one-way ANOVA (level of significance p<0.05). Post hoc t-tests (NC versus CS_L, NC versus CS_R, CS_L versus CS_R) were performed in case of significant ANOVA results (level of significance p<0.05, FDR corrected). For each of the SFNC and DFNC parameters showing significant group effects, we estimated Pearson’s correlation between the parameters and each of the clinical variables in the CS_L and CS_R groups, separately (p<0.05, FDR corrected).Results
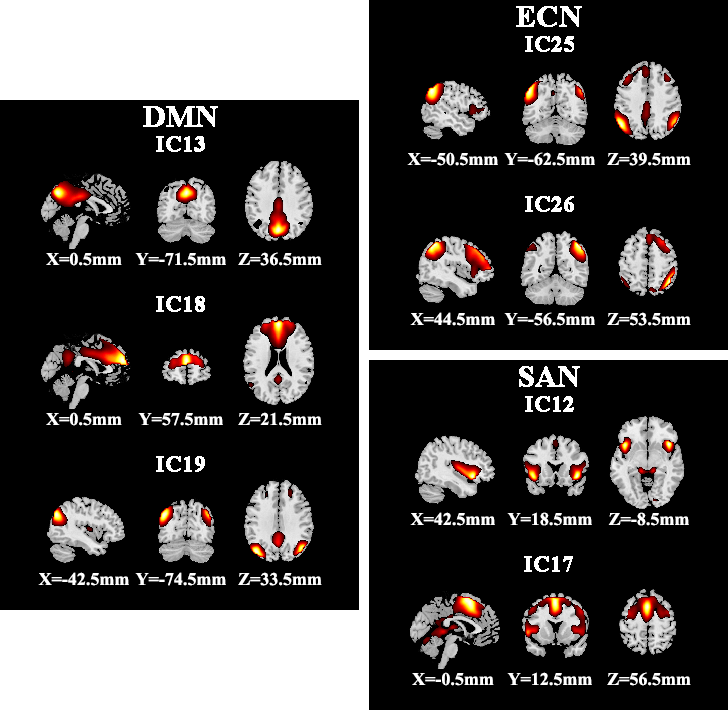
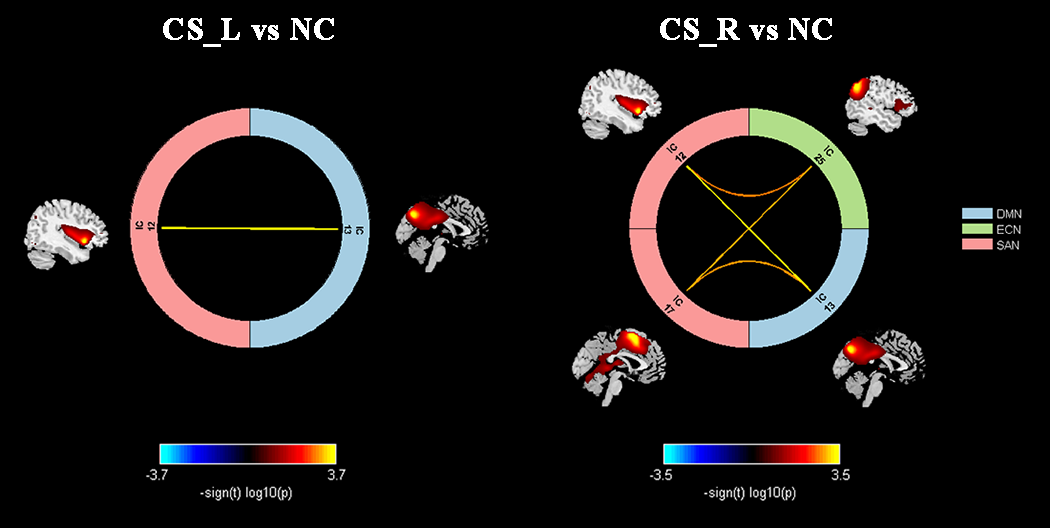
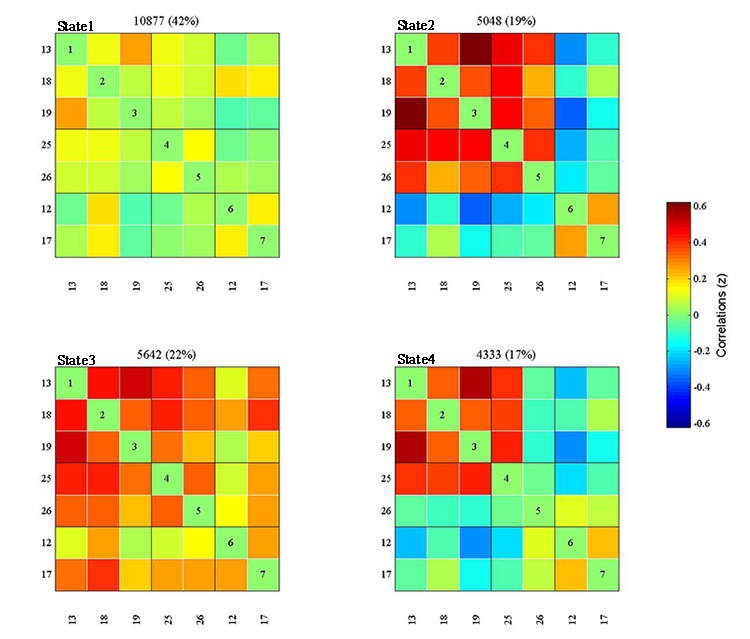
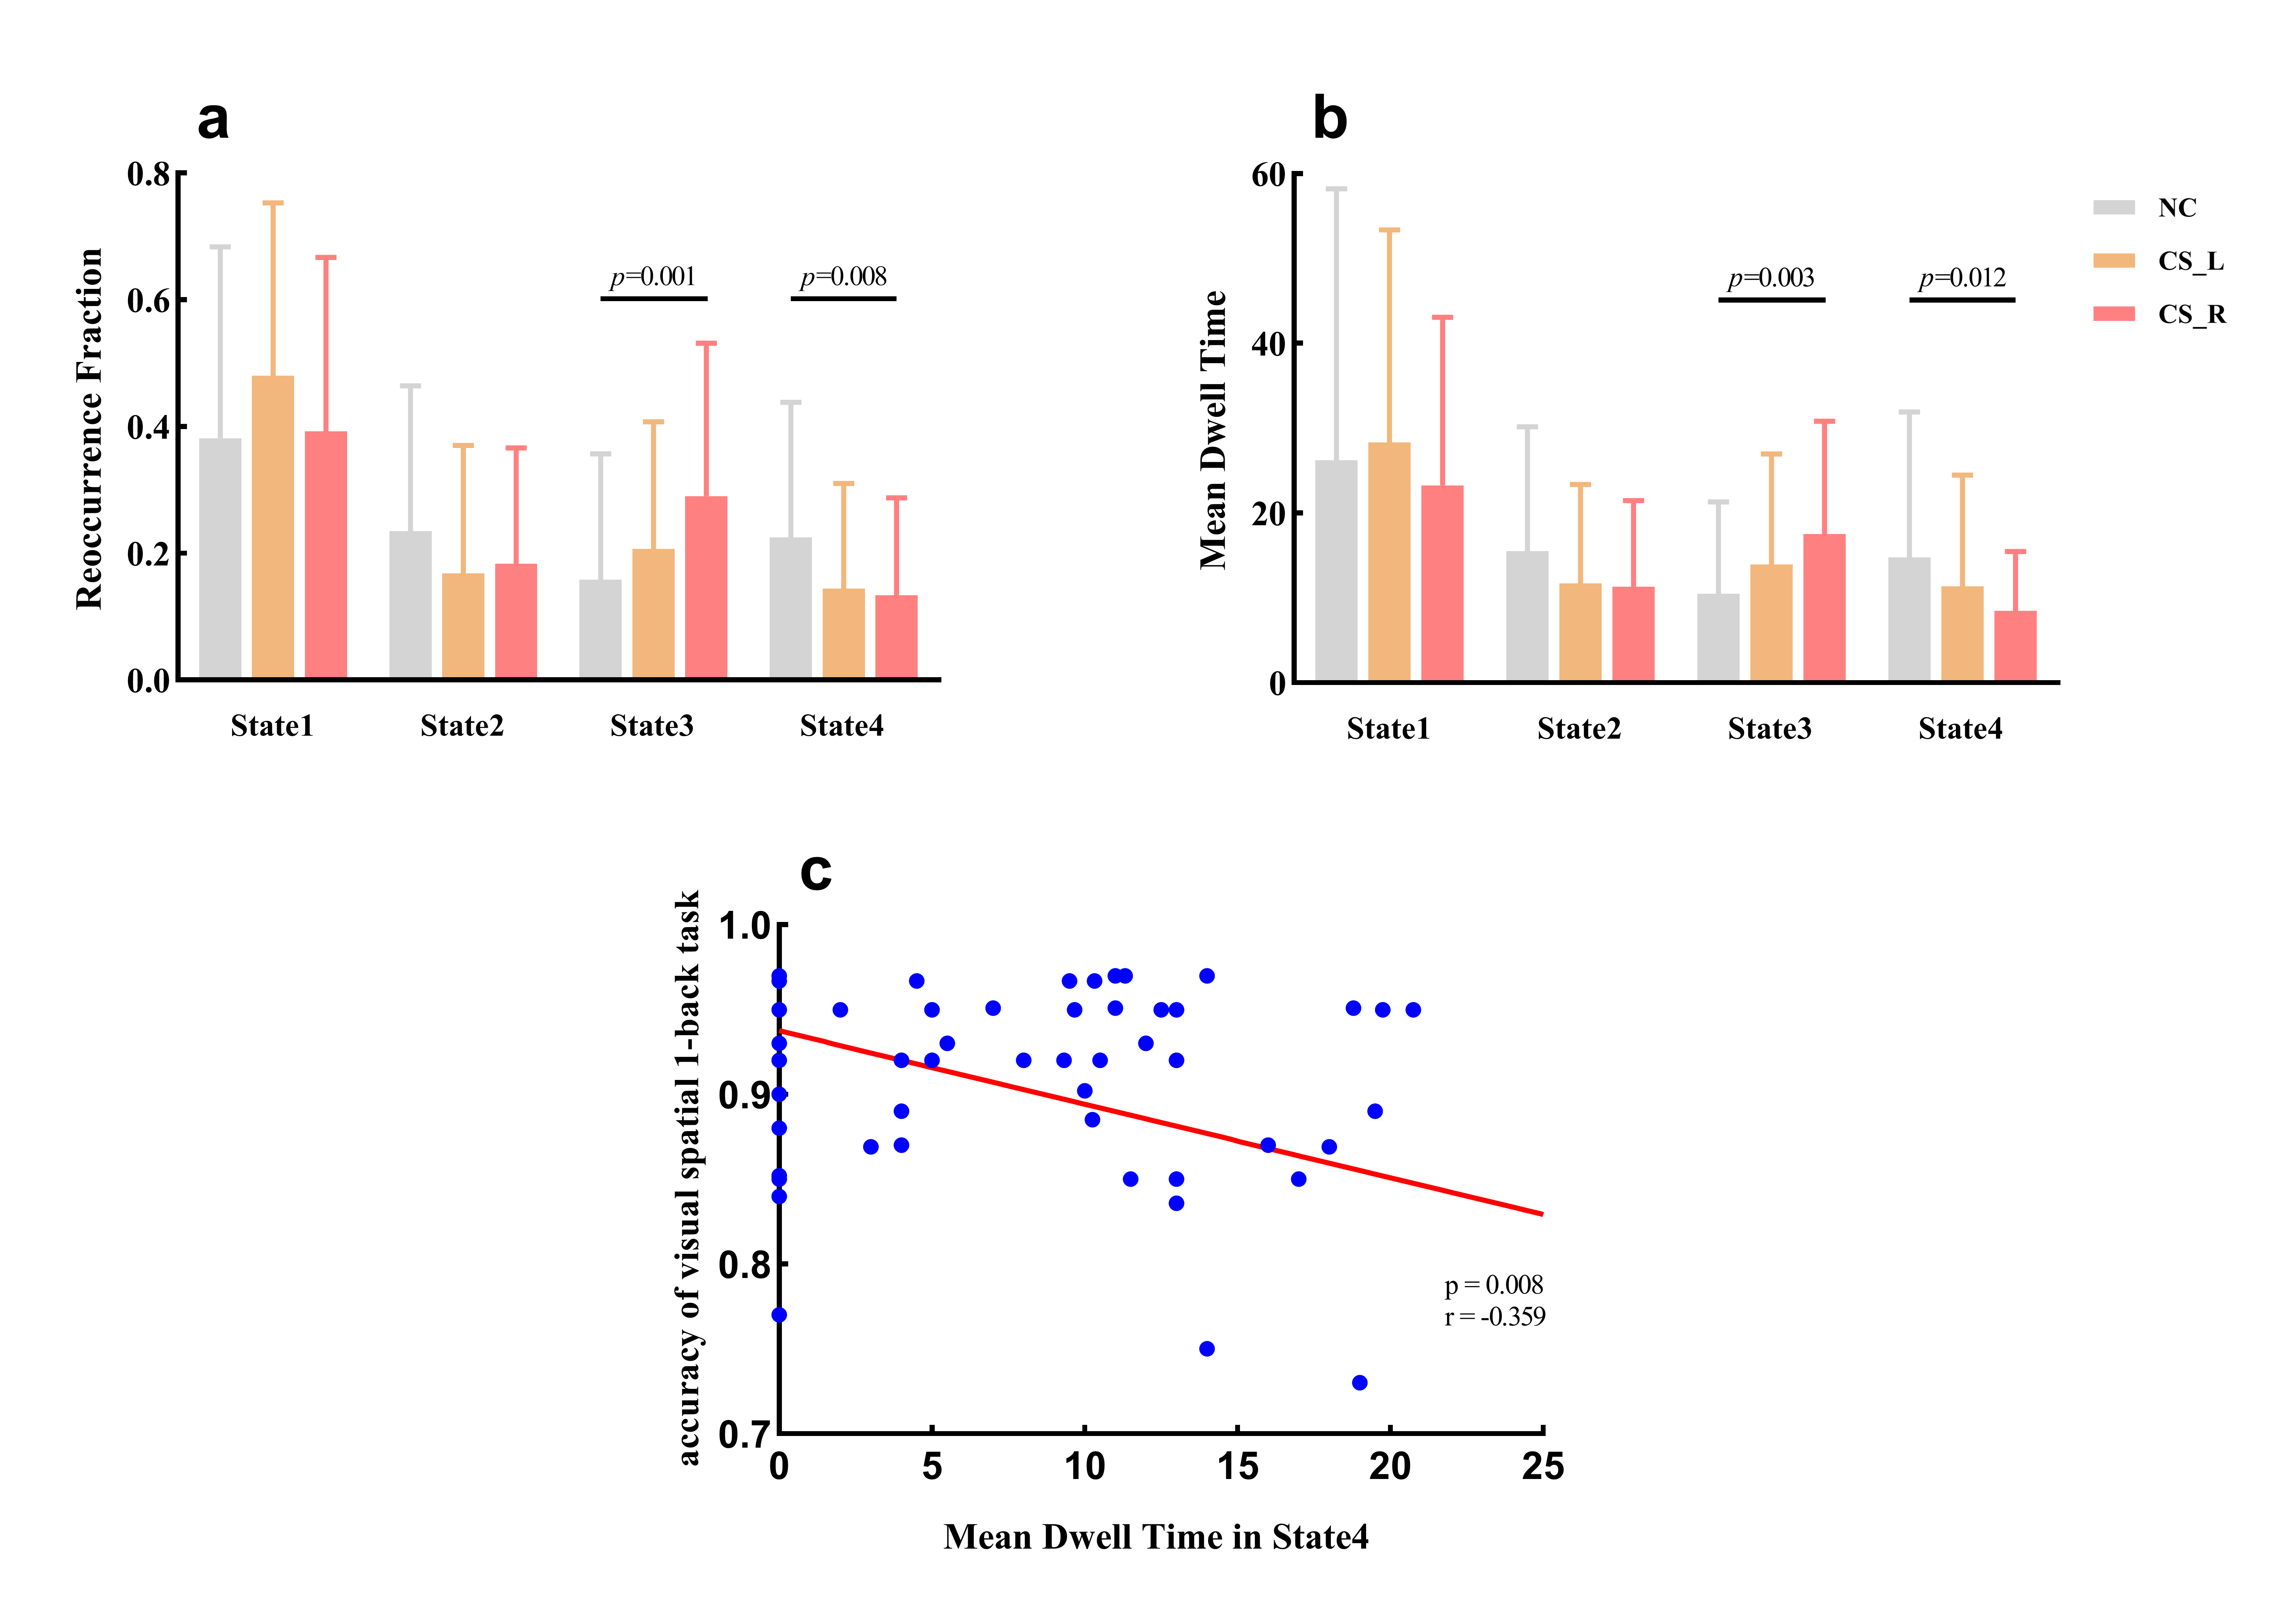
As shown in Figure 1, we identified seven ICs belonging to the triple-network model (DMN: IC13, IC18, IC19; ECN: IC25, IC26; SAN: IC12, IC17). In SFNC analysis (Figure 2 and Table1), compared with NC, patients with CS_L displayed decreased negative connectivity between the IC12 of SAN and IC13 of DMN (t=3.777, p=0.000, pFDR <0.05), while patients with CS_R displayed decreased negative connectivity between the IC12 of SAN and IC13 of DMN (t=3.683, p=0.000, pFDR <0.05), increased positive connectivity between the IC17 of SAN and IC13 of DMN (t=3.183, p=0.002, pFDR <0.05), and decreased negative connectivity between the IC12 of SAN and IC25 of ECN (t=3.095, p=0.002, pFDR <0.05). Additionally, different from significant negative connectivity in the NC individuals, the patients with CS_R exhibited significant positive connectivity between the IC17 of SAN and IC25 of ECN (t=3.286, p=0.001, pFDR <0.05, Figure 2). In DFNC analysis, the DFNC matrices were clustered into 4 connectivity states that were recurrent throughout the resting-state fMRI acquisition and in all subjects (Figure 3). Figure 4 shows that the patients with CS_R had an increased reoccurrence fraction and mean dwell time in State 3 (Post hoc t-tests, for reoccurrence fraction, t=0.132, p=0.001; for dwell time, t=-0.091, p=0.008; pFDR <0.05) as well as a decreased reoccurrence fraction and mean dwell time in State 4 (Post hoc t-tests, for reoccurrence fraction, t=7.070, p=0.003; for dwell time, t=-6.277, p=0.012; pFDR <0.05) compared to the NC group. But there is no significant difference of DFNC parameters between CS_L and NC groups. In a further analysis of correlations between SFNC/DFNC parameters and clinical characteristics, we found that the dwell time in State 4 was negatively correlated with accuracy of visual spatial 1-back task in CS_R group (r = -0.359, p=0.008, pFDR <0.05, Figure 4).Discussion and Conclusion
Our results found that the decreased reoccurrence fraction and dwell time in State 4 was negatively correlated with accuracy of visual spatial 1-back task in CS_R group, which suggested the decreased reoccurrence fraction and dwell time in State 4 was beneficial to the recovery of cognitive function in patients with CS_R. Besides, we found more significant SFNC and DFNC changes in CS_R group, indicating more extensive cognitive impairment and reorganization in CS_R patients than those with CS_L. In addition, our results showed that DFNC analysis can capture valuable information that would be missed in SFNC, providing higher overall accuracy to predict cognitive recovery than the SFNC approach.Acknowledgements
We are indebted to our patients and their caregivers for generously supporting our study. This study was supported by the Natural Science Foundation of China (81871327).References
[1] Leśniak Marcin,Bak Thomas,Czepiel Wojciech et al. Frequency and prognostic value of cognitive disorders in stroke patients.[J] .Dement Geriatr Cogn Disord, 2008, 26: 356-63.
[2] Menon Vinod,Large-scale brain networks and psychopathology: a unifying triple network model.[J] .Trends Cogn Sci, 2011, 15: 483-506.
[3] Gonzalez-Castillo Javier,Hoy Colin W,Handwerker Daniel A et al. Tracking ongoing cognition in individuals using brief, whole-brain functional connectivity patterns.[J] .Proc Natl Acad Sci U S A, 2015, 112: 8762-7.
Figures