2480
Relationship between resting-state fMRI functional connectivity and intracranial EEG band-limited power coupling1Hotchkiss Brain Institute, University of Calgary, Calgary, AB, Canada, 2Department of Paediatrics, University of Calgary, Calgary, AB, Canada, 3Department of Radiology, University of Calgary, Calgary, AB, Canada, 4Alberta Children’s Hospital Research Institute, University of Calgary, Calgary, AB, Canada, 5Department of Clinical Neurosciences, University of Calgary, Calgary, AB, Canada, 6Seaman Family MR Research Centre, University of Calgary, Calgary, AB, Canada
Synopsis
Functional connectivity (FC) of resting-state fMRI (rs-fMRI) is a popular method for characterizing brain connectivity. rs-fMRI indirectly measures neuronal fluctuations through blood-oxygenation-level dependent (BOLD) signal and is susceptible to various physiological noise which lead to spurious correlations. We investigated the relationship between rs-fMRI FC and band-limited power (BLP) coupling measured using intracranial EEG (icEEG). Both static and dynamic connectivity analyses revealed a relationship between BOLD FC and icEEG BLP coupling across multiple frequency bands. However, this relationship depends on distance and electrode type. BOLD FC is distinct in fluctuations and spatial variability, suggesting non-neural signal sources in rs-fMRI connectivity.
Introduction
Functional connectivity (FC) of resting-state fMRI (rs-fMRI) has emerged as a widely used method for assessing brain connectivity. FC is identified based on the correlations between their rs-fMRI time series, enabling the characterization of coupled brain areas1,2. However, rs-fMRI only indirectly measures neuronal activity through blood-oxygenation-level dependent (BOLD) signal and is contaminated by physiological noise3–6. These artifacts easily lead to spurious non-neuronal coupling in static and also dynamic FC, a measure which has attracted strong interest in recent years7–10. These issues call into question the validity of rs-fMRI FC in characterizing brain connectivity. Here, we investigated the relationship between resting-state BOLD FC and band-limited power (BLP) coupling from intracranial EEG (icEEG) data to determine the electrophysiological architecture of rs-fMRI functional connectivity.Methods
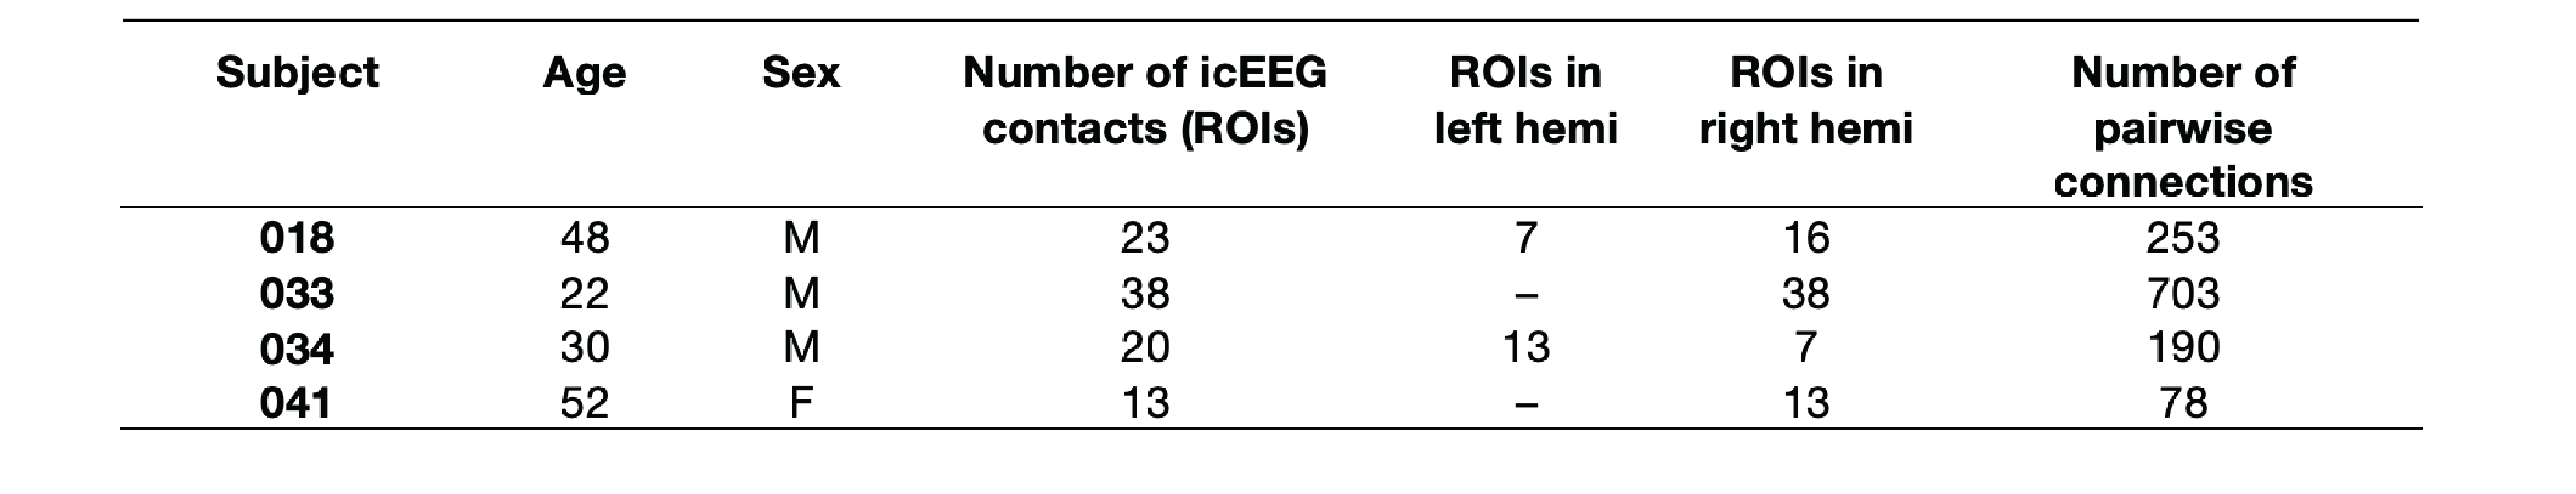
Data were collected from four epilepsy patients who were undergoing intracranial video-EEG monitoring at Foothills Medical Centre, Calgary, Alberta (Table 1)11. All subjects were implanted with depth electrodes. icEEG data was collected at 10000 Hz. Each subject underwent a 20-minute simultaneous resting-state icEEG-fMRI scanning acquisition on a 3T GE Discovery MR750 scanner equipped with an eight-channel head coil to acquire spoiled gradient recalled echo planar images (EPI) with the following parameters: TE = 30ms, TR = 1500ms, flip angle = 65°, 24cm field of view, 64 × 64 matrix, 24mm thick slices.icEEG data preprocessing was performed using a custom code on MATLAB. icEEG preprocessing are as follow: 1) removal of gradient switching artifact; 2) down sampling of data to 2000 Hz; and 3) re-referencing data to a bipolar montage. EPI data was checked for quality and preprocessed using FSL FEAT as follow: 1) realignment to the middle volume; 2) slice-time corrected; 3) linearly co-registered to anatomical images; 4) nuisance regression of white matter, cerebrospinal fluid, and 24 head motion parameters; and 5) application of bandpass filter (0.009 and 0.1 Hz). Analyses were performed in each subject’s T1-weighted anatomical space.
To address our aim, we investigated the relationship between rs-fMRI BOLD FC and icEEG BLP coupling in both static and dynamic connectivity to capture FC variability across time12. For each subject, a spherical region-of-interest (ROI) with 5mm radius was created around each icEEG contact deemed as non-epileptogenic by experienced neurologists. To reflect the bipolar montage of icEEG electrodes, pairwise ROIs from neighbouring contacts were combined. ROIs with a majority (>75%) of voxels lying outside of grey matter were excluded. Average BOLD time-course was then extracted for each ROI and FC between each ROI was computed using Pearson’s correlation. icEEG BLP calculation was carried out using the multitaper method implemented in Fieldtrip13, and power values were averaged in six canonical frequency bands: delta (1–3 Hz), theta (4–7 Hz), alpha (8–12 Hz), beta (13–30 Hz), gamma low (31–50 Hz), gamma high (51–100 Hz), as well as broadband (1–100 Hz). BLP coupling was determined using Pearson correlations of the icEEG power fluctuations for every pairwise ROIs14. Dynamic connectivity was performed using a sliding-window analysis of 120s with 60s overlap on both BOLD and icEEG data, in which correlations between ROIs were computed in each window. The length of the time window has been shown to sufficiently capture slow fluctuations in BOLD signal15. Consistencies between BOLD FC and band-limited power coupling were investigated using general linear models (GLM). All statistical analyses were performed on Fisher-z transformed correlation values.
Results
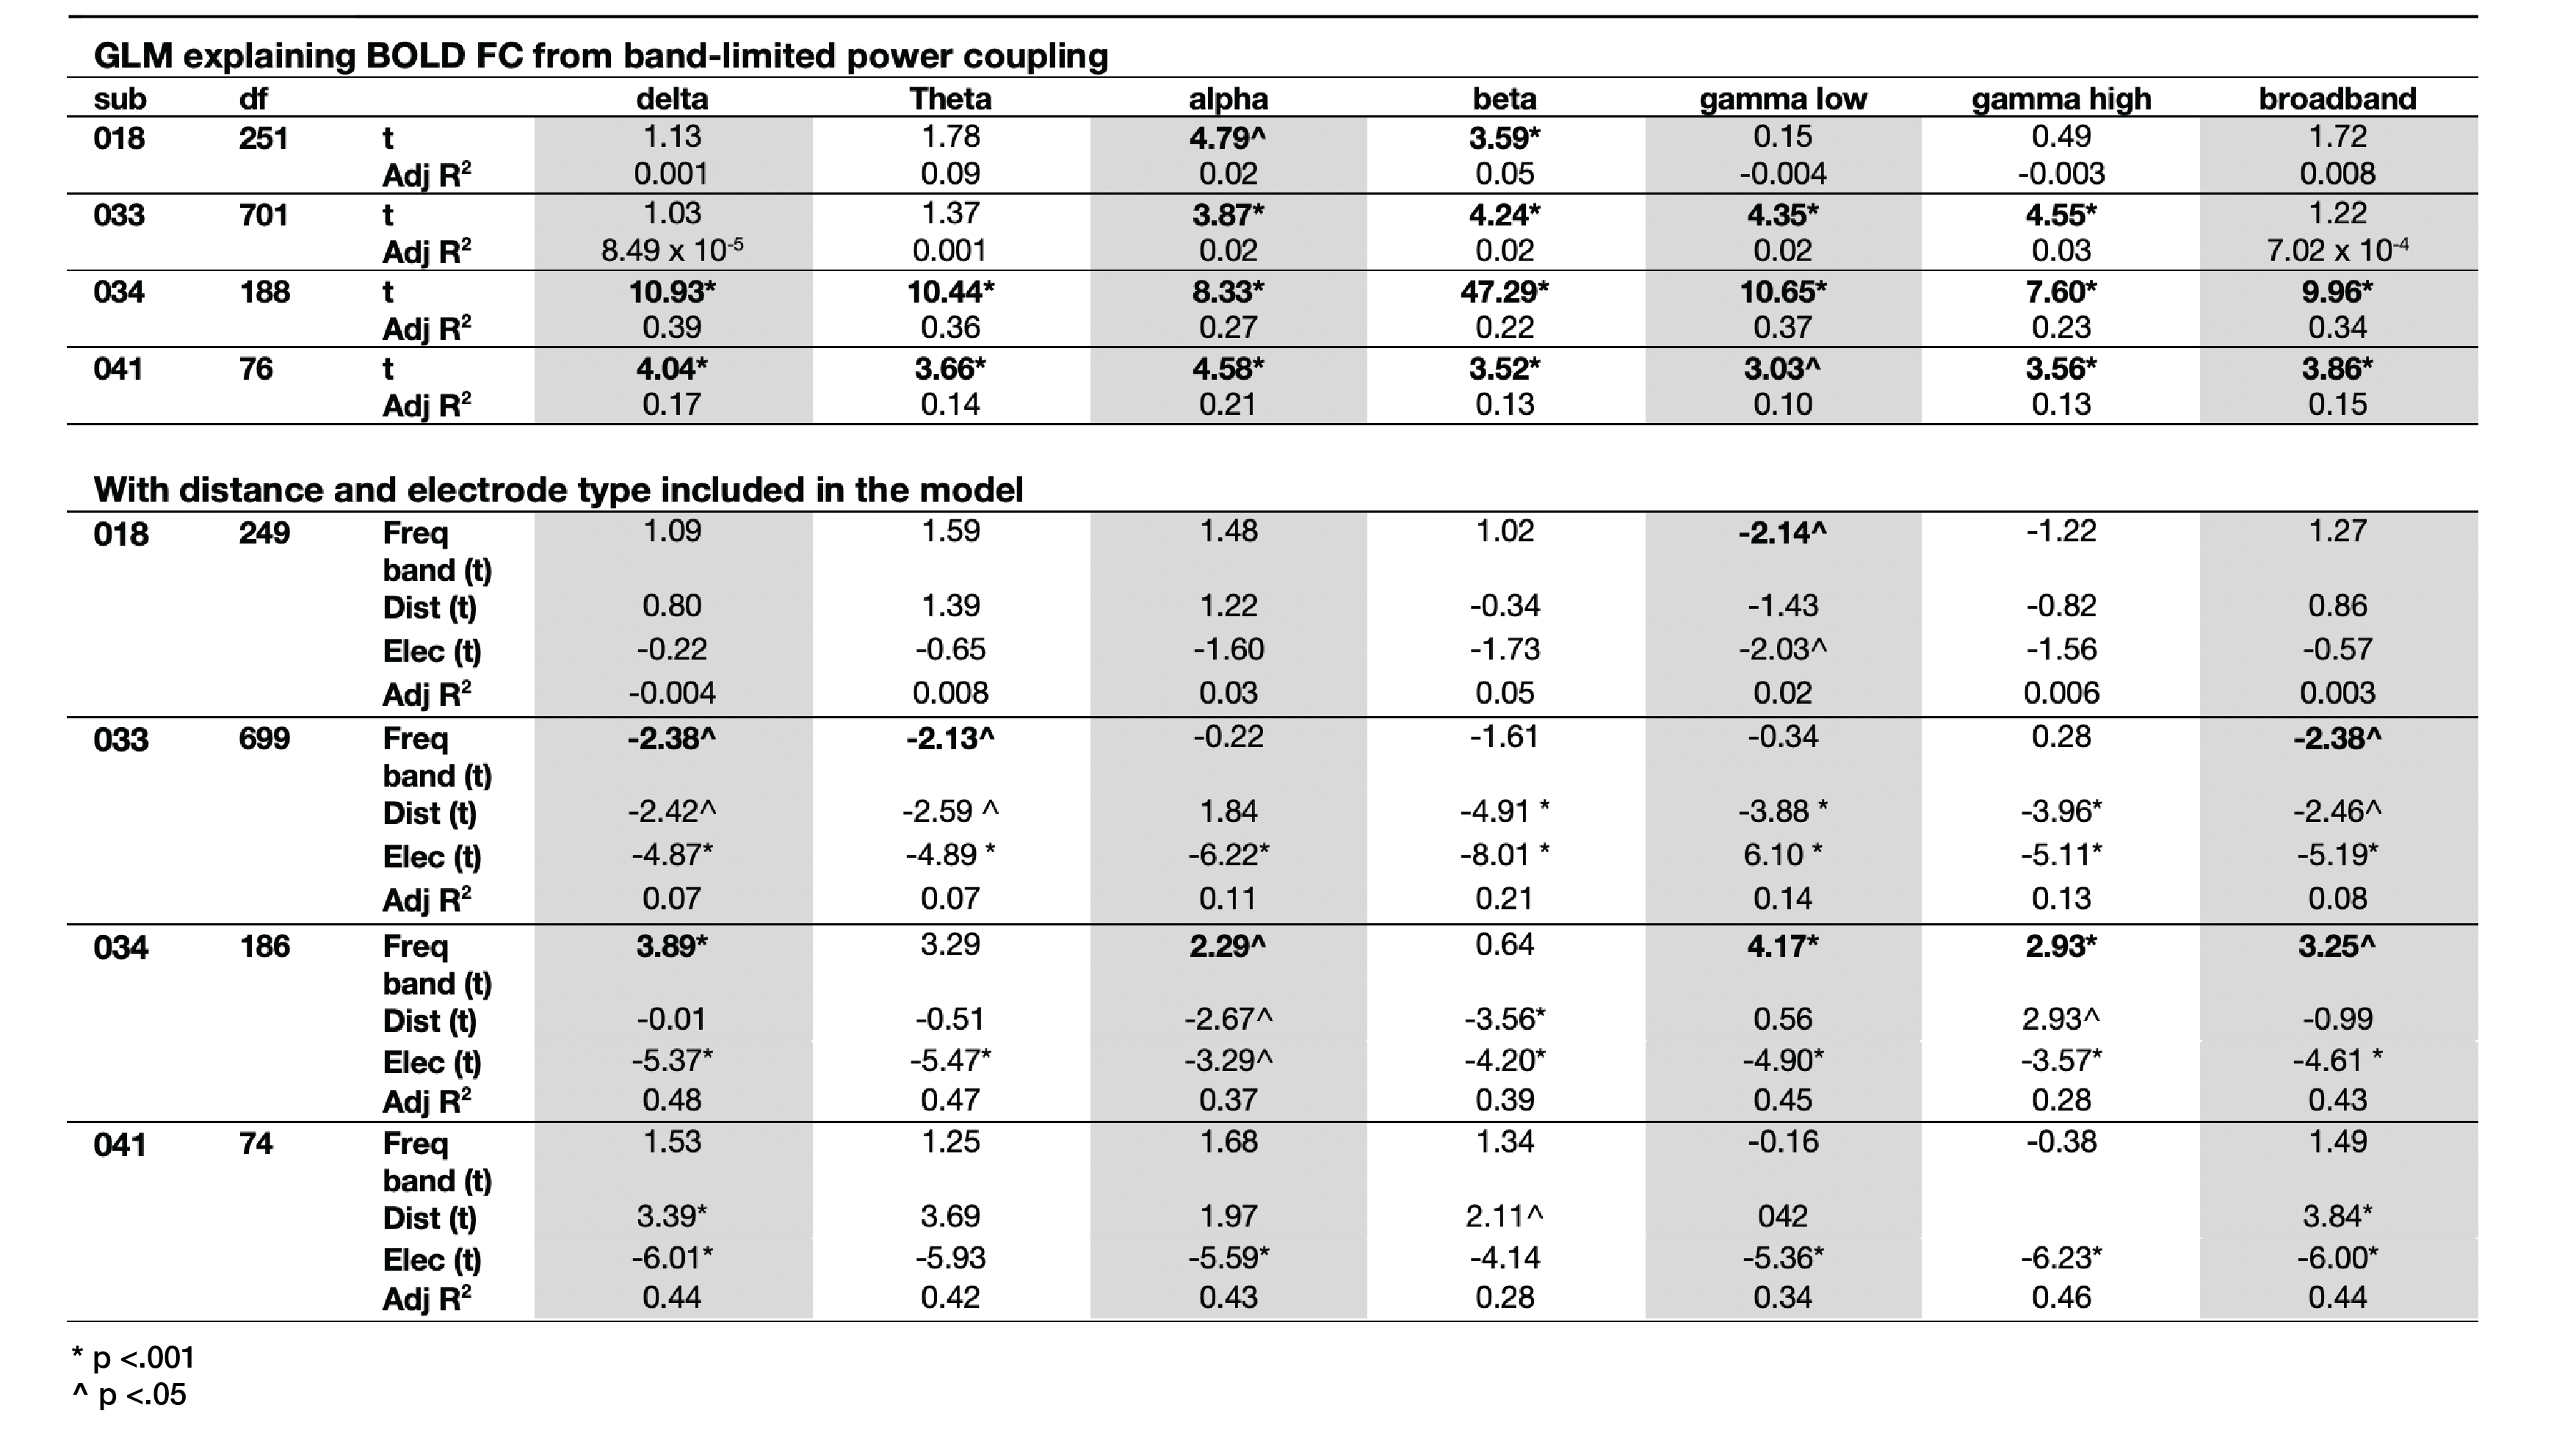
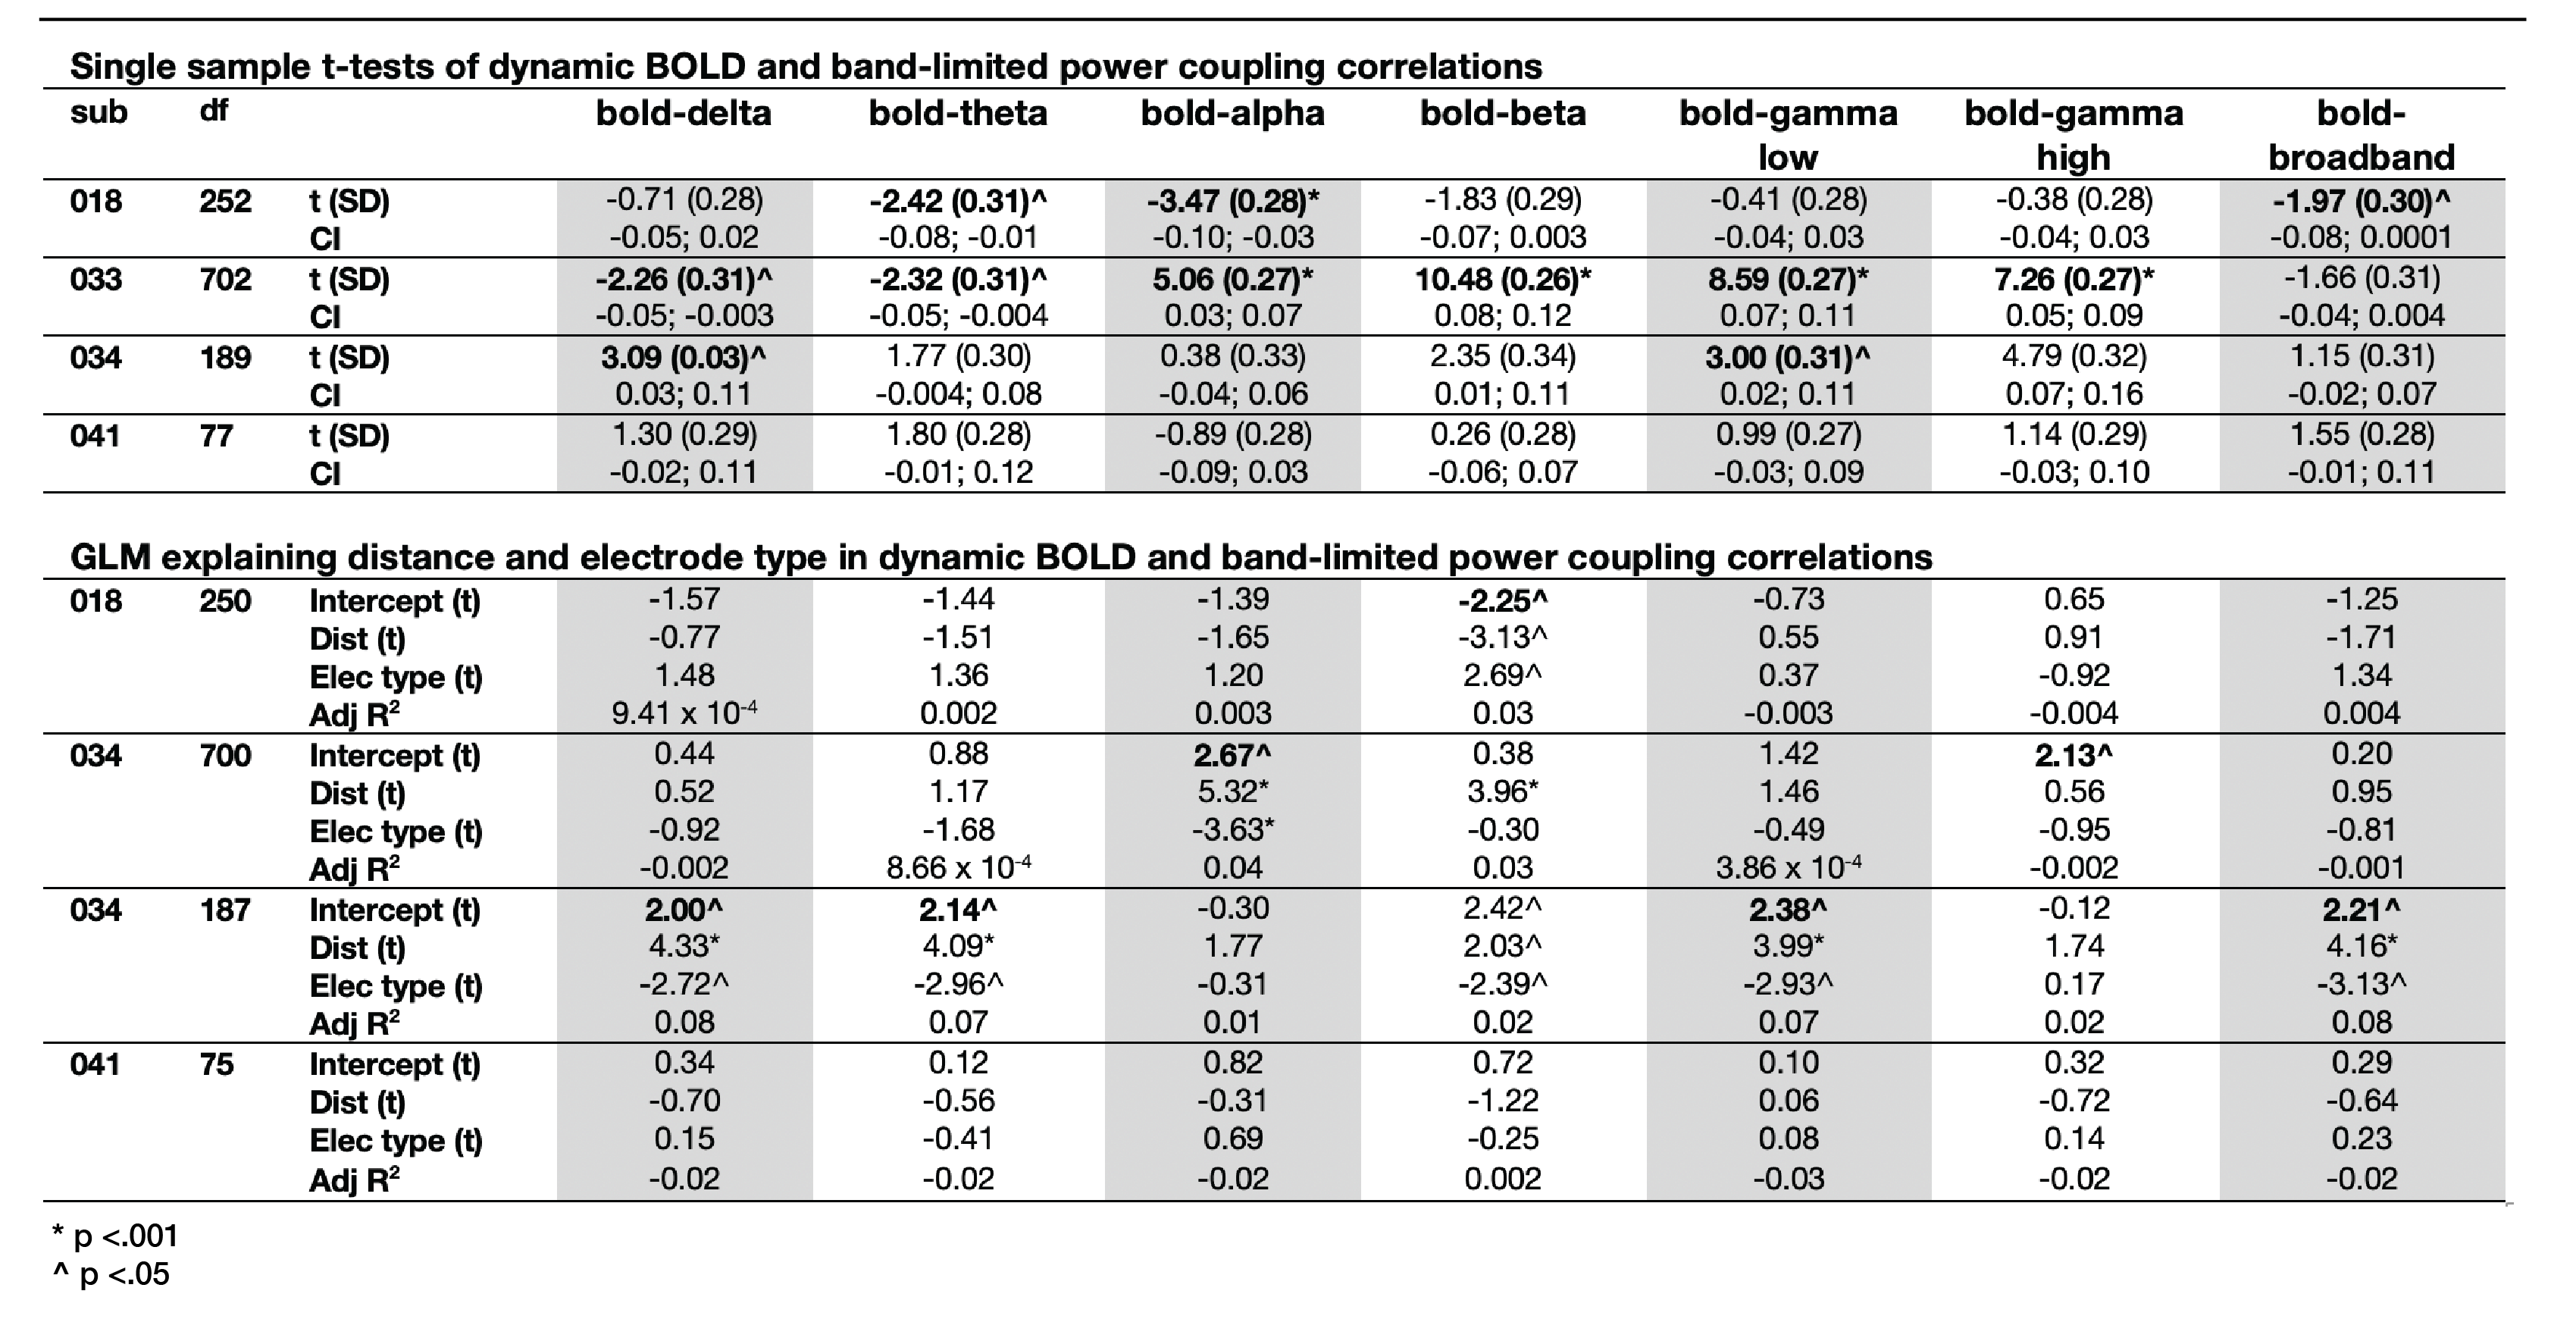
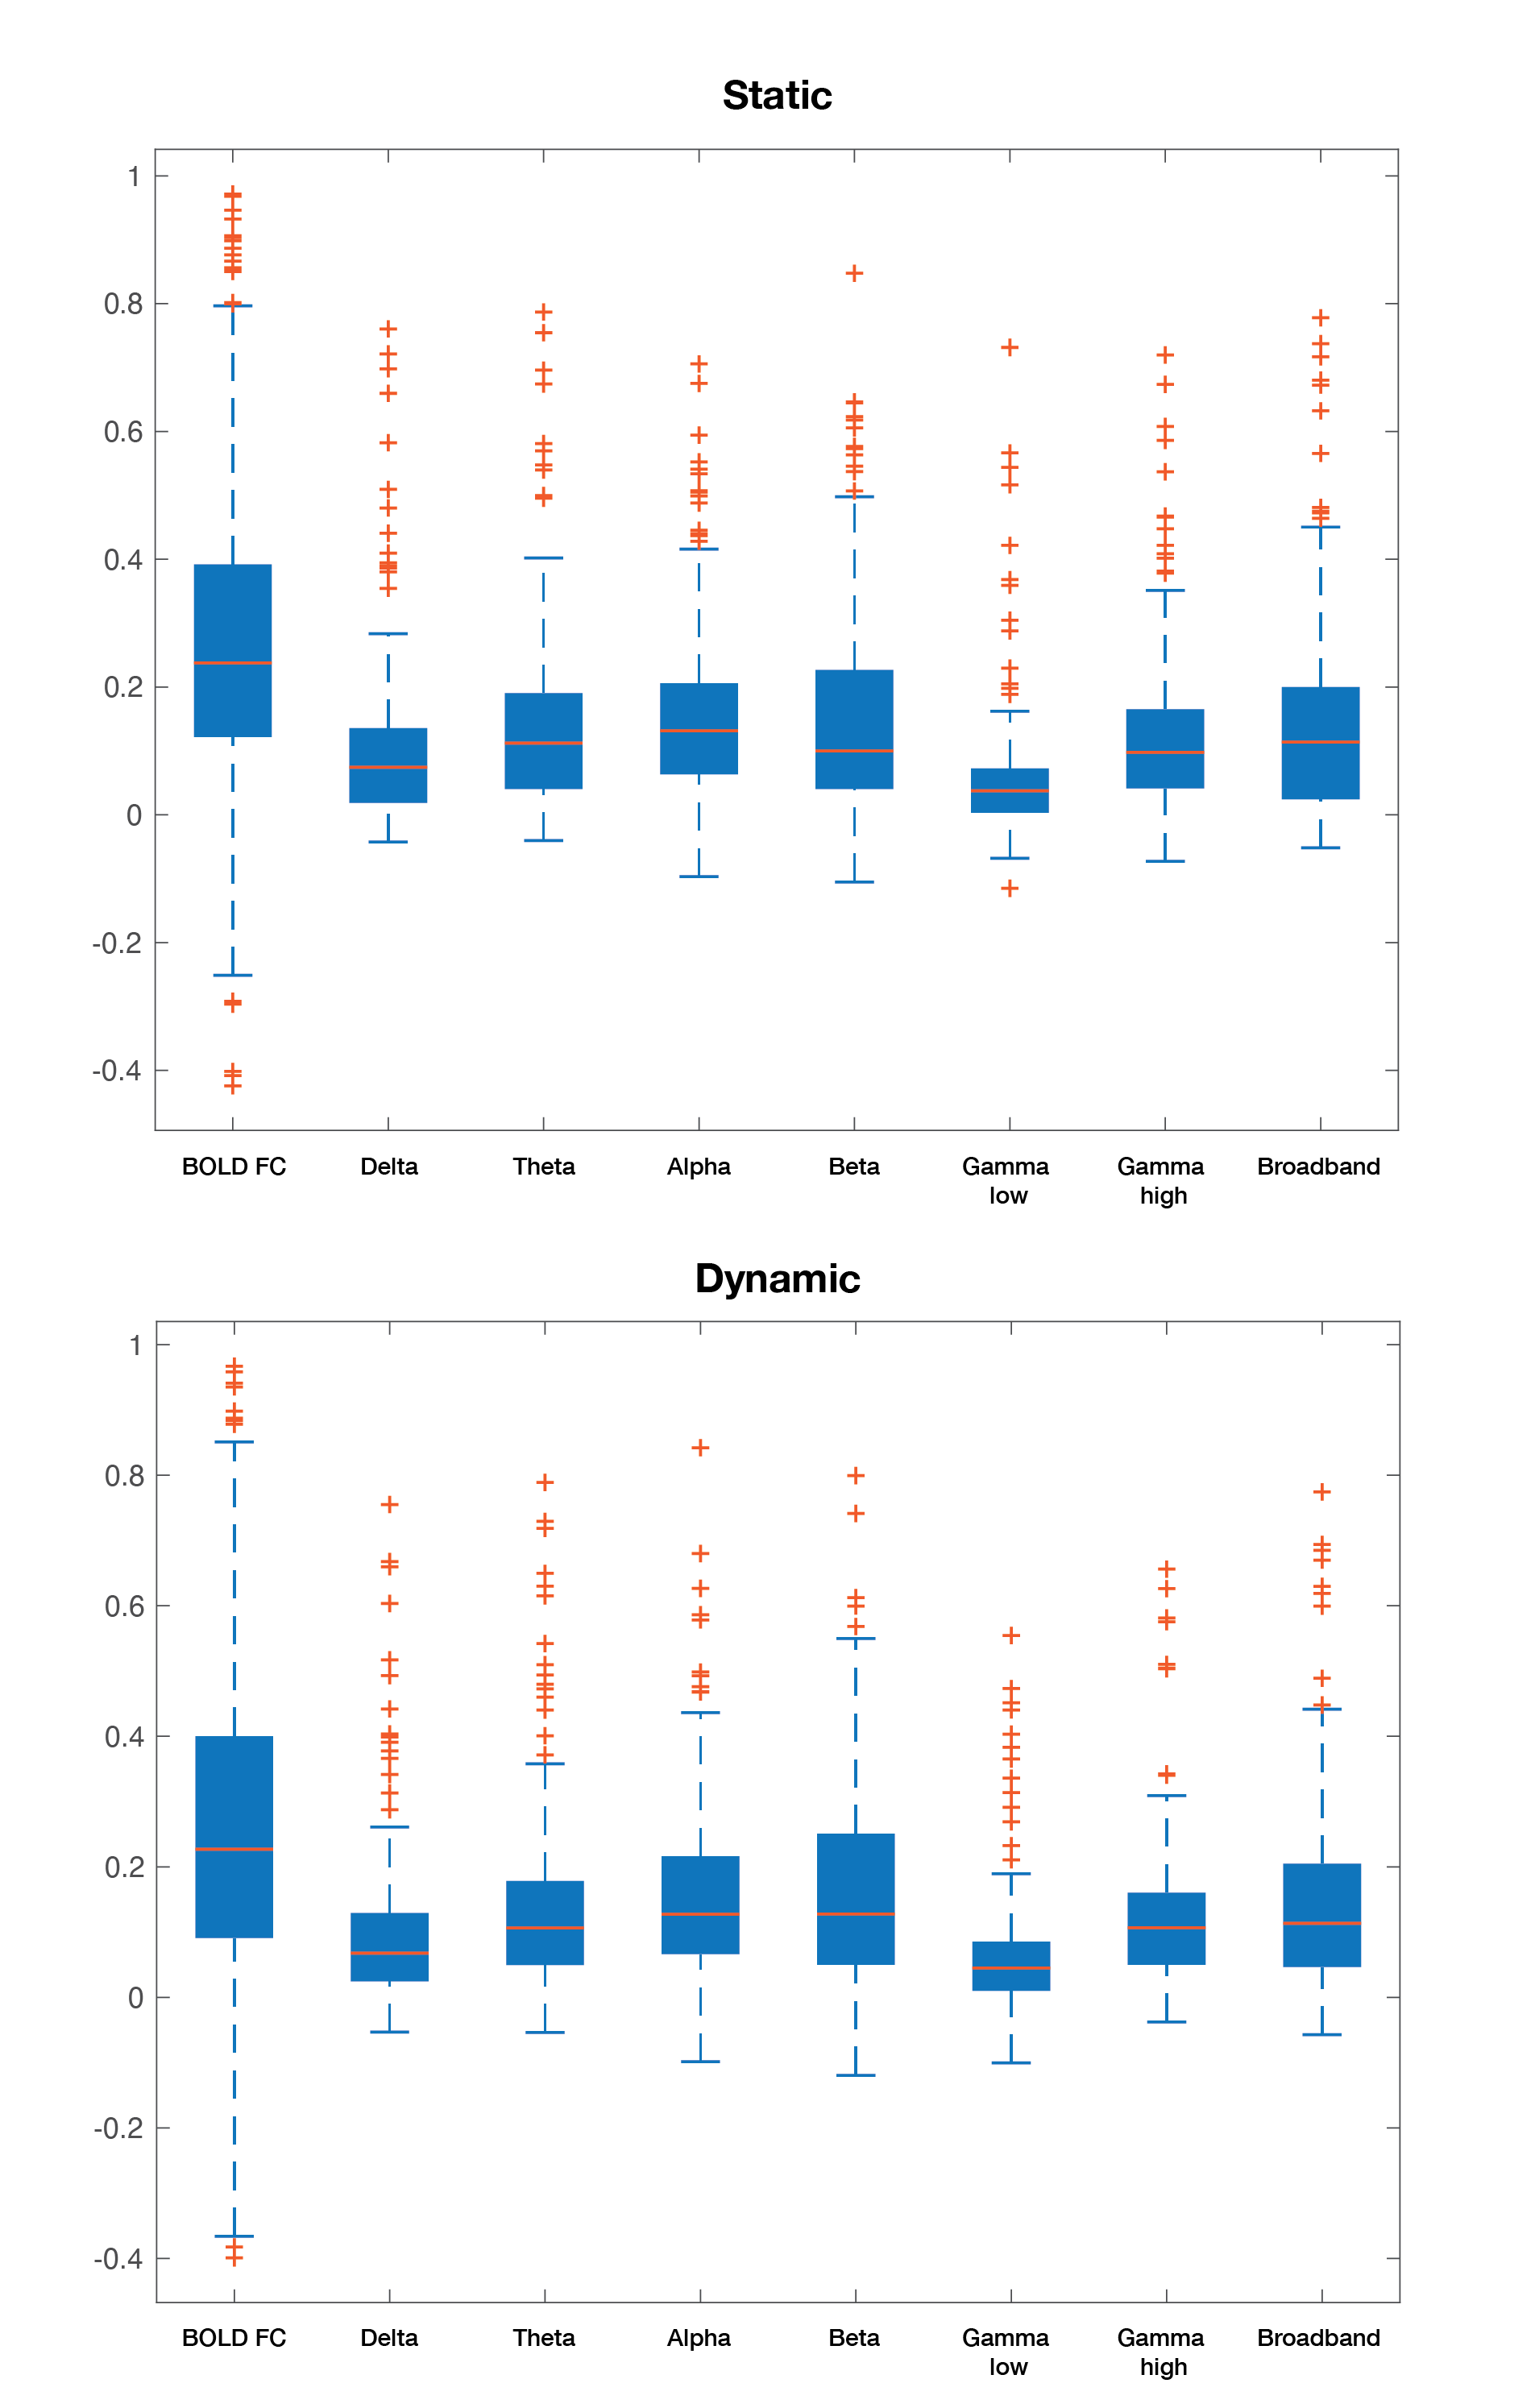
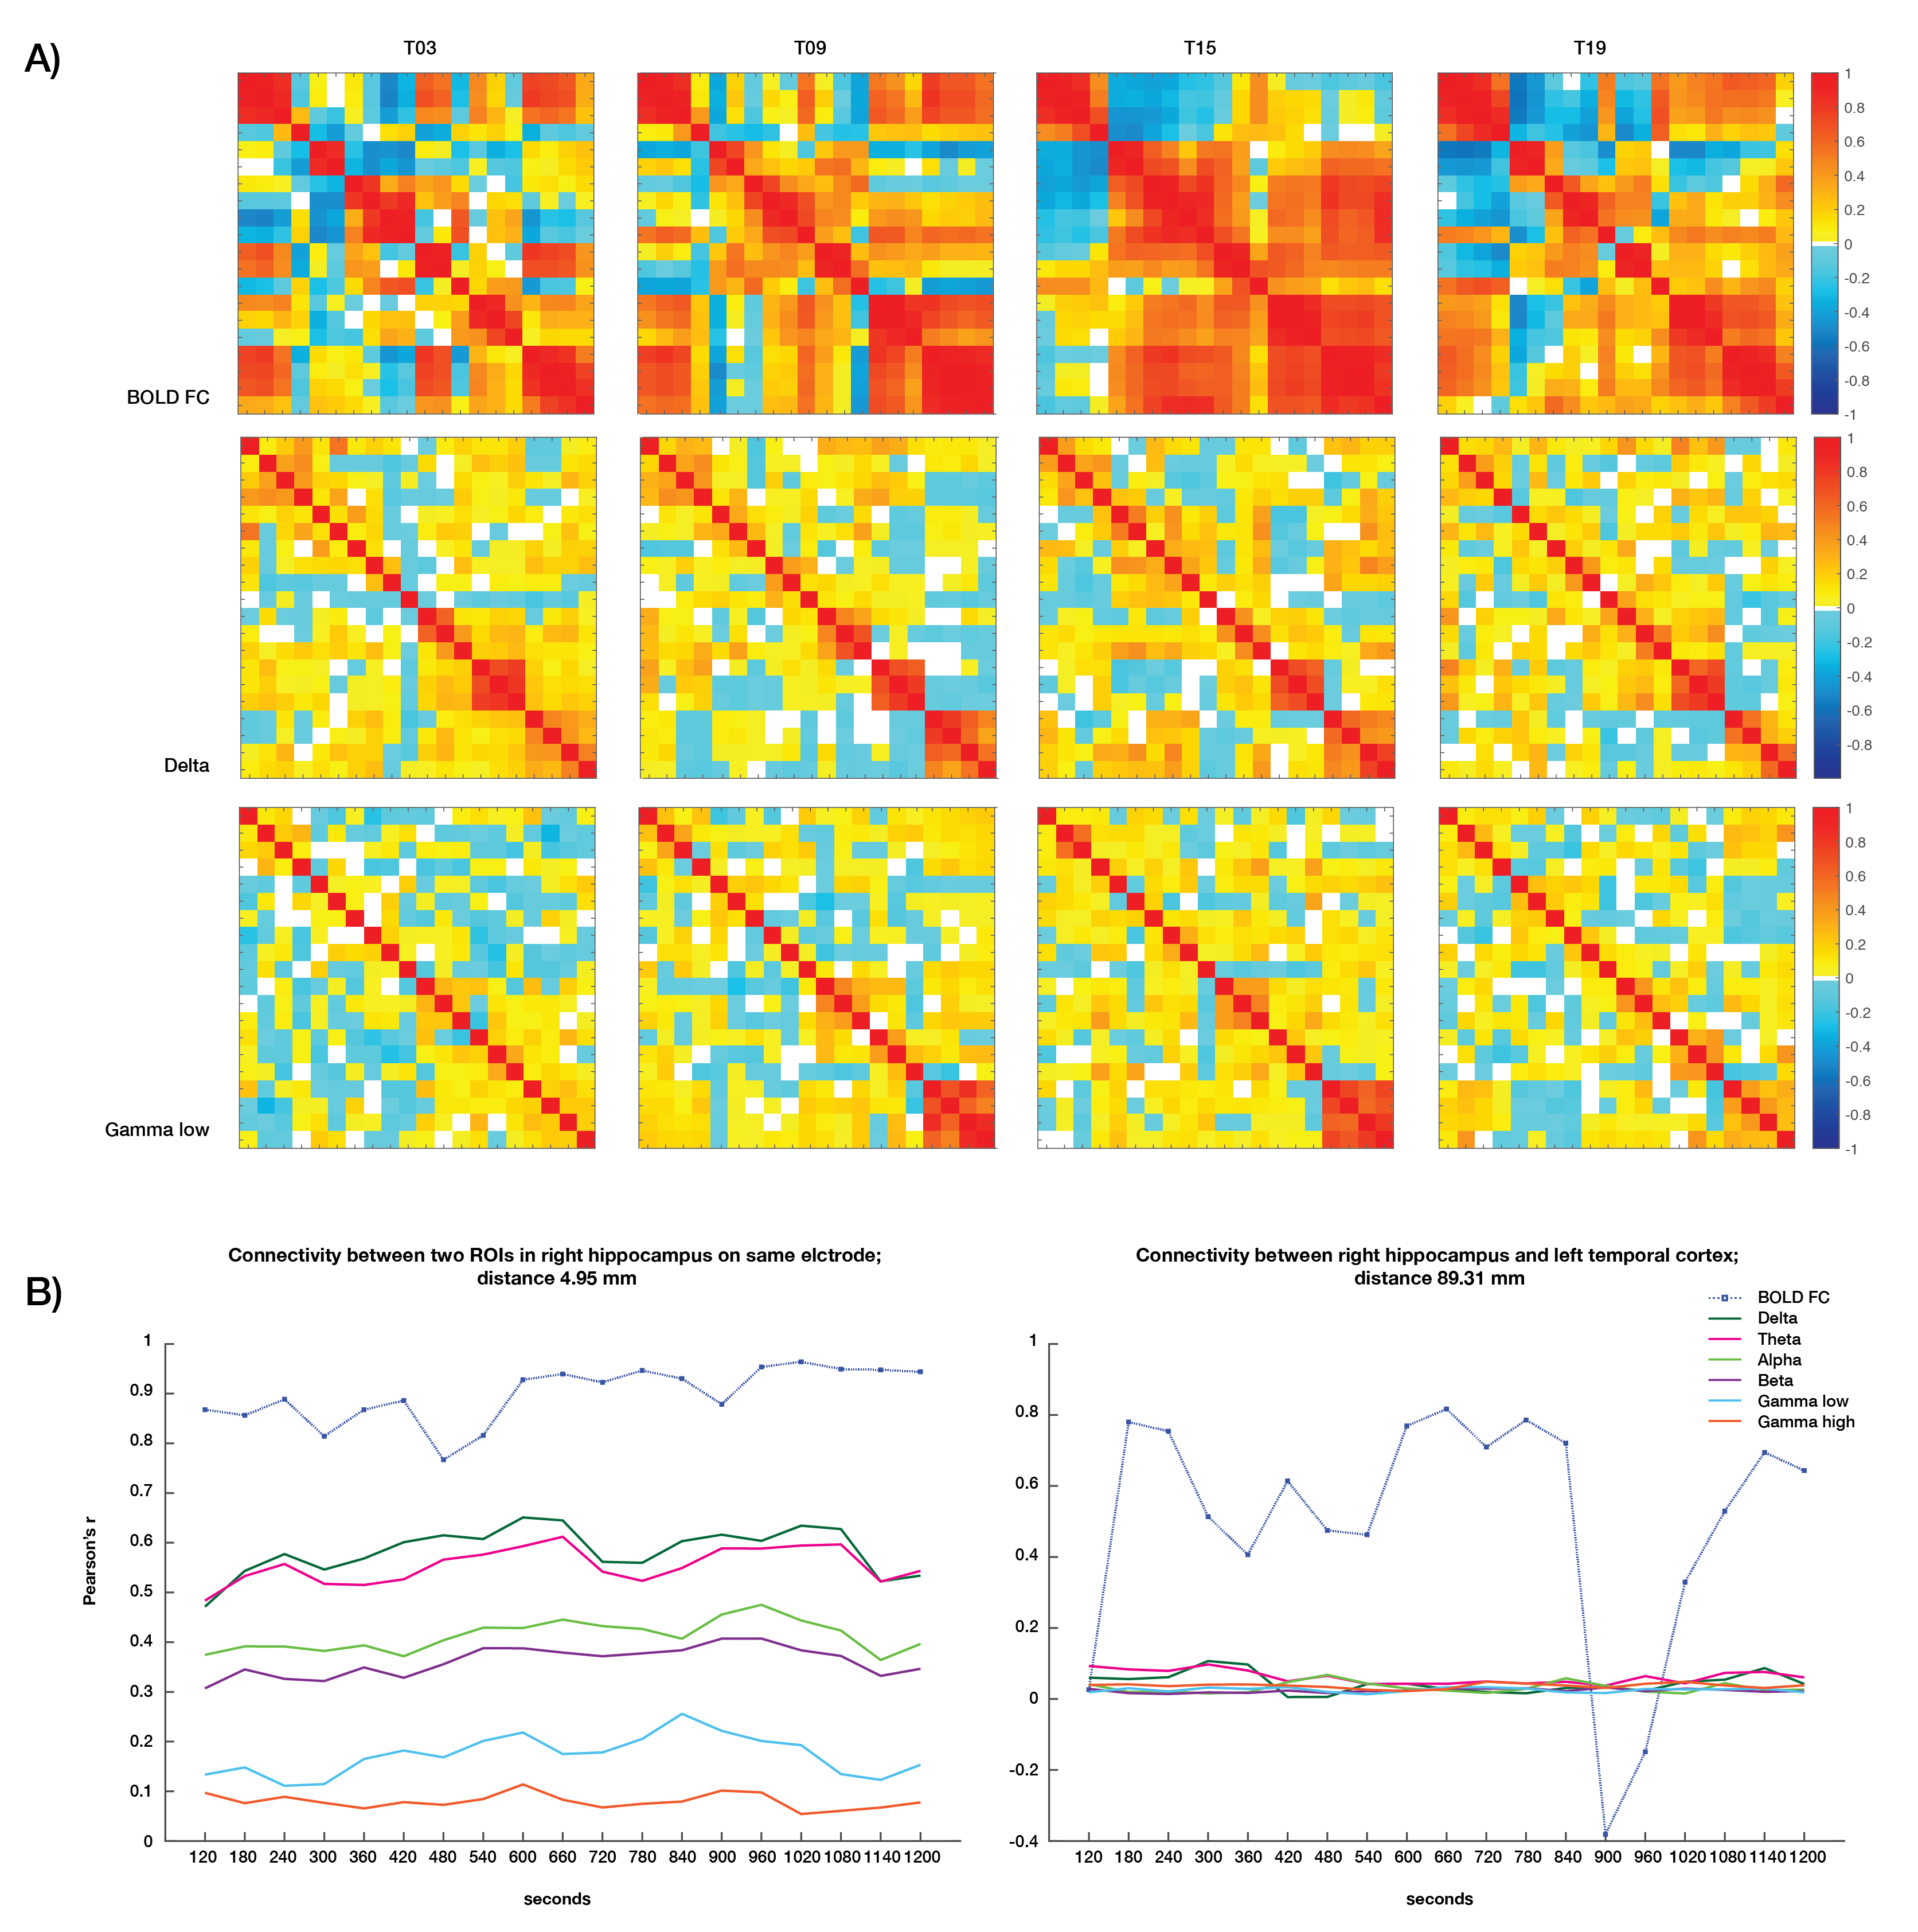
Static connectivity analyses showed that icEEG BLP coupling explains BOLD FC across multiple frequency bands for most participants (Table 2). However, when Euclidean distance between ROIs and electrode type (i.e., whether pairs of connections were from the same electrode or from different electrodes) were included in the GLM, BLP coupling no longer significantly explains BOLD FC for most connections (Table 2).Dynamic connectivity analyses showed that the average correlation between BOLD FC and BLP coupling across time was significantly different from zero for several frequency bands in three subjects (Table 3). The strength of correlations showed significant dependencies when distance and electrode type were included in the model. In general, variability of BOLD FC and BLP coupling showed consistently distinct profiles in both static and dynamic functional connectivity, with BOLD FC demonstrating more variability in connectivity values (Figure 1). Both modalities also show distinct spatial architecture in their connectivity profile, with BOLD showing wider spread of positive and negative FC in adjacent regions, and greater variability with distance (Figure 2).
Discussion
In general, rs-fMRI BOLD FC and icEEG BLP coupling showed some relationship, although the pattern of relationship was not consistent across subjects. Nevertheless, distance plays a role in the relationships between connectivity measured using these two modalities, with connectivity of ROIs from the same electrodes showing more similar fluctuations. BOLD FC shows greater fluctuations across time and distinct spatial architecture when compared to icEEG data. These variabilities may contribute to poorer model fit in dynamic connectivity (i.e., R2 values), and sign change in t-values across subjects for the same frequency band. We conclude from the differences between the two modalities that BOLD FC contain signal that are from non-neural sources, and thus sources of BOLD signal warrants further investigation.Acknowledgements
No acknowledgement found.References
1. Fox MD, Raichle ME. Spontaneous fluctuations in brain activity observed with functional magnetic resonance imaging. Nat Rev Neurosci. 2007;8(9):700-711. doi:10.1038/nrn2201
2. Friston KJ. Functional and Effective Connectivity: A Review. Brain Connect. 2011;1(1):13-36. doi:10.1089/brain.2011.0008
3. Lund TE, Madsen KH, Sidaros K, Luo WL, Nichols TE. Non-white noise in fMRI: Does modelling have an impact? Neuroimage. 2006;29(1):54-66. doi:10.1016/j.neuroimage.2005.07.005
4. Power JD, Schlaggar BL, Petersen SE. Recent progress and outstanding issues in motion correction in resting state fMRI. Neuroimage. 2015;105:536-551. doi:10.1016/j.neuroimage.2014.10.044
5. Power JD, Plitt M, Laumann TO, Martin A. Sources and implications of whole-brain fMRI signals in humans. Neuroimage. 2017;146:609-625. doi:10.1016/j.neuroimage.2016.09.038
6. Satterthwaite TD, Wolf DH, Loughead J, et al. Impact of in-scanner head motion on multiple measures of functional connectivity: relevance for studies of neurodevelopment in youth. Neuroimage. 2012;60(1):623-632. doi:10.1016/j.neuroimage.2011.12.063
7. Bright MG, Murphy K. Is fMRI “noise” really noise? Resting state nuisance regressors remove variance with network structure. Neuroimage. 2015;114:158-169. doi:10.1016/j.neuroimage.2015.03.070
8 Tong Y, Hocke LM, Fan X, Janes AC, deB Frederick B. Can apparent resting state connectivity arise from systemic fluctuations? Front Hum Neurosci. 2015;9(MAY):1-13. doi:10.3389/fnhum.2015.00285
9. Laumann TO, Snyder AZ, Mitra A, et al. On the Stability of BOLD fMRI Correlations. Cereb Cortex. 2017;27(10):4719-4732. doi:10.1093/cercor/bhw265
10. Leonardi N, Van De Ville D. On spurious and real fluctuations of dynamic functional connectivity during rest. Neuroimage. 2015;104:430-436. doi:10.1016/j.neuroimage.2014.09.007
11. Aghakhani Y, Beers CA, Pittman DJ, Gaxiola-Valdez I, Goodyear BG, Federico P. Co-localization between the BOLD response and epileptiform discharges recorded by simultaneous intracranial EEG-fMRI at 3 T. NeuroImage Clin. 2015;7:755-763. doi:10.1016/j.nicl.2015.03.002
12. Chang C, Glover GH. Time-frequency dynamics of resting-state brain connectivity measured with fMRI. Neuroimage. 2010;50(1):81-98. doi:10.1016/j.neuroimage.2009.12.011.Time-frequency
13. Oostenveld R, Fries P, Maris E, Schoffelen JM. FieldTrip: Open source software for advanced analysis of MEG, EEG, and invasive electrophysiological data. Comput Intell Neurosci. 2011;2011. doi:10.1155/2011/156869
14. Thompson GJ, Merritt MD, Pan WJ, et al. Neural correlates of time-varying functional connectivity in the rat. Neuroimage. 2013;83:826-836. doi:10.1016/j.neuroimage.2013.07.036
15. Zalesky A, Breakspear M. Towards a statistical test for functional connectivity dynamics. Neuroimage. 2015;114:466-470. doi:10.1016/j.neuroimage.2015.03.047
Figures