2479
Towards Mapping the Resting-State Connectome of the Limbic System in Real-Time with Connectome-based Neurofeedback1Neurology Department, University of New Mexico, Albuquerque, NM, United States, 2Computer Science Department, University of New Mexico, Albuquerque, NM, United States, 3Nuclear Engineering Department, University of New Mexico, Albuquerque, NM, United States, 4Physics and Astronomy Department, University of New Mexico, Albuquerque, NM, United States
Synopsis
In the present study we develop a real-time seed-based correlation analysis (SBC) pipeline with online regression to compute a connectome fingerprint matrix and characterize the performance of this methodology for quantifying intra- and inter-network connectivity dynamics across major resting state networks (RSNs) in healthy subjects. We assess the association between connectivity in the limbic system and intensity of self-induced mood states with neurofeedback based on the connectome matrix.
Introduction
Resting state fMRI of the limbic system is of interest for studying affective disorders and schizophrenia. There are currently limited means of controlling data quality and intra- and inter-subject consistency of resting-state networks (RSNs) in cross-sectional and longitudinal studies beyond monitoring movement (Dosenbach et al). Monitoring RSN dynamics and false-positive connectivity in real-time would support decision making to adapt a scanning strategy or to stabilize a subject’s level of attention and wakefulness to maximize sensitivity and specificity. In the clinical setting this will increase scan success; reduce scan time and overall cost. In the present study we develop a real-time seed-based correlation analysis (SBC) pipeline with online regression to compute a connectome fingerprint matrix1 and characterize the performance of this methodology for quantifying intra- and inter-network connectivity dynamics across major resting state networks (RSNs) in healthy subjects. We assess the association between connectivity in the limbic system and intensity of self-induced mood states with neurofeedback based on the connectome matrix.Methods
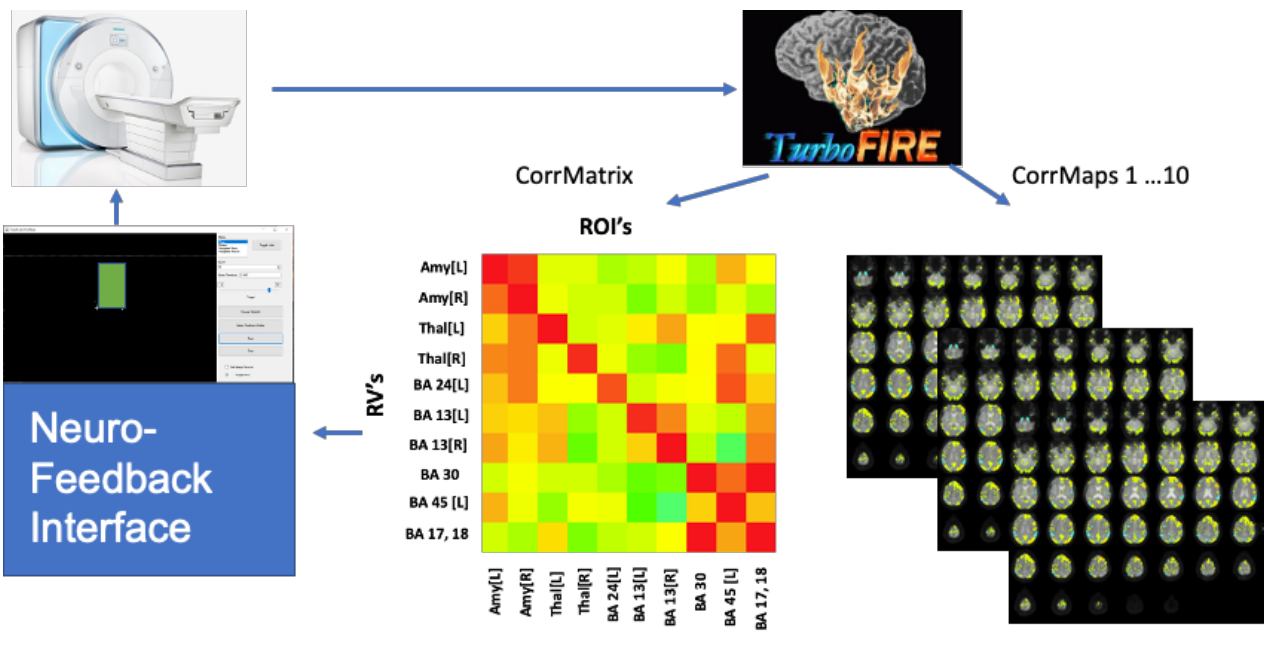
The SBC pipeline was implemented in TurboFIRE software on an external Linux 32-core workstation that was interfaced to the scanner via TCP/IP and employed 10 seed regions in left and right Amygdala, left and right Thalamus, and Brodmann areas 24[L], 13[L], 13[R], 30, 45[L], and 17/18 (Figure 1). Partial correlations and regression of 6 rigid body movement parameters and CSF and white matter signals were computed using averaged sliding-windows (15s) 2,3. This approach, which is highly tolerant to confounding signals, provides functional intra- and inter-network connectivity patterns similar to those obtained with conventional offline2,4. Averaged sliding window partial correlations with regression between the 10 seed regions were computed as a metric of inter-network connectivity and displayed as a dynamically updated color-coded 10x10 matrix. A graphical user interface developed in C-sharp on a Windows computer read the correlation matrices via Samba share with reduced caching in Windows to ensure real-time data transfer, averaged the matrix elements excluding the diagonals and displayed the result to the subject in form of a thermometer to provide feedback of limbic connectivity. In addition to averaging matrix elements, we have the functionality to calculate the median.Multi-band (8) dual-echo fMRI with weighted echo averaging was used to maximize BOLD sensitivity in amygdala5, while maintaining high temporal resolution (400 ms). The real-time computational performance of the SBC analysis chain was tested in 3 healthy controls on a 3 Tesla scanner during 3 minute scans. Subjects were asked to recall intense memories involving sadness. Subjects rated their level of experienced emotion on a 10-point scale. Subjects were asked to perform the mood induction and control tasks while viewing the neurofeedback interface and to maximize inter-limbic connectivity during mood induction trials. Psycho-physiological measures (HR, RR, pCO2), intra-scan mood ratings on a 10-point scale, and post-scan self-reports were obtained.
Results
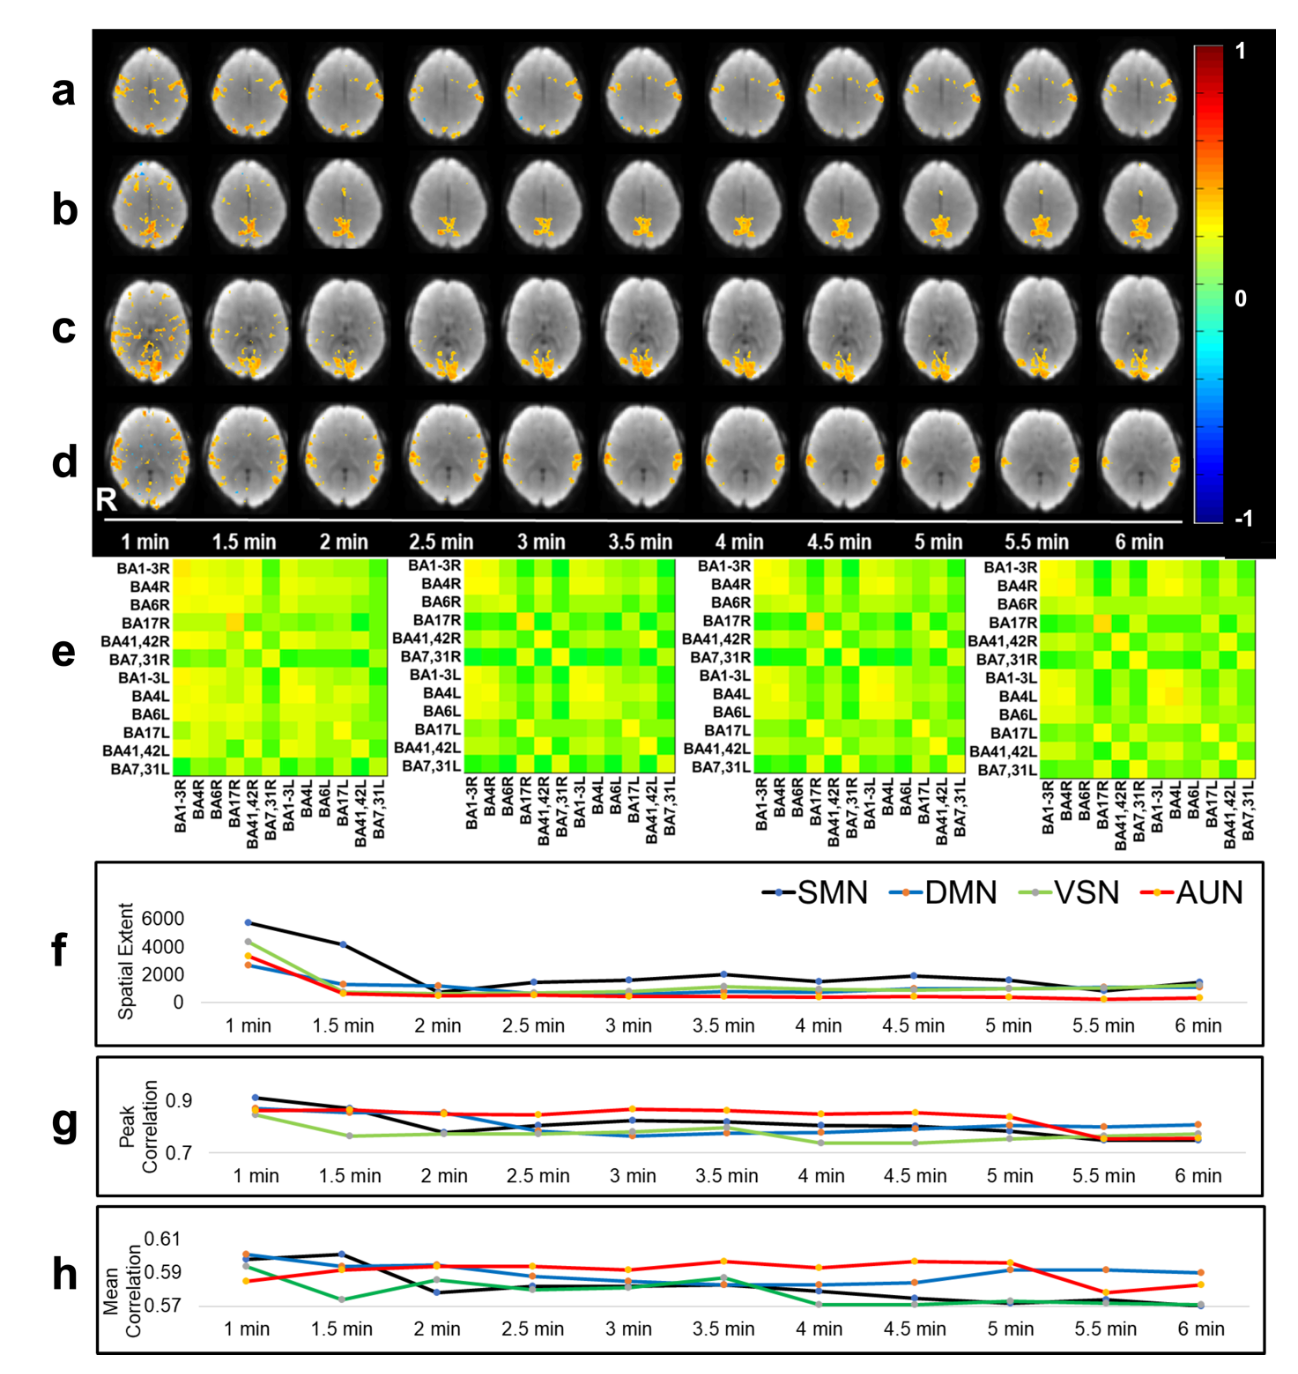
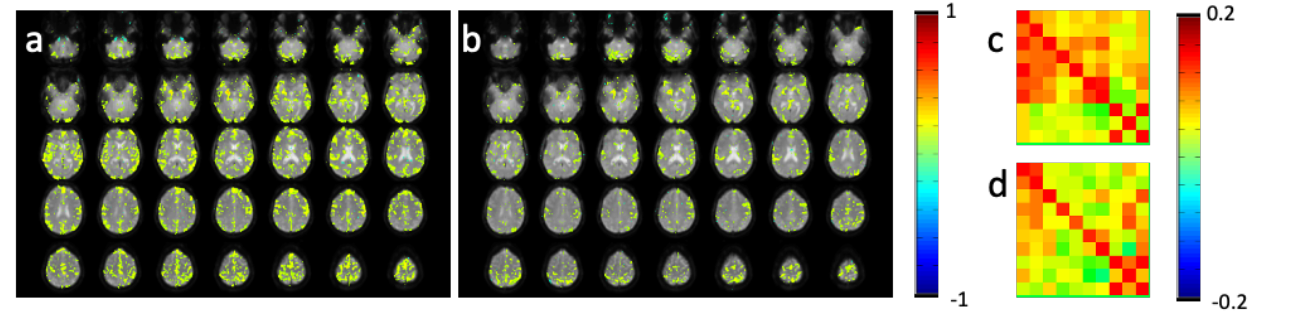
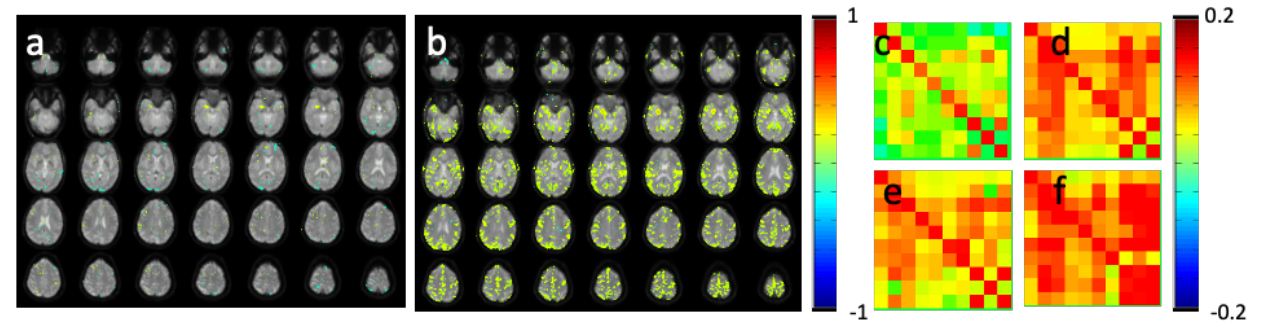
An example of monitoring intra- and inter-network temporal dynamics during neutral mood state using the 2nd level sliding-window approach is shown in Figure 2. Figure 2e shows a 10×10 connectome matrix that monitors the stabilization of intra-network correlations within 12 seed regions during the scan with corresponding metrics (Figure 2f-h). Mood induction increased connectivity in amygdala and orbitofrontal cortex, insular cortex, secondary somatosensory cortex (SII), anterior and posterior cingulate cortex. The first subject suffered mild claustrophobia in the beginning of the scanning session with fear induction. Increased limbic connectivity in the correlations maps and the connectivity was still seen in the first resting state scan without mood induction, in particular in amygdala, as expected (Figure 3). During the subsequent mood induction scan the subject the subject calmed down and experienced moderate sadness (5/10). Connectivity decreased compared to the first scan but exceeded that measured in the next subject during rest. The second subject reported neutral mood during the first rest scan (Figure 4), 8/10 during the first mood induction, 5/10 during the second mood induction and 10/10 during the 3rd mood induction, which corresponded to the connectivity seen in limbic regions in correlation maps and in the connectome matrices.Discussion
Our preliminary data suggest that the developed pipeline enables monitoring of limbic system connectivity in real-time and the measured connectivity appear to correlate with subject self-report. Further subjects will be scanned to confirm these preliminary findings. We are currently investigating contrast-to-noise in the connectome matrix as a function of the width of the second level window. The next step will be to introduce weighted averaging of them based on the observed maxima in the matrix. The feedback interface worked as intended, however, reports suggest that a thermometer is possibly a distraction during mood induction, and we thus developed a new interface using emojis with 3 levels of depicted sadness, which is being tested. This methodology will enable innovative individualized designs of fMRI experiments, which include (a) interactive brain-imaging-guided interview of patients suffering from psychiatric and neurological disorders that are refractory to conventional diagnosis and treatment, and (b) individualized training of mental abilities and control of brain activation patterns using experimental feedback.Conclusion
This real-time technology will maximize the sensitivity and specificity of mapping RSN in individual subjects; it enables online data quality control and real-time computation of whole brain RSN connectivity fingerprints.Acknowledgements
Supported by 1P30GM122734-01 - NIHCOBREIIIPossePilotY3. We gratefully acknowledge Robin Campos, Kunxiu Gao, Sudhir Ramanna, Essa Yacoub, and Lily Chau for help with methodology.References
[1] E. A. Allen, E. B. Erhardt, E. Damaraju, W. Gruner, J. M. Segall, R. F. Silva, M. Havlicek, S. Rachakonda, J. Fries, R. Kalyanam, A. M. Michael, A. Caprihan, J. A. Turner, T. Eichele, S. Adelsheim, A. D. Bryan, J. Bustillo, V. P. Clark, S. W. Feldstein Ewing, F. Filbey, C. C. Ford, K. Hutchison, R. E. Jung, K. A. Kiehl, P. Kodituwakku, Y. M. Komesu, A. R. Mayer, G. D. Pearlson, J. P. Phillips, J. R. Sadek, M. Stevens, U. Teuscher, R. J. Thoma, and V. D. Calhoun, "A baseline for the multivariate comparison of resting-state networks," Front Syst Neurosci, vol. 5, p. 2, 2011, 3051178.
[2] S. Posse, E. Ackley, R. Mutihac, T. Zhang, R. Hummatov, M. Akhtari, M. Chohan, B. Fisch, and H. Yonas, "High-speed real-time resting-state FMRI using multi-slab echo-volumar imaging," Front Hum Neurosci, vol. 7, p. 479, 2013, 3752525.
[3] G. K. Vakamudi K, Trapp C, Scantlen G, Posse S. , "Resting State Network Dynamics using Sliding-Window Detrending and Meta-Statistics: A New Approach for Real-Time fMRI. ," in Proc. International Society for Magnetic Resonance in Medicine (ISMRM) Honolulu, HI, 2017, p. 5378.
[4] K. Vakamudi, Chohan, Mohammad, Yonas, Howard, Chaney, Mona, Posse, Stefan. , "Real-Time Resting-state fMRI for Presurgical Mapping in Patients with Brain Tumors," in Proc. International Society for Magnetic Resonance in Medicine (ISMRM), Paris, France, 2018, p. 596.
[5] S. Posse, D. Fitzgerald, K. Gao, U. Habel, D. Rosenberg, G. J. Moore, and F. Schneider, "Real-time fMRI of temporolimbic regions detects amygdala activation during single-trial self-induced sadness," NeuroImage, vol. 18, pp. 760-768, 2003.
Figures