2472
Linking functional and structural brain organisation with behaviour in healthy adults1Radboud University Medical Centre, Donders Institute for Brain, Cognition and Behaviour, Nijmegen, Netherlands
Synopsis
Understanding brain-behaviour correlates is challenging. Multimodal approaches increase the sensitivity to brain-behaviour relationships. Here we integrated grey matter density maps, structural connectivity metrics and functional connectopic (gradient) maps from 676 participants of the HCP, with the hypothesis that these more advanced measures of both structural and functional organisation would improve sensitivity to brain-behaviour associations. Our results show 1 component significantly associated with various behavioural measures including multiple measures of alcohol use. This component was composed of structural modalities. There was little shared variance between structural measures and functional gradients across the components.
Background
Understanding the neural correlates of behaviour is challenging, both in healthy variation and pathological phenotypes. However this endeavour is vital as it provides the fundamental knowledge upon which better treatments are developed and clinical decisions based. Individual variation that often hampers classical approaches may be the key to unlocking our understanding of brain-behaviour relationships once appropriate approaches are implemented. Linked Independent Component Analysis (LICA) is one such useful tool for integrating various sources of data through a shared mixing matrix1. Applications in neuroimaging have already revealed associations between multimodal brain phenotypes and demographic and behavioural variables. Importantly these have revealed a multimodal brain phenotype with associations to a positive-negative spectrum of behavioural measures2. Previously little was gained, in terms of variance explained, by including functional MRI in this analysis. Here we aimed to expand on the previous findings by utilising advanced unimodal processing to further our understanding of the brain-behaviour relationships and potentially of brain structure-function relationships themselves.Methods
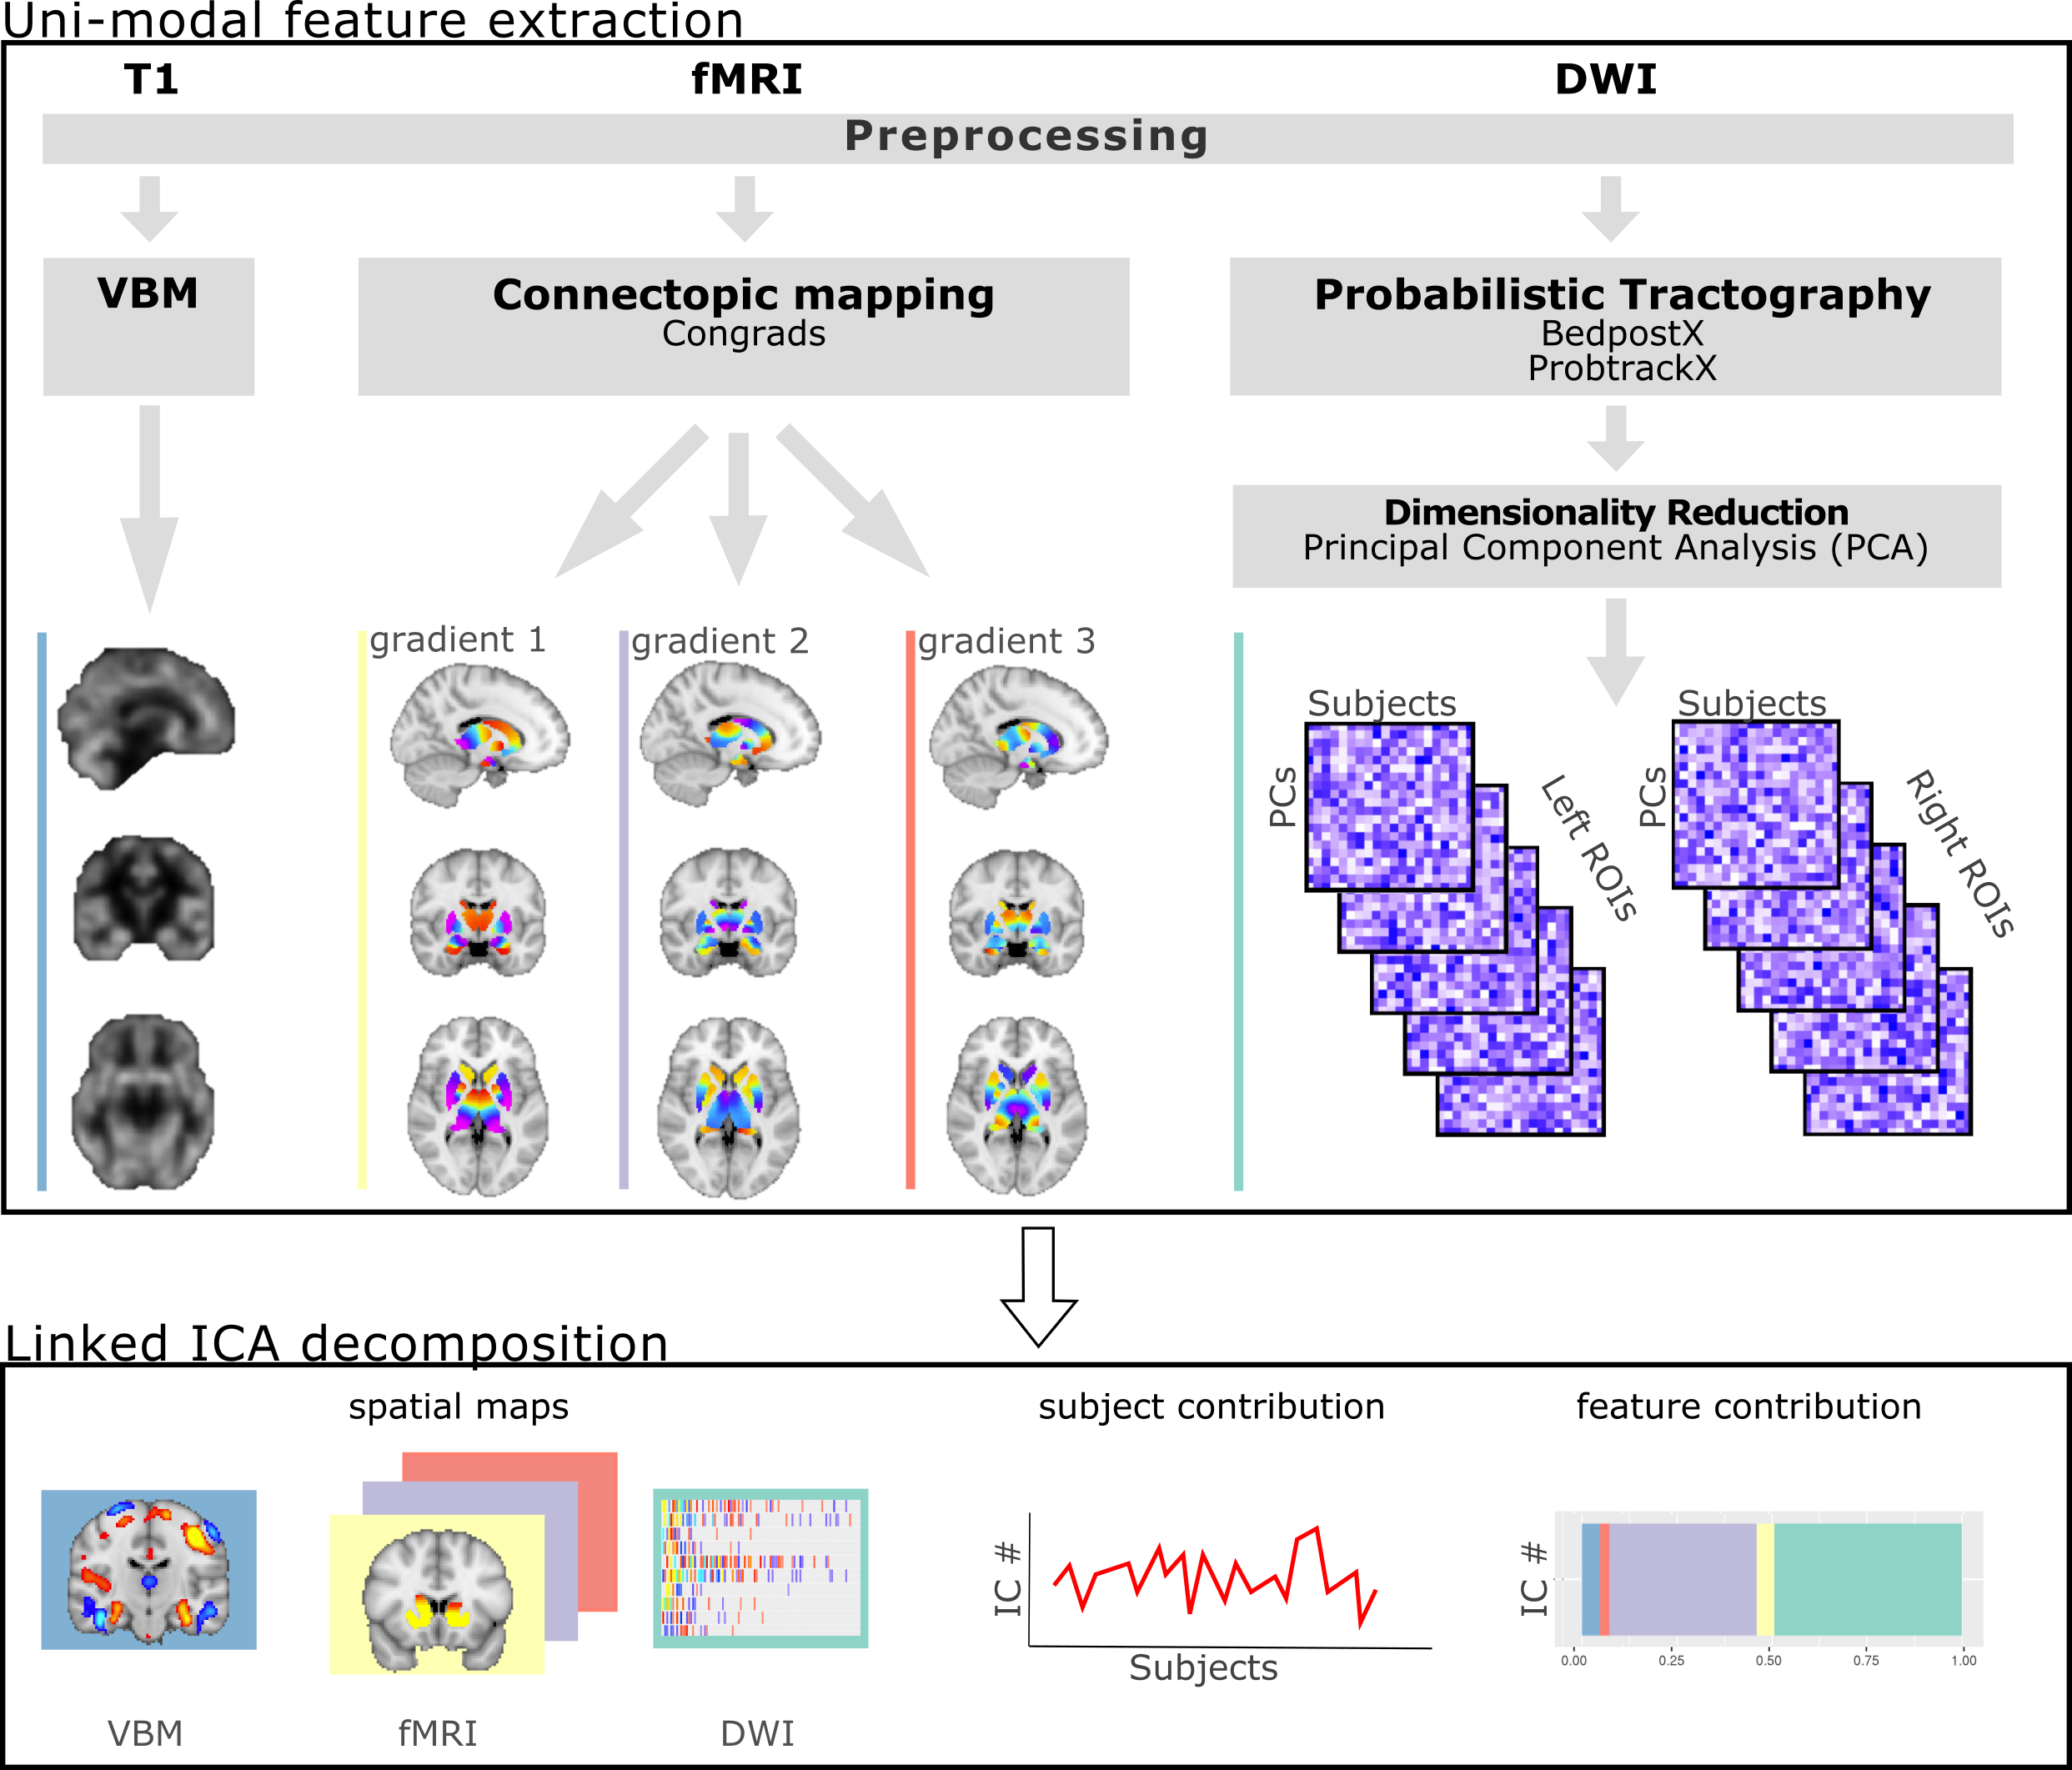
We utilised multimodal MRI (T1w, resting-state functional [fMRI] and diffusion weighted [DWI]) and behavioural data from the Human Connectome Project (HCP, n=676; 51% female)3. An overview of the pipeline is shown in Figure 1. Structural unimodal features were extracted to produce individual grey matter density maps and probabilistic tractography connectivity matrices from the T1 and DWI data, respectively. Additional data reduction with principal component analysis of the DWI data was applied. DWI and fMRI analyses were restricted to subcortical structures.To probe the potential multiplicity of functional organisation of the brain we performed connectopic mapping analysis4. This generated topographic maps of ROIs which are determined by their functional connectivity to the cortex. LICA was then used to integrate the unimodal features linking them through a shared mixing matrix1. We generated 100 components each with their own set of spatial maps, modality loading weights and subject loadings. Permutation Analysis of Linear Models (PALM5) was used to test the correlations between demographic/behavioural measures (n=329) and subject loadings from LICA components while accounting for non-independence of subjects due to relatedness with exchangeability blocks. Multiple comparison correction was implemented with the false discovery rate (FDR) procedure6.Results
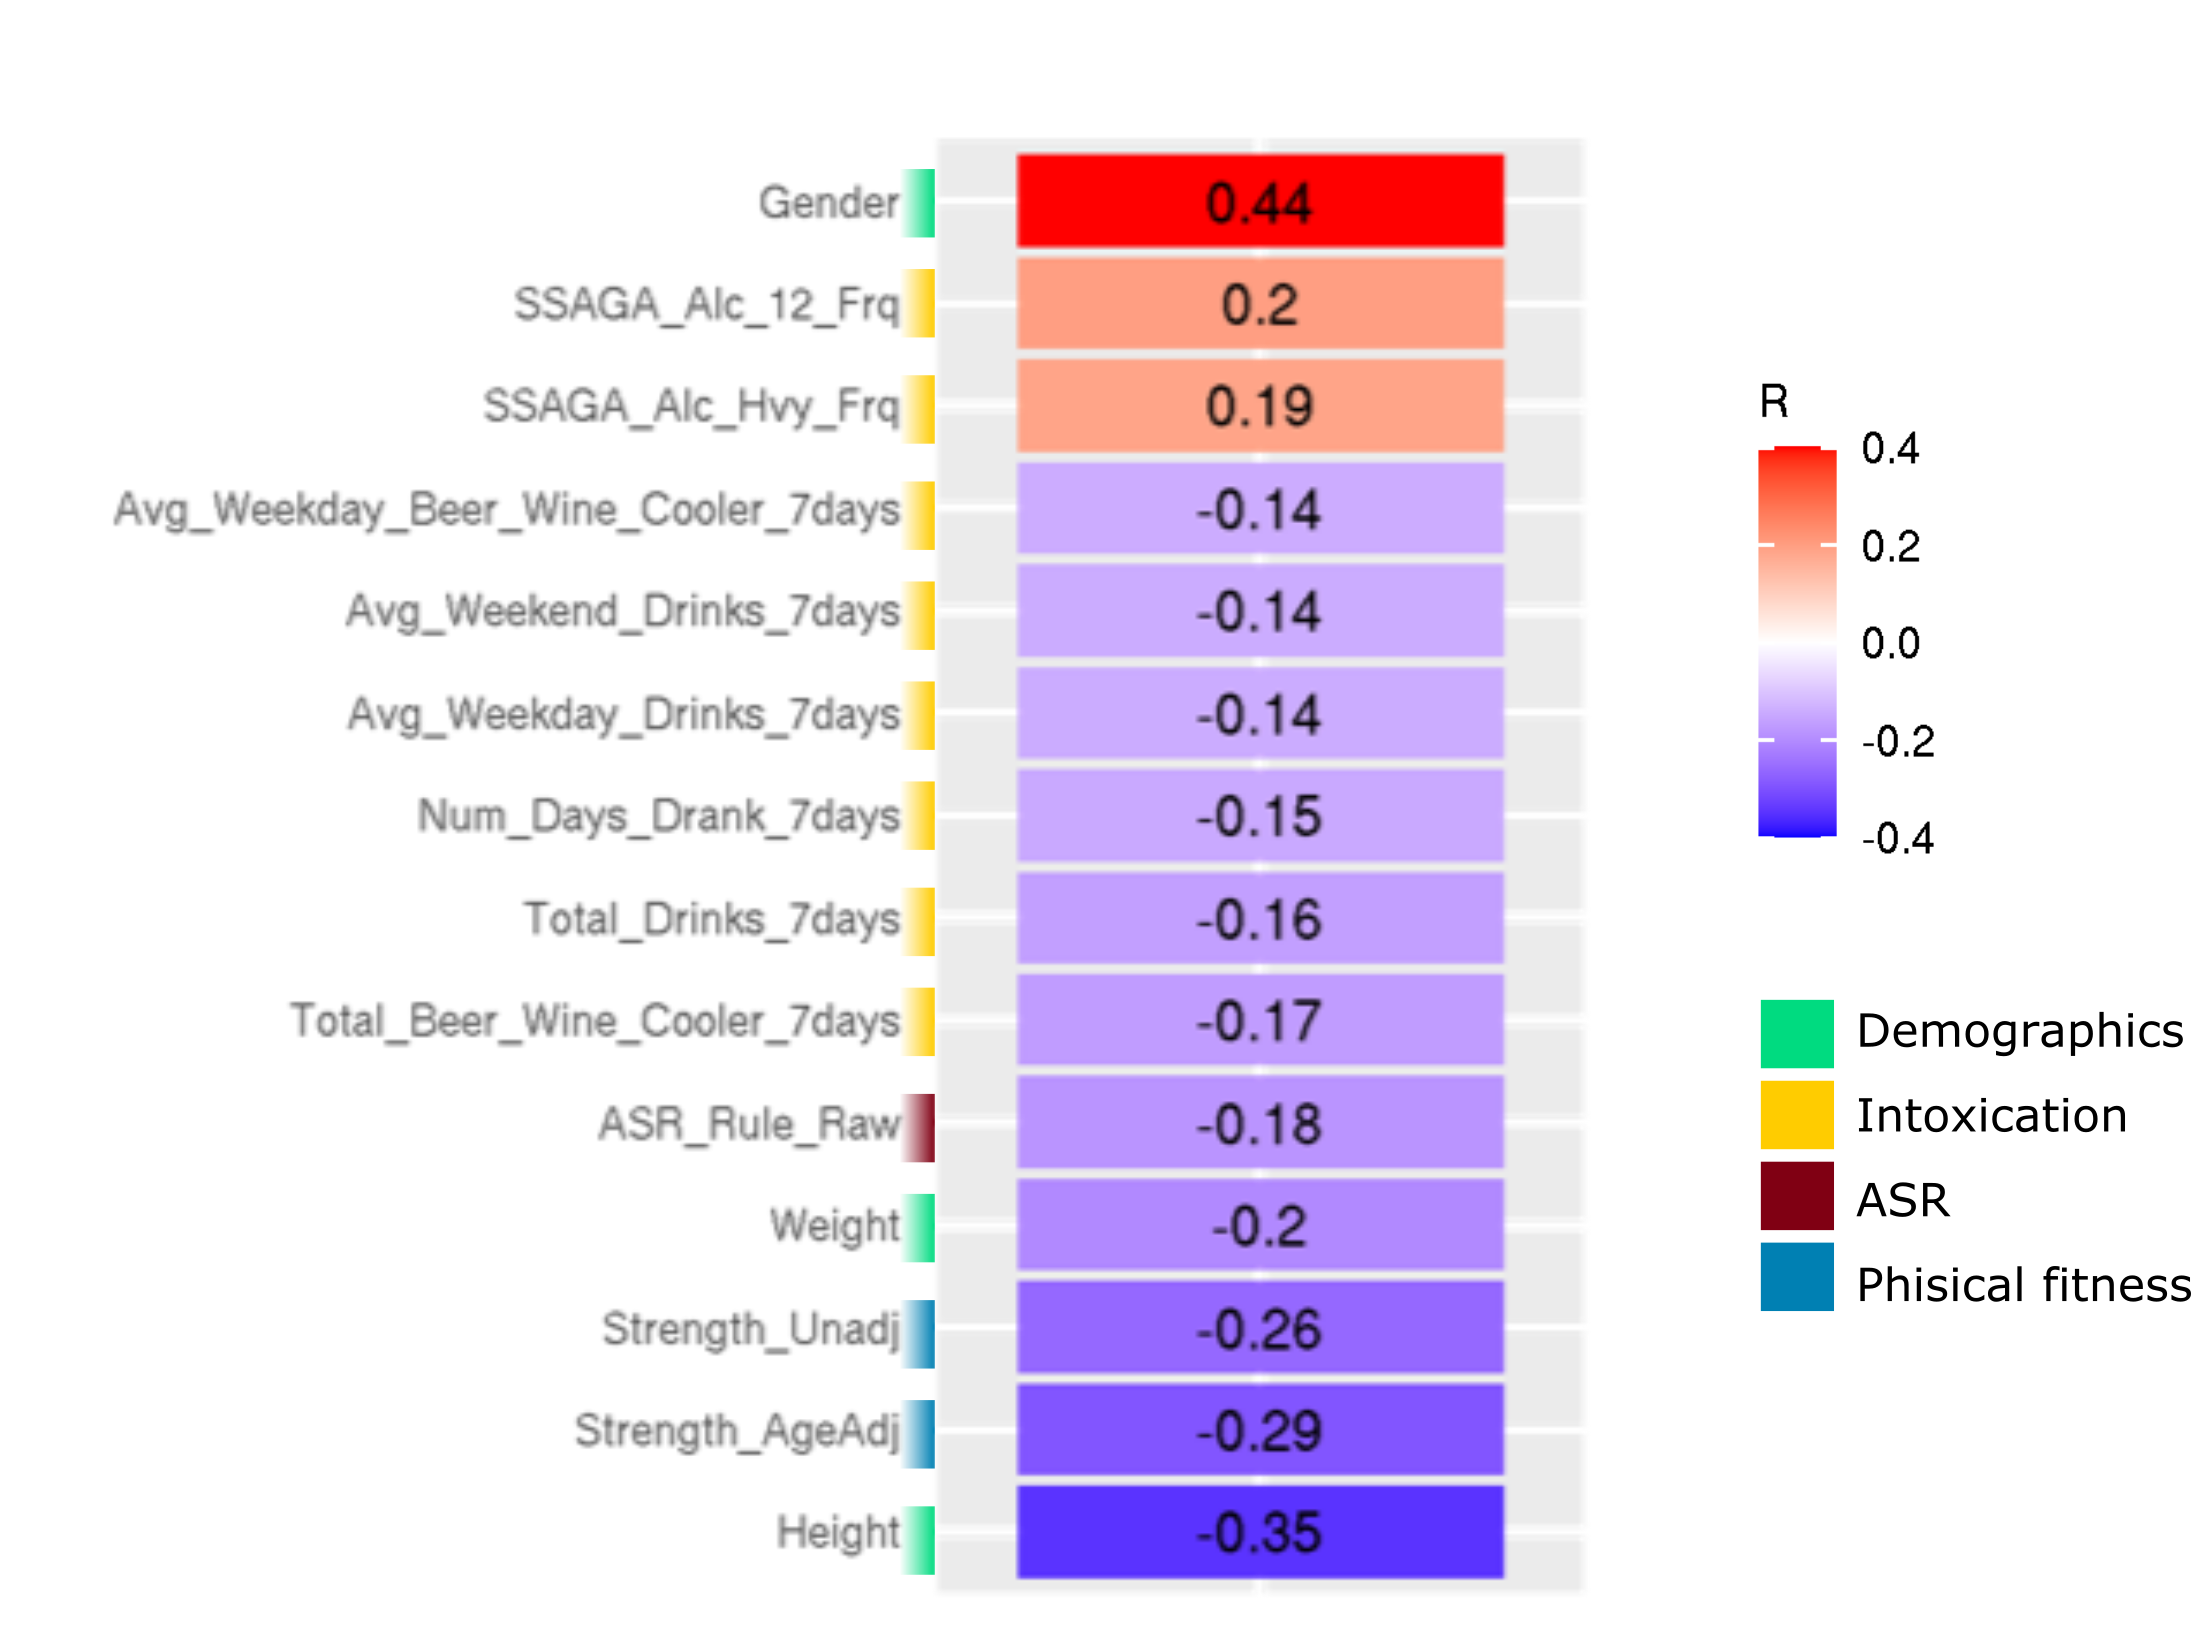
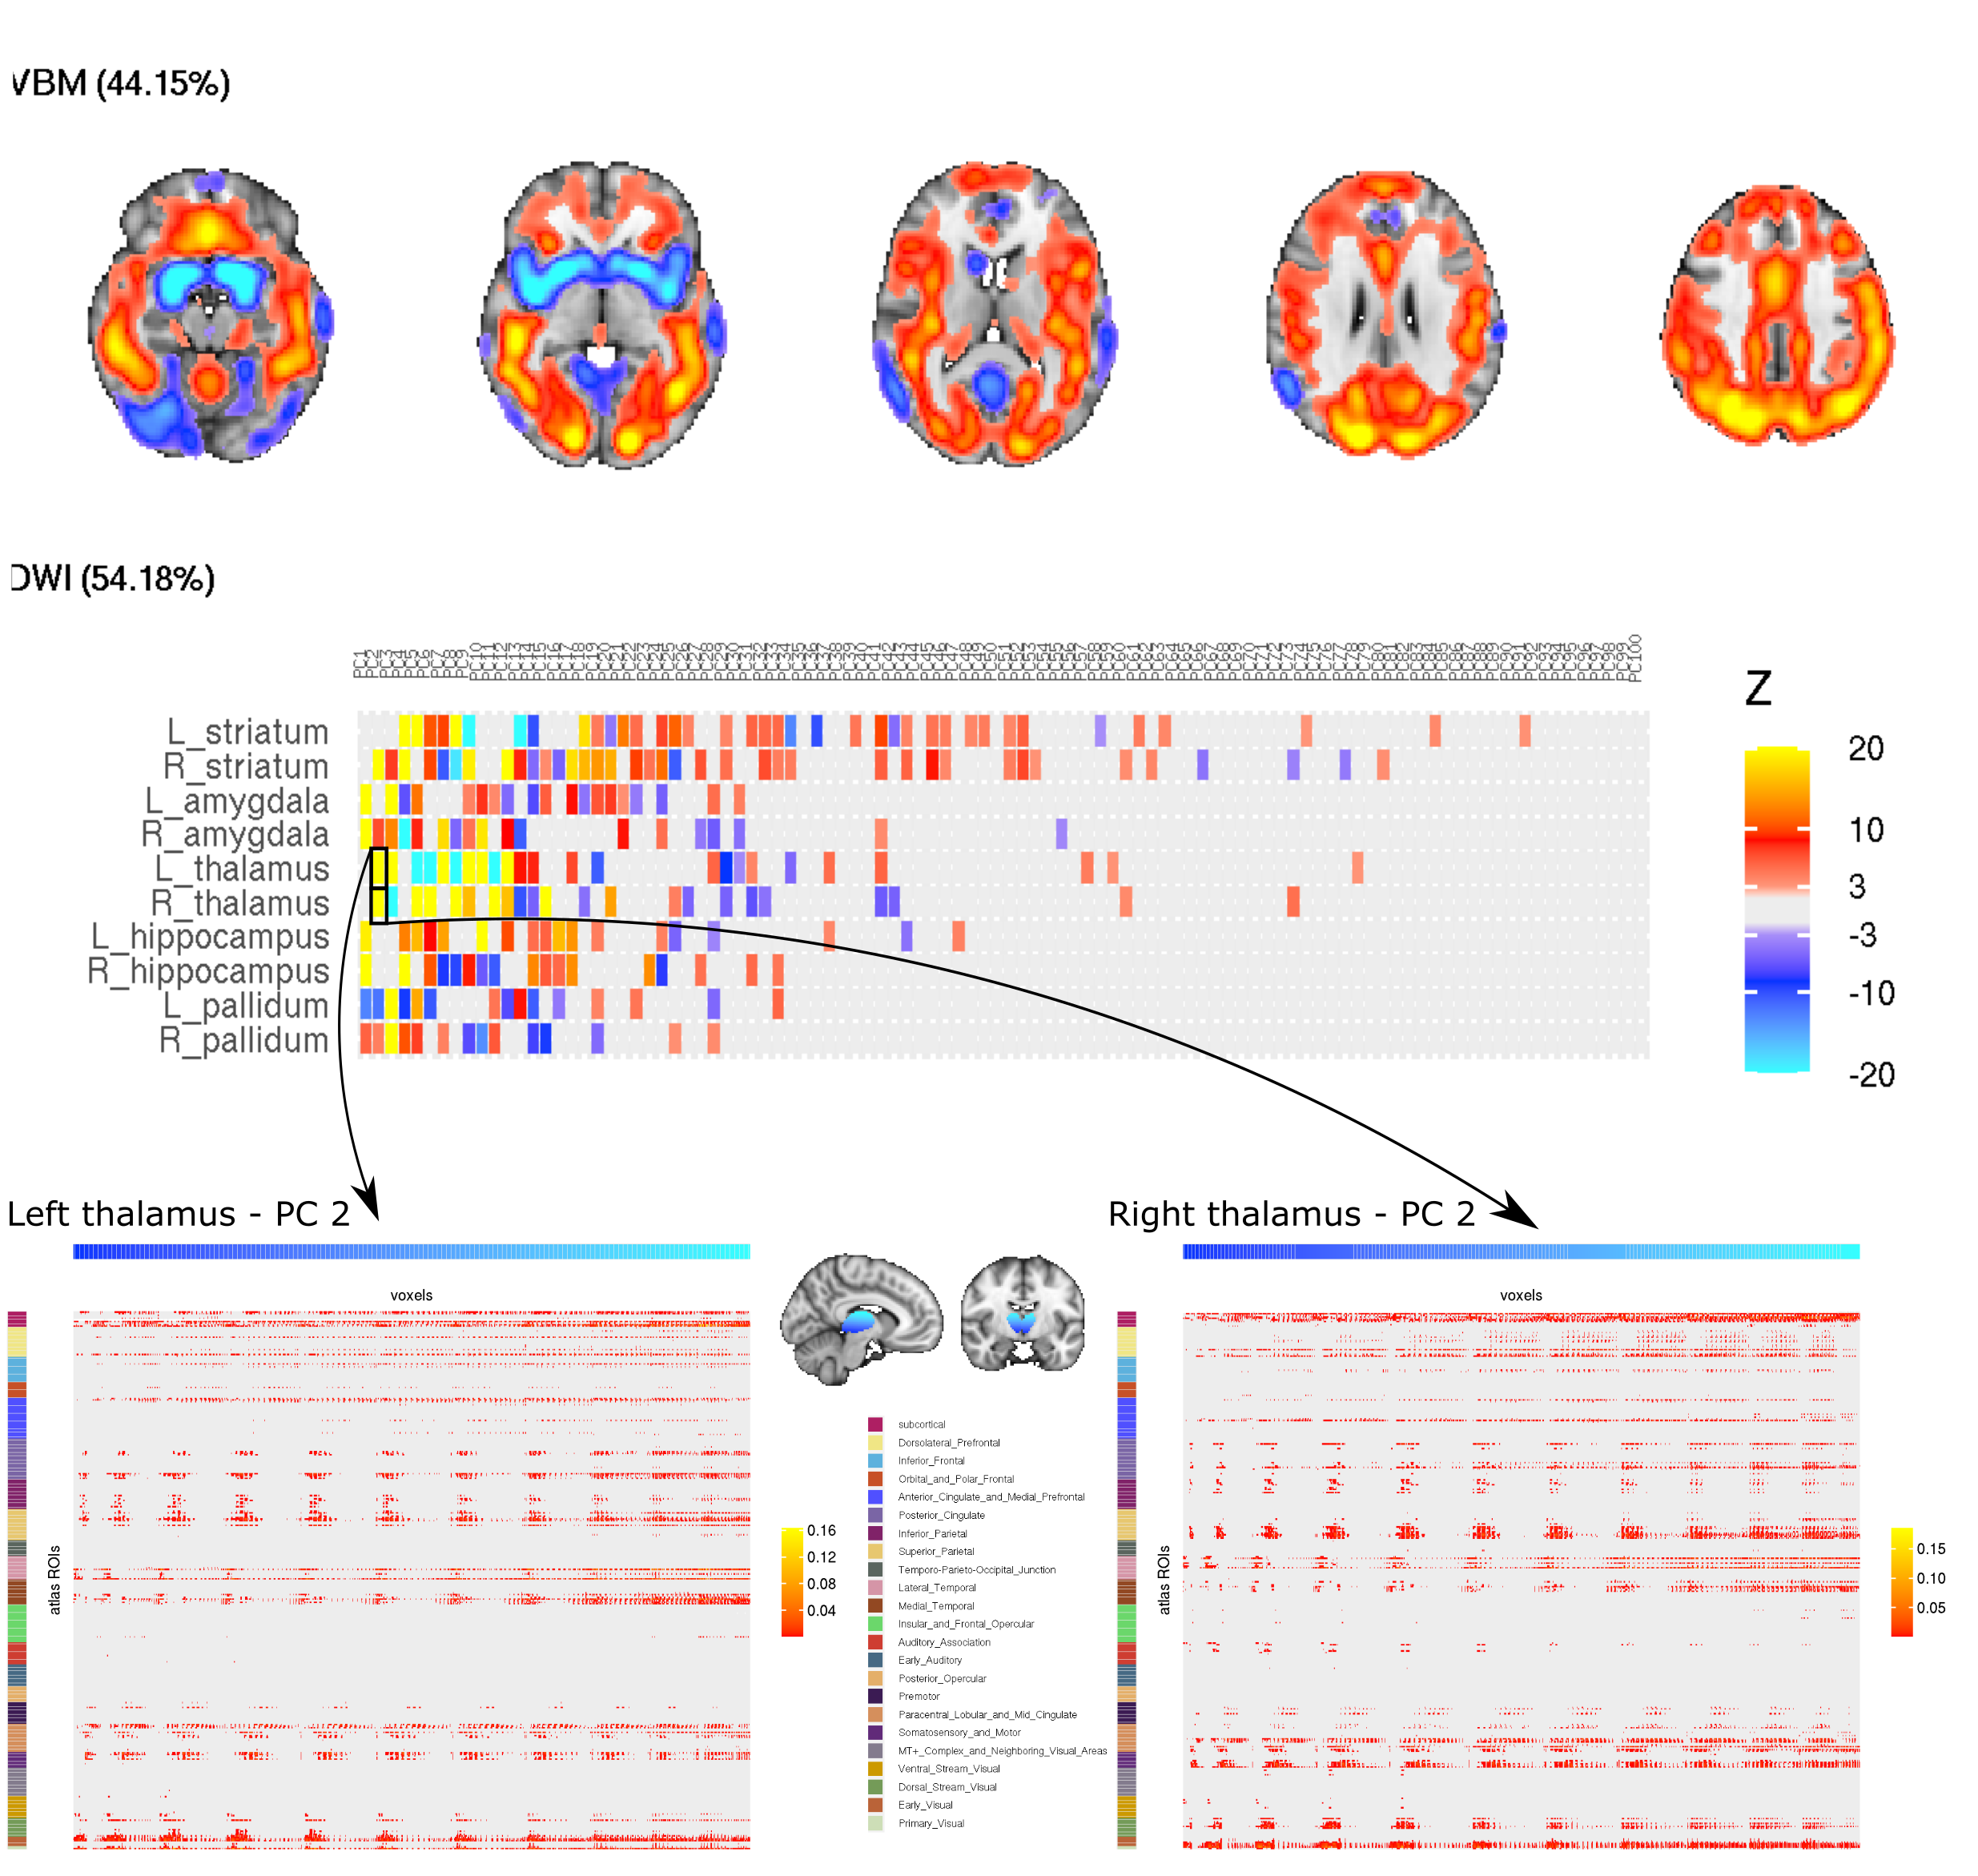
Multiple components were significantly associated with demographic/behavioural measures. The vast majority of components associated with behavioural measures were dominated by a combination of VBM and DWI modality contributions with fMRI data contributing little. Here we highlight 1 IC of interest; IC31 which showed significant associations with multiple demographic/behavioural measures including many related to alcohol consumption (Figure 2). Widespread higher cortical and cerebellar VBM density along with lower density in the striatum, amygdala, insular cortex and fusiform gyrus together contributed 44% to the IC (Figure 3). The remaining 54% was from subcortical DWI (Figure 3; highest peaks in the bilateral thalamus).Discussion
Here we partially replicated previous work2 showing multimodal brain phenotypes are associated with various behavioural measures. The deviations seen between studies are likely due to the differences in unimodal extraction and the restriction of DWI and fMRI analysis to select ROIs rather than whole brain analysis. Consistent with the previous study, fMRI data contributed little to the ICs associated with behavioural measures. Moreover, across all ICs there was little shared variance between functional and structural modalities.Conclusion
There is shared variance across different structural imaging modalities that relates to demographic and behavioural measures. Further analysis of the spatial patterns of multimodal ICs may reveal more about these inter-modality relationships.Acknowledgements
Data were provided by the Human Connectome Project, WU-Minn Consortium (Principal Investigators: David Van Essen and Kamil Ugurbil; 1U54MH091657) funded by the 16 NIH Institutes and Centers that support the NIH Blueprint for Neuroscience Research; and by the McDonnell Center for Systems Neuroscience at Washington UniversityReferences
1. Groves, A. R., Beckmann, C. F., Smith, S. M. & Woolrich, M. W. Linked independent component analysis for multimodal data fusion. Neuroimage 54, 2198–2217 (2011).
2. Llera, A., Wolfers, T., Mulders, P. & Beckmann, C. F. Inter-individual differences in human brain structure and morphology link to variation in demographics and behavior. Elife 8, (2019).
3. Glasser, M. F. et al. The minimal preprocessing pipelines for the Human Connectome Project. Neuroimage 80, 105–124 (2013).
4. Haak, K. V., Marquand, A. F. & Beckmann, C. F. Connectopic mapping with resting-state fMRI. Neuroimage 1–12 (2017).
5. Winkler, A. M., Ridgway, G. R., Webster, M. A., Smith, S. M. & Nichols, T. E. Permutation inference for the general linear model. Neuroimage 92, 381–397 (2014).
6. Benjamini, Y. & Hochberg, Y. Controlling the false discovery rate: A practical and powerful approach to multiple testing. J. R. Stat. Soc. 57, 289–300 (1995).
Figures