2470
Longitudinal changes in fMRI brain fingerprints of asymptomatic high school American football athletes1Elmore Family School of Electrical and Computer Engineering, Purdue University, West Lafayette, IN, United States, 2Warren Wright Adolescent Center, Department of Psychiatry and Behavioral Sciences, Feinberg School of Medicine, Northwestern University, Chicago, IL, United States, 3Department of Electrical and Computer Engineering, Rice University, Houton, TX, United States, 4Department of Mechanical Engineering, Boston University, Boston, MA, United States, 5School of Mechanical Engineering, Purdue University, West Lafayette, IN, United States, 6School of Industrial Engineering, Purdue University, West Lafayette, IN, United States, 7Purdue Institute for Integrative Neuroscience, Purdue University, West Lafayette, IN, United States, 8Department of Biomedical Engineering, University of Cincinnati, Cincinnati, OH, United States
Synopsis
We used resting state functional MRI data to investigate whether asymptomatic high school American football athletes undergo functional connectome (FC) changes during exposure to head acceleration events (HAEs). FCs of asymptomatic high school football athletes were shown to undergo significant changes during the season and then return to their pre-season state after the conclusion of collision activities, with changes reflected most profoundly in the somatomotor network. Late-season changes appear to affect all athletes without association with the magnitude of HAEs experienced. These observations demonstrate that participation in American football can cause significant changes in brain functionality without manifesting symptoms.
Introduction
Network analysis of resting state functional magnetic resonance imaging (rs-fMRI) data has been used to produce subject-specific functional connectomes (FCs)1-3. Measurement of self-identifiability (Iself) of individual FCs across repeated acquisitions (i.e. “brain fingerprints”) can be used to examine differences within and between subjects4-6. Here we investigate whether asymptomatic high school American football athletes undergo FC changes during a period of exposure to head acceleration events (HAEs). Further, we uncover which brain networks are affected by these changes and analyze the association between such changes and exposure to HAEs.Methods
62 male American football athletes were imaged once before the start of football-related contact activities (Pre), 0-4 weeks (In1) and 5-9 weeks (In2) after this start, and 4-8 weeks following the football season (Post); none were clinically diagnosed as concussed during the study period. 14 male high school Control athletes (non-collision) were imaged twice (Test, Retest; 5-18 weeks apart). In each session, a T1-weighted image (1mm isotropic) and a rs-fMRI scan (TR/TE = 2000/26ms; flip angle = 35°; 34 slices; FOV = 20 cm; 64x64 acquisition) were acquired. During contact activities, football athletes wore a head-mounted xPatch sensor (X2 Biosystems, Inc) which recorded peak linear acceleration (PLA) of HAEs.All rs-fMRI data were processed6 using AFNI7 and FSL8,9. Data for 42 football athletes remained after pre-processing quality checks. Data were divided into 278 regions of interest (ROIs) using an atlas10, with 30 cerebellum ROIs discarded due to inconsistent FOV coverage. FCs (248x248 symmetric matrices) were computed, in which entries represented pairwise correlations of the average rs-fMRI timeseries of 248 ROIs.
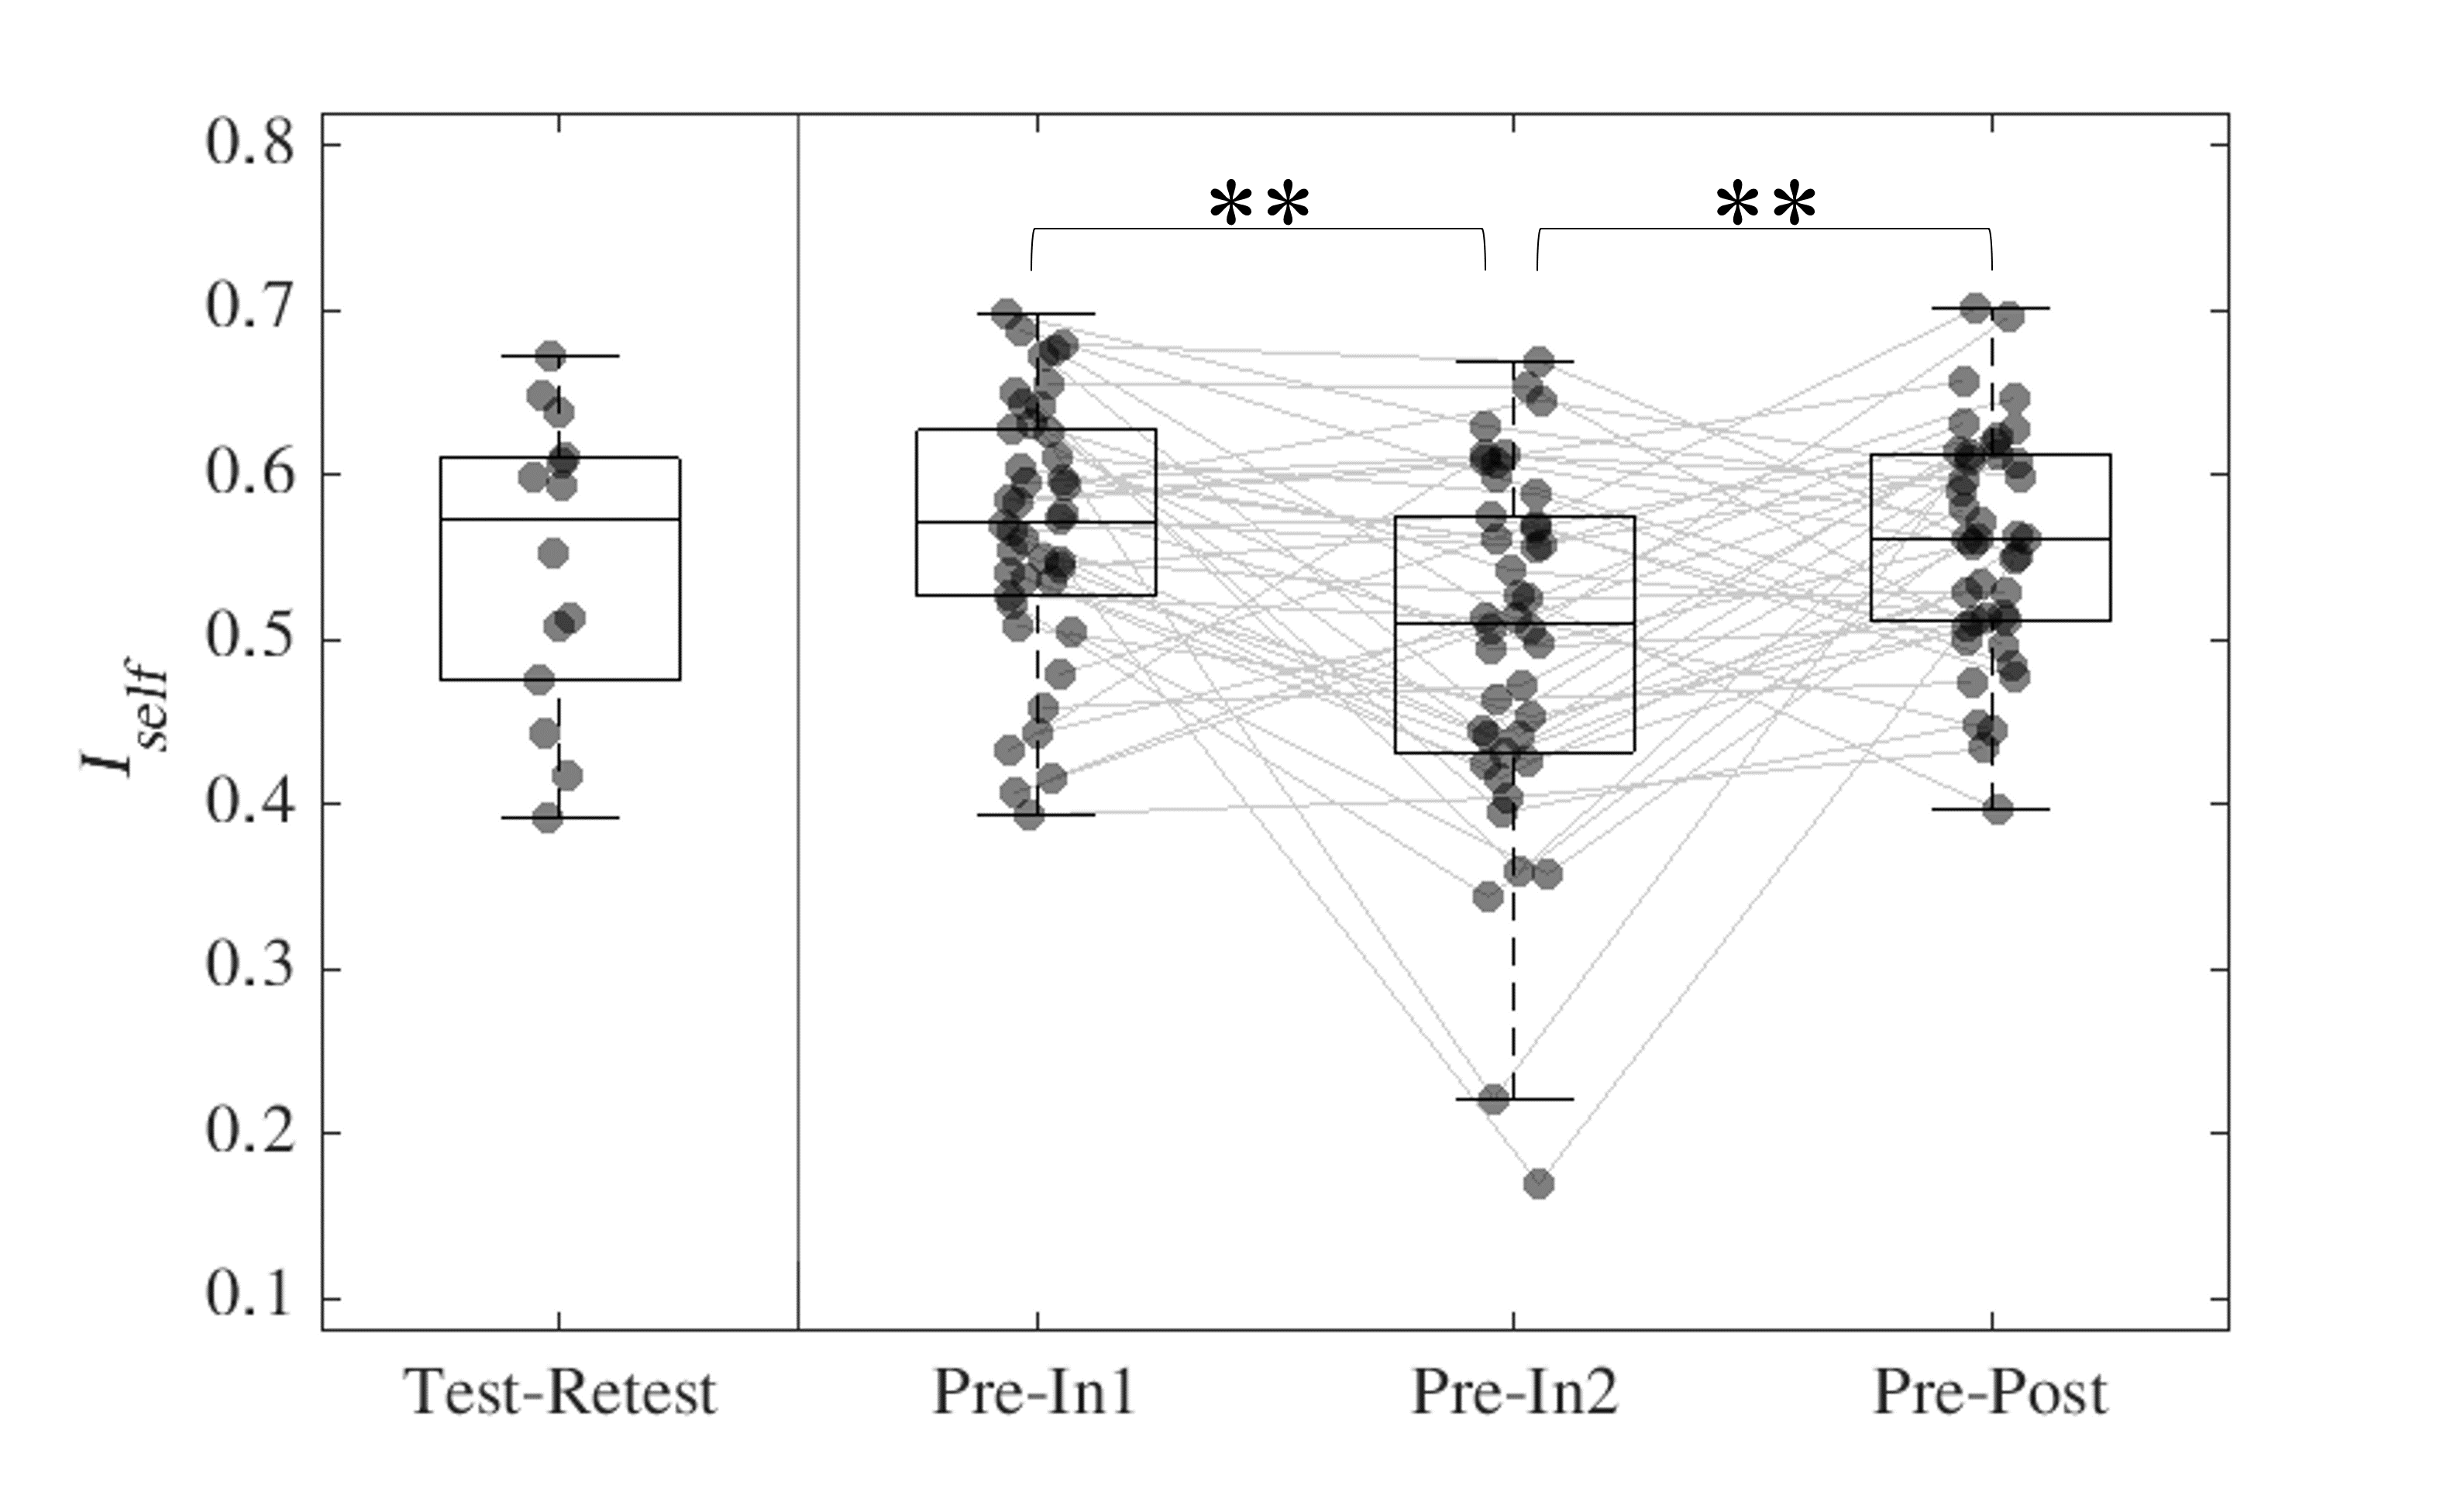
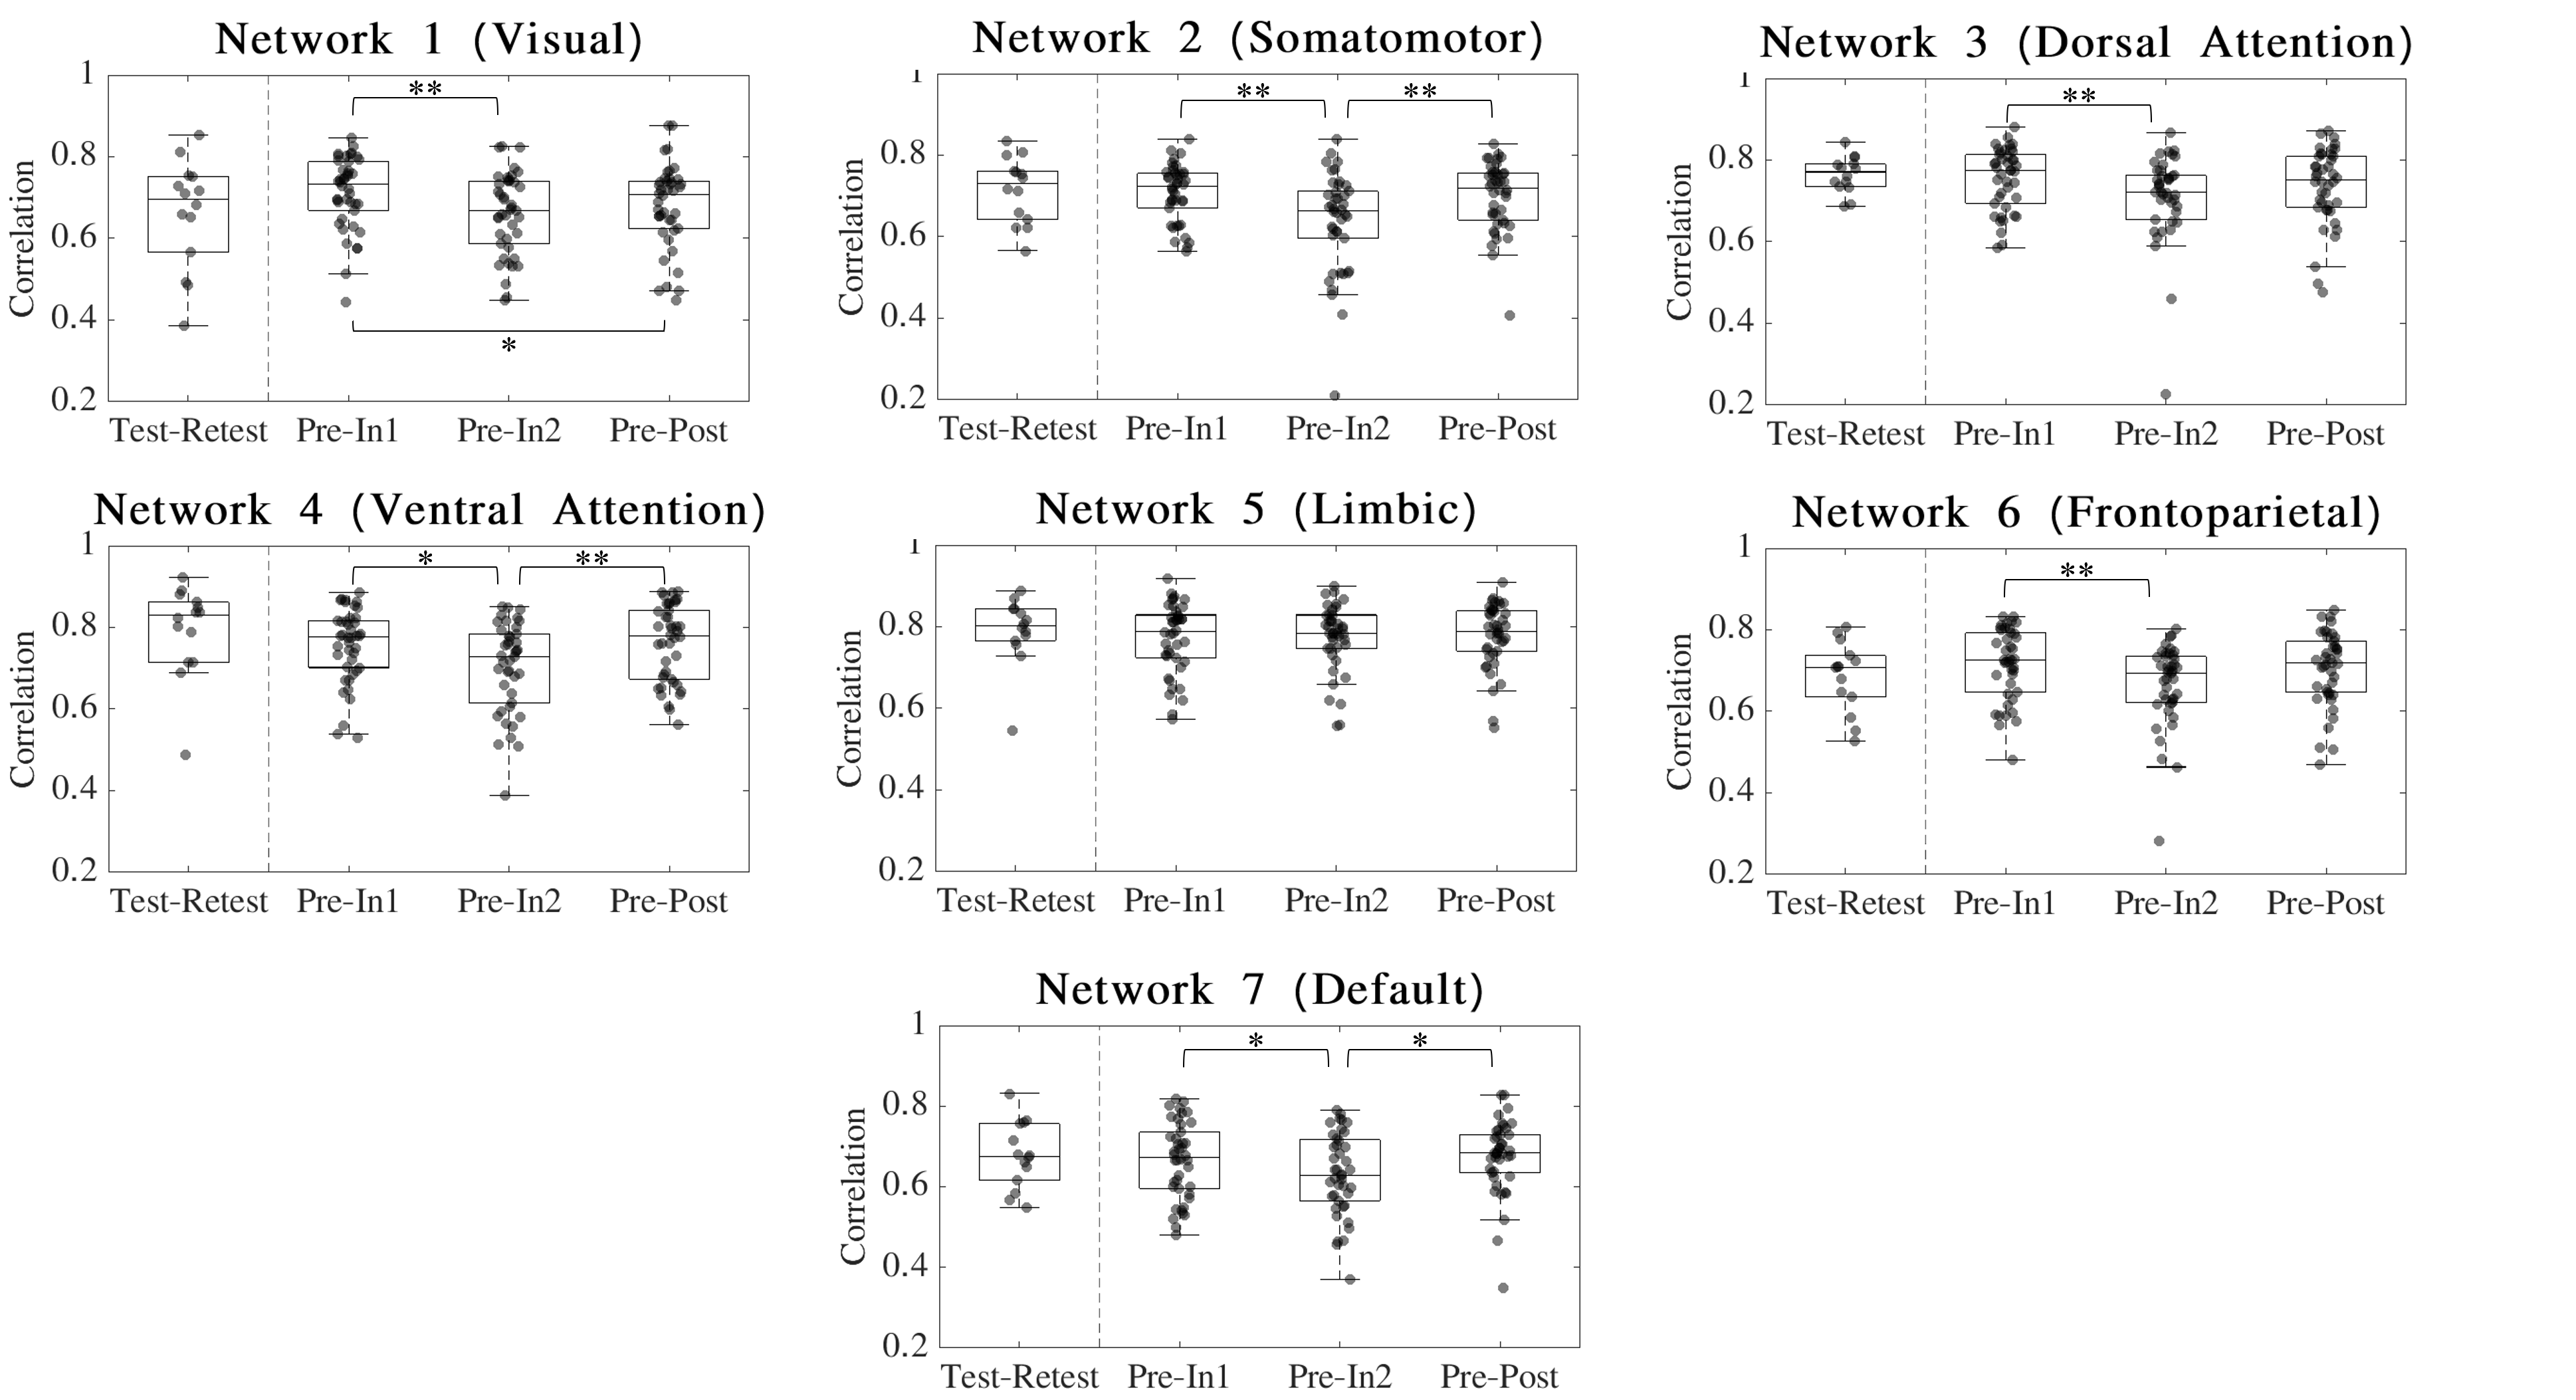
Iself for sessions (In1, In2 and Post) was computed as the Pearson’s correlation between same-subject FCs with Pre. Iself distributions comparing Pre with the remaining three sessions were tested for differences using Friedman and Wilcoxon signed rank tests with Bonferroni multiple comparisons correction (Figure 1). FCs were also recomputed such that only ROIs corresponding to each of the seven brain networks described in Yeo et al.11 were included and subsequent Iself metrics were computed for each brain network.
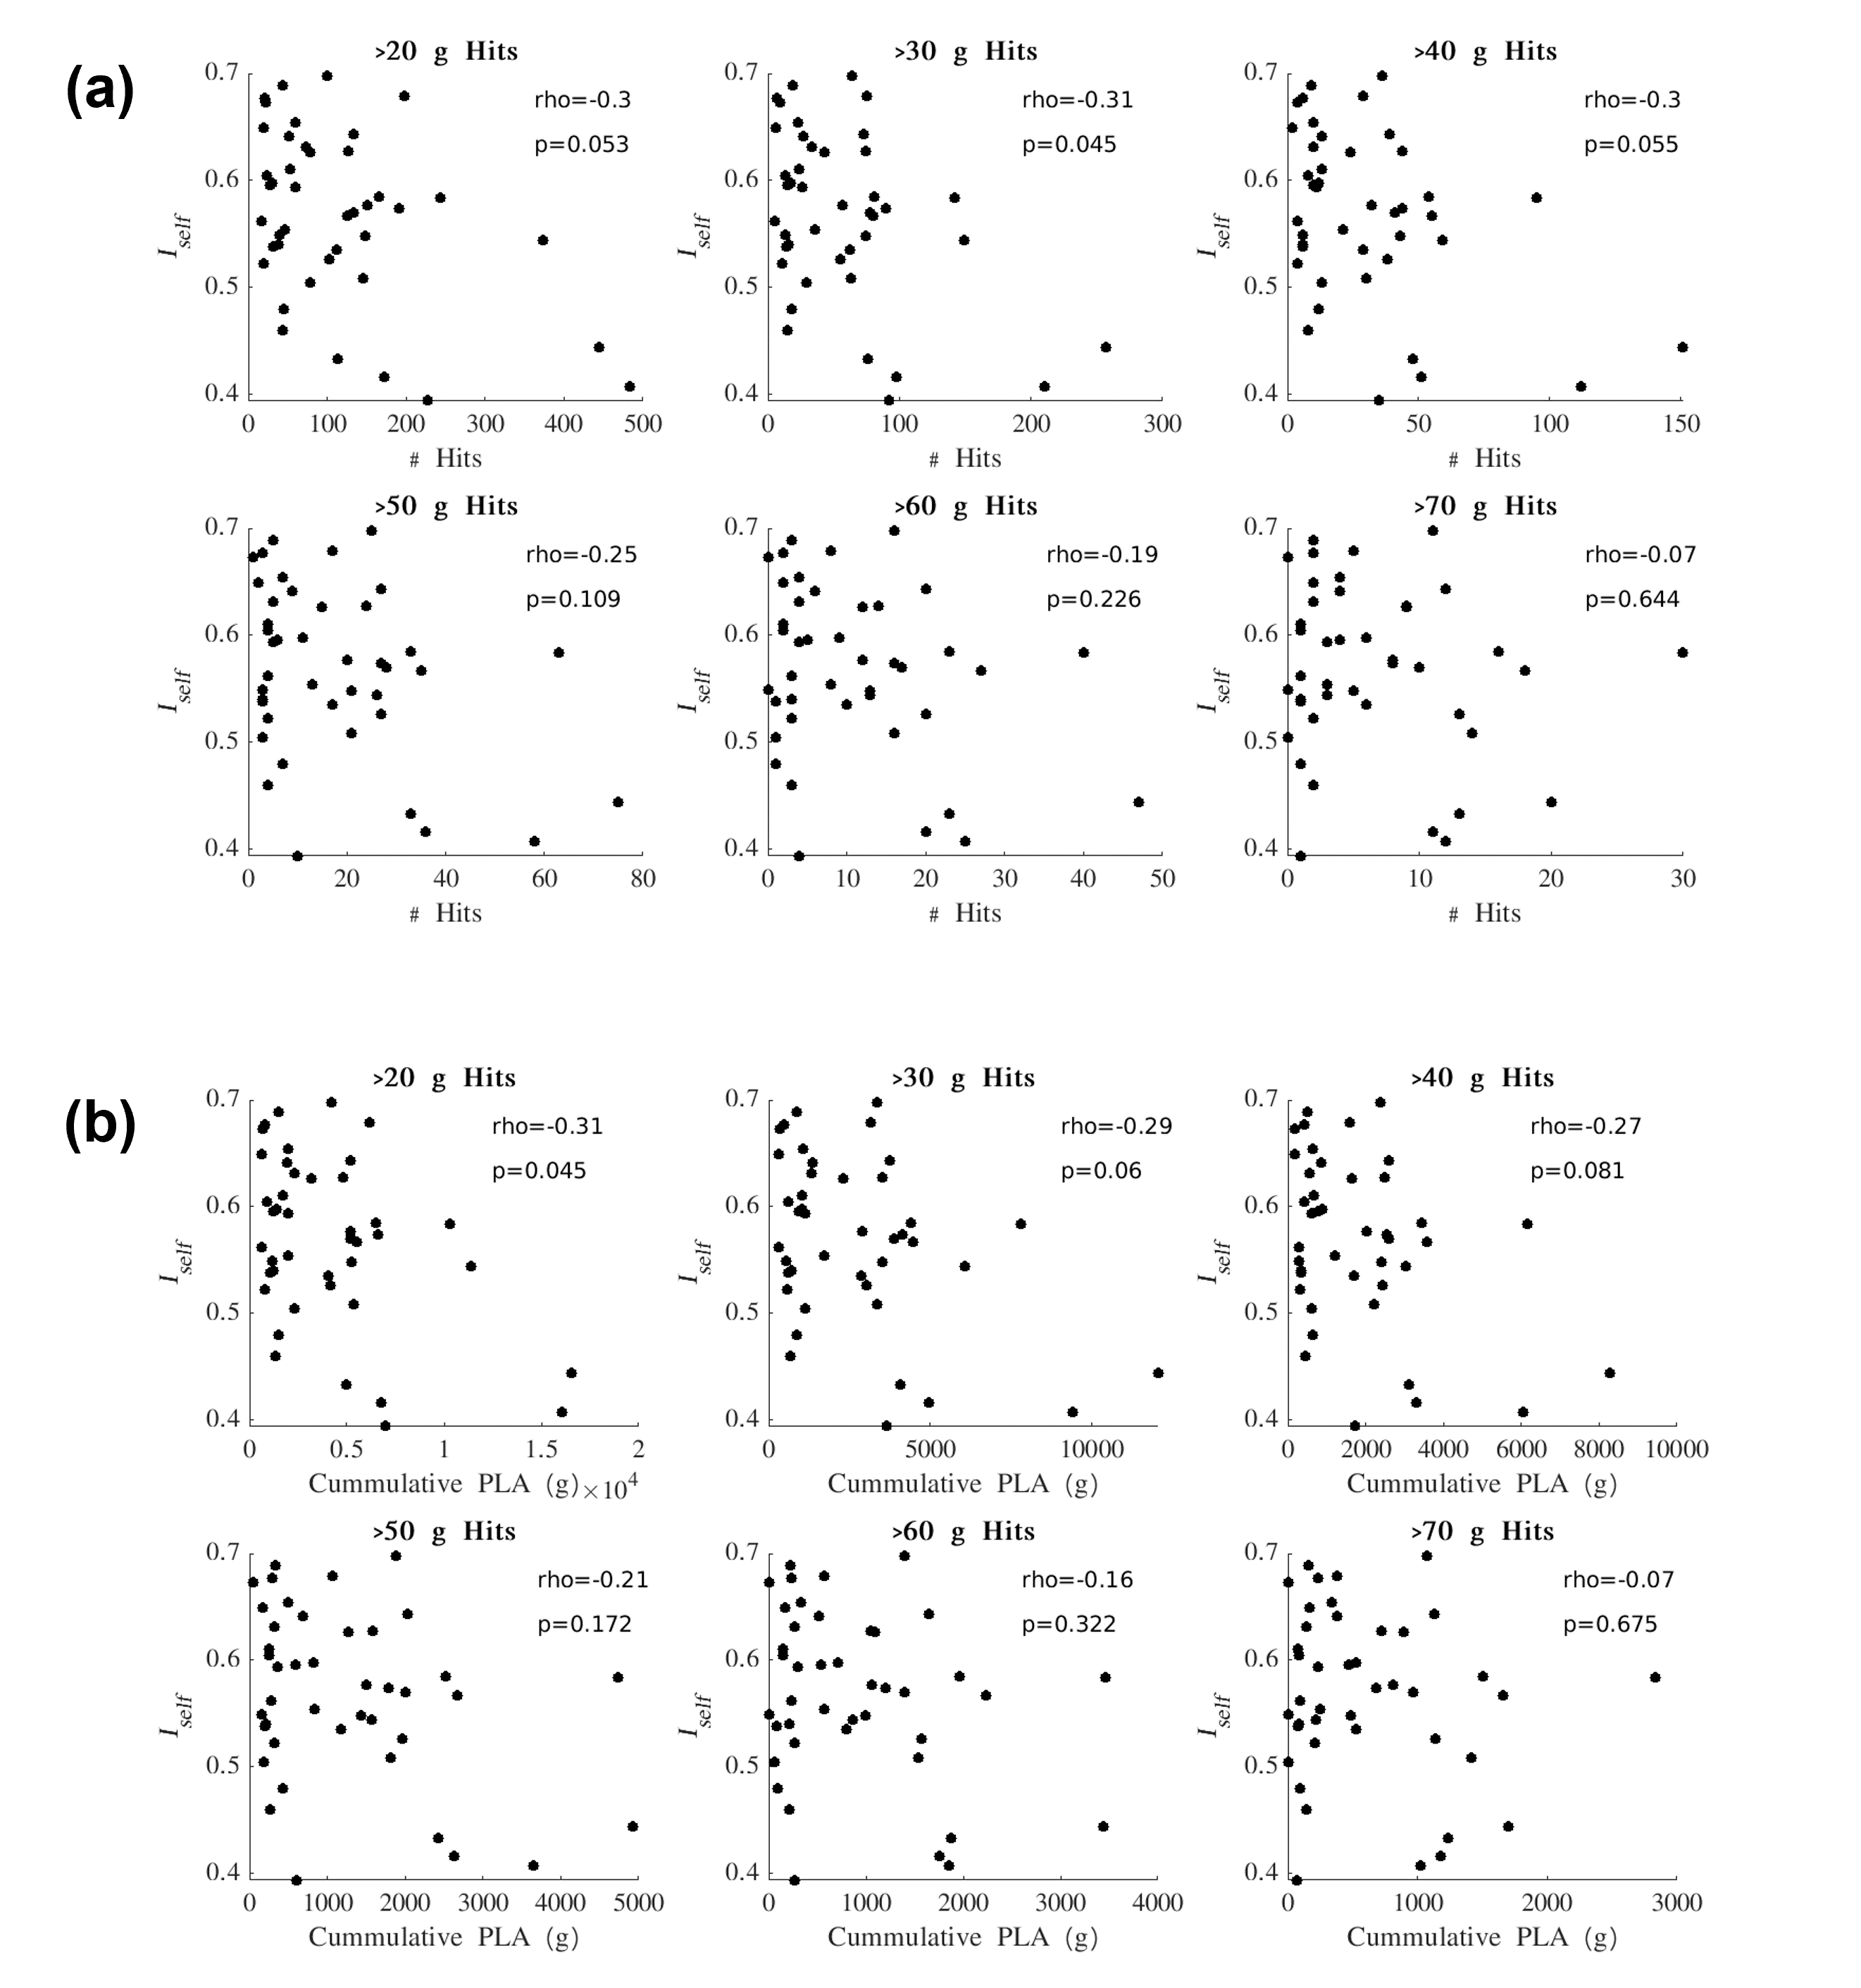
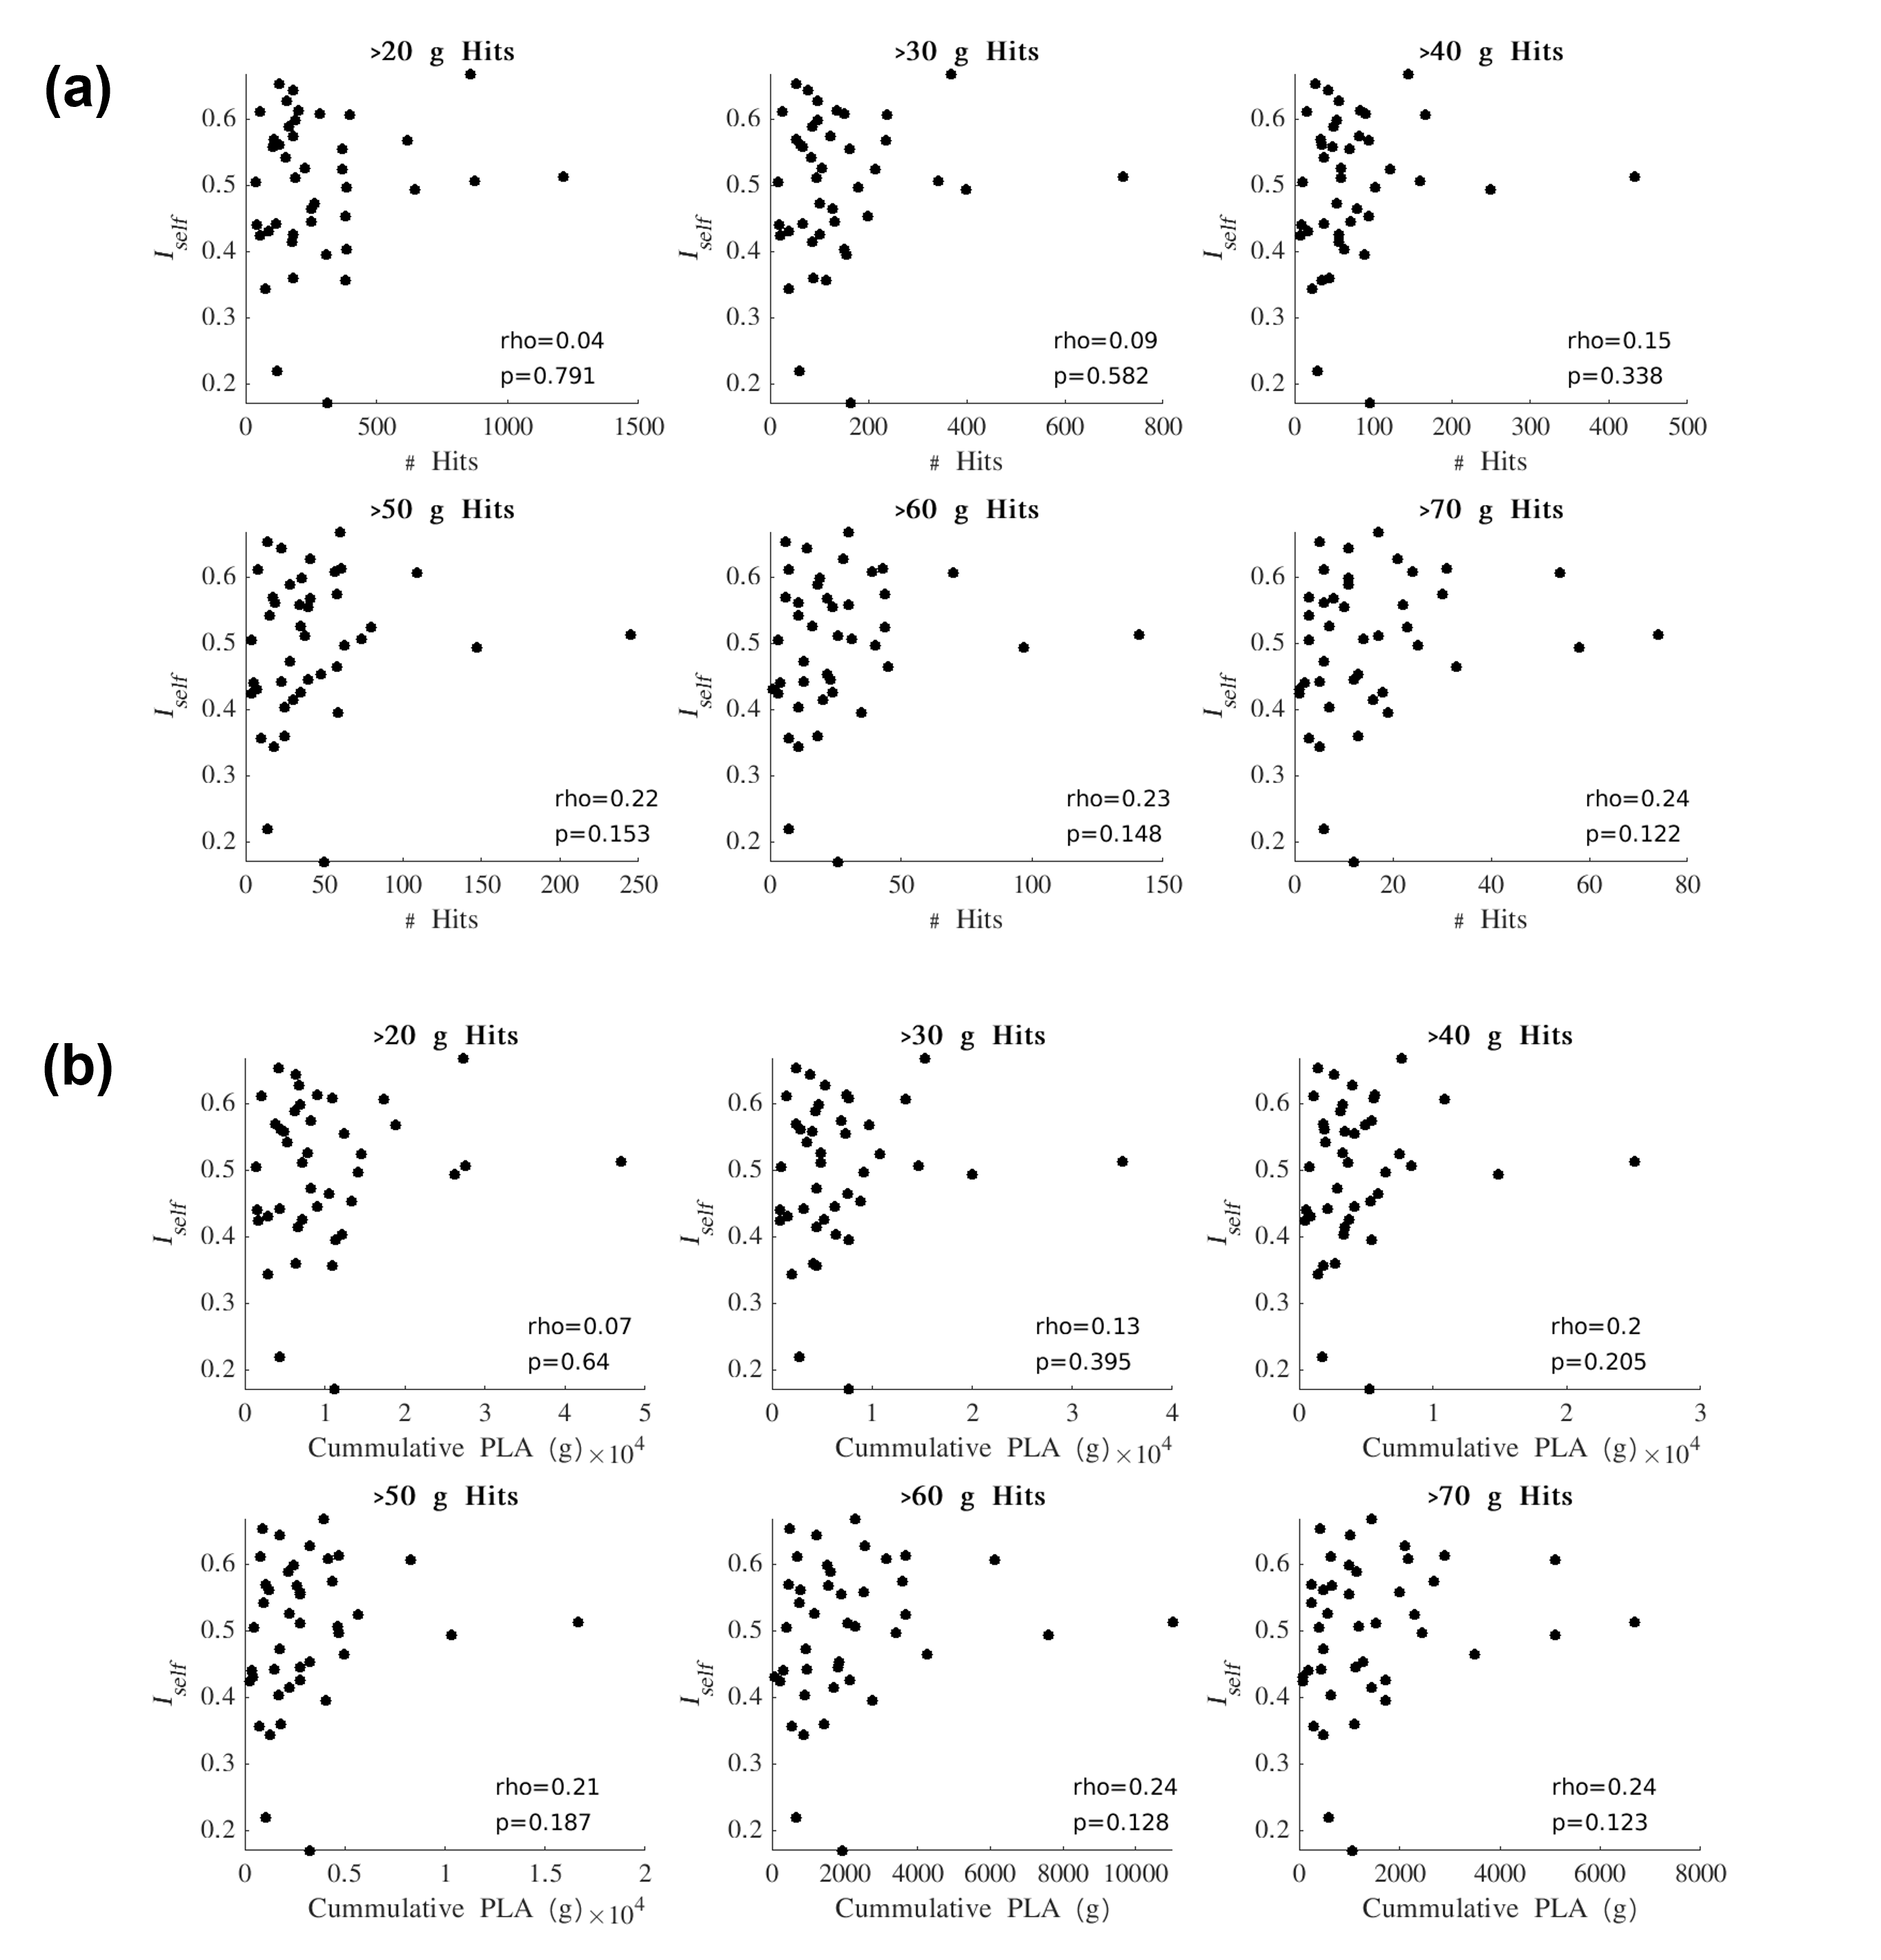
Iself values from the Pre-In1 comparison were tested for correlation with (1) the total number of HAEs experienced before In1 and (2) the cumulative PLA of HAEs experienced before In1. Spearman’s correlation tests were conducted using PLA thresholds for HAE inclusion/exclusion (Figure 3). Similarly, Iself values from the Pre-In2 comparison were tested for correlation with all HAEs experienced before In2 (Figure 4).
Results
For Iself distributions (Figure 1), Friedman testing revealed a statistically significant difference in the medians (p=0.0234). Post-hoc Wilcoxon signed rank testing revealed significant differences between Pre-In1 and Pre-In2 as well as Pre-In2 and Pre-Post medians (p=0.0017 and p=0.0073, respectively). Iself distributions for each brain network are displayed in Figure 2 along with indications of significant differences between network distributions.Scatterplots of Pre-In1 and Pre-In2 Iself values against varying thresholds of HAEs are displayed in Figures 3 and 4, respectively. A significant negative correlation was found between (1) Pre-In1 Iself and the number of HAEs experienced before In1 with PLA exceeding 30g (Spearman’s rho=-0.31, p=0.045) and (2) Pre-In1 Iself and the cumulative PLA of HAEs experienced before In1 with PLA above 20g (Spearman’s rho=-0.31, p=0.045). No significant correlations were found between Pre-In2 Iself and HAEs occurring before In2.
Discussion
Pre-In2 yielded a significantly downward-shifted distribution compared to Pre-In1 and Pre-Post. This indicates that, relative to Pre, the functional fingerprint of football athletes’ brains significantly changed by the time of In2 yet was largely recovered at Post, several weeks after collision activities had stopped. The same pattern occurred most strongly in the somatomotor network and also appeared in others such as the default mode and ventral attention networks, while such changes are not reflected in the limbic network. This is consistent with previous research reporting similar network changes associated with collision sports participation12. Additionally, the motor cortex has been linked with neurometabolic impairment in athletes who sustained sports-related concussions13.Despite the downward shift in Iself in Pre-In2, the Iself values observed here showed no clear correlation with the number, or total magnitude, of HAEs experienced prior to In2. Significant associations were only found between Pre-In1 Iself with low PLA thresholds of HAEs prior to In1. This may indicate that the degree of change in brain functional fingerprints are associated with the number of HAEs acquired early in the season, but this association is lost once a certain number of HAEs is reached, after which Iself stops decreasing in asymptomatic athletes. A lower bound to Iself in asymptomatic athletes is expected, as a greater decrease in Iself would likely be associated with a higher likelihood for symptoms and clinical diagnosis of injury.
Conclusion
FCs of asymptomatic high school football athletes were shown to undergo significant changes during the season and then return to their Pre-season state after the conclusion of collision activities, with changes reflected most profoundly in the somatomotor network. Late-season changes appear to affect all athletes without association with the magnitude of HAEs experienced. These observations demonstrate that participation in American football can cause significant changes in brain functionality without manifesting symptoms in athletes.Acknowledgements
This research was funded in part by a grant from the Allied Milk Producers.References
[1] Bullmore, E. & Sporns, O. (2009), ‘Complex brain networks: graph theoretical analysis of structural and functional systems,’ Nature Reviews Neuroscience, 10(3), 186-198.
[2] Rubinov, M. & Sporns, O. (2010), ‘Complex network measures of brain connectivity: uses and interpretations,’ Neuroimage, 52(3), 1059-1069.
[3] Sporns, O. (2014), ‘Contributions and challenges for network models in cognitive neuroscience,’ Nature neuroscience, 17(5), 652-660.
[4] Finn, E. S. et al. (2015), ‘Functional connectome fingerprinting: identifying individuals using patterns of brain connectivity’, Nature Neuroscience, 18, 1664-1671.
[5] Amico, E. & Goñi, J. (2018), ‘The quest for identifiability in human functional connectomes’, Scientific Reports, 8, 8254.
[6] Bari, S. et al. (2019), ‘Uncovering multi-site identifiability based on resting state functional connectomes’, NeuroImage, 202, 115967.
[7] Cox, R.W. (1996), ‘AFNI: Software for analysis and visualization of functional magnetic resonance neuroimages’, Computers and Biomedical Research, 29(3), 162-173.
[8] Jenkinson, M. et al. (2012), ‘FSL’, NeuroImage, 62(2), 782-790.
[9] Smith, S. M. (2002). ‘Fast robust automated brain extraction,’ Human Brain Mapping, 17(3), 143-155.
[10] Shen, X. et al. (2013). ‘Groupwise whole-brain parcellation from resting-state fMRI data for network node identification’, Neuroimage, 82, 403-415.
[11] Yeo, B.T.T., et al. (2011), ‘The organization of the human cerebral cortex estimated by intrinsic functional connectivity,’ Journal of Neurophysiology. 106, 1125–1165.
[12] Bari, S. et al. (2021), ‘Integrating multi-omics with neuroimaging and behavior: A preliminary model of dysfunction in football athletes’, Neuroimage: Reports, 1(3), 100032.
[13] L. C. Henry et al. (2011), ‘Metabolic changes in concussed American football players during the acute and chronic post-injury phases,’ BMC Neurology, 11, 105.
Figures