2466
On the water–fat in-phase assumption for quantitative susceptibility mapping (QSM)1Department of Diagnostic and Interventional Radiology, School of Medicine, Klinikum Rechts der Isar, Technical University of Munich, Munich, Germany, 2Philips Research, Hamburg, Germany, 3Philips GmbH Market DACH, Hamburg, Germany
Synopsis
Gradient echo imaging using in-phase echoes has been proposed to reduce the field-map estimation in water–fat regions to a convex nonlinear least squares problem. Conventionally, the in-phase assumption is based on a single-peak fat-model. However, fat is known to have a complex spectrum rendering the definition of in-phase echo times problematic. In this work, the single-fat-peak in-phase assumption is replaced by a multi-peak effective in-phase assumption. QSM based on multi-peak in-phase echo times is shown to yield similar results to water–fat imaging based field- and susceptibility-mapping in a simulation and in vivo in the spine and the breast.
Introduction
Quantitative susceptibility mapping (QSM)1 has been applied in$$$\;$$$tissues outside the brain, e.g.$$$\;$$$to distinguish osteolytic/osteoblastic bone changes in the spine2, to characterize lesions and calcifications in breast disease1,3, to measure bone density4,5 or liver iron overload6,7,8.Gradient-echo imaging using only in-phase echoes has been proposed for$$$\;$$$the estimation of susceptibility in the body9. Forthe definition of in-phase echo times a single-peak fat-model is$$$\;$$$assumed. When using in-phase echo times, the signal model is$$$\;$$$convex within the period of the phasor and thus the field-map can robustly be$$$\;$$$estimated using nonlinear least squares techniques. However, the$$$\;$$$fat spectrum is$$$\;$$$known to$$$\;$$$be spectrally complex rendering the definition of in-phase echo$$$\;$$$times problematic. Furthermore, it has$$$\;$$$been shown that QSM using single-fat-peak based in-phase echoes can$$$\;$$$introduce significant quantification bias10. In$$$\;$$$this work the correlation between field-map estimation bias and susceptibility bias$$$\;$$$is investigated first in$$$\;$$$general, and$$$\;$$$then specifically for$$$\;$$$the single-peak in-phase assumption. Furthermore the$$$\;$$$use of$$$\;$$$a multi-peak fat-model effective in-phase echoes is$$$\;$$$proposed and$$$\;$$$tested in-silico and in-vivo in the spine and the breast.
Methods
Multi-peak effective in-phase echo timesThe multi-peak signal model reads:$$\boldsymbol{s}(t_n)=\left(\rho_W+c_n\rho_F\right)e^{\gamma{t_n}},\quad\gamma=i2\pi{f_B}-R_2^*\\c_n=\sum_{p=1}^{P}a_p e^{i2\pi\Delta{f_p}t_n},\quad\text{with}\quad\sum_{p=1}^{P}a_p=1,$$ where $$$t_1,t_2,...,t_N$$$ different echo times,$$$\;f_B$$$ field-map,$$$\;\rho_W\;$$$and $$$\rho_F$$$ complex signal of$$$\;$$$the water and fat components with$$$\;$$$an equal transverse relaxation rate$$$\;{R}_2^*$$$. The$$$\;$$$fat spectrum is$$$\;$$$assumed to have $$$P$$$ spectral peaks with corresponding relative amplitudes $$$a_p\;$$$and chemical shift $$$\Delta f_p$$$.$$$\;$$$For the definition of$$$\;$$$in-phase echo times, only one spectral peak $$$P=1\;$$$is assumed. Thus, water and$$$\;$$$fat are in-phase when$$$\;$$$the fat-phasor is zero and$$$\;$$$the condition $$$\Delta{f}\cdot{t=n},\;n\in\mathbf{N}$$$ is$$$\;$$$met. In$$$\;$$$the case$$$\;$$$of multiple fat-peaks in-phase echo times generally do$$$\;$$$not exist. However, effective in-phase echoes do$$$\;$$$exist meaning the timepoints, where the fatphasor is $$$\angle{c_{n}}=0$$$. The effective multi-peak in-phase echo times are generally not equidistant and change with the employed fat-model.
Single Voxel Simulation
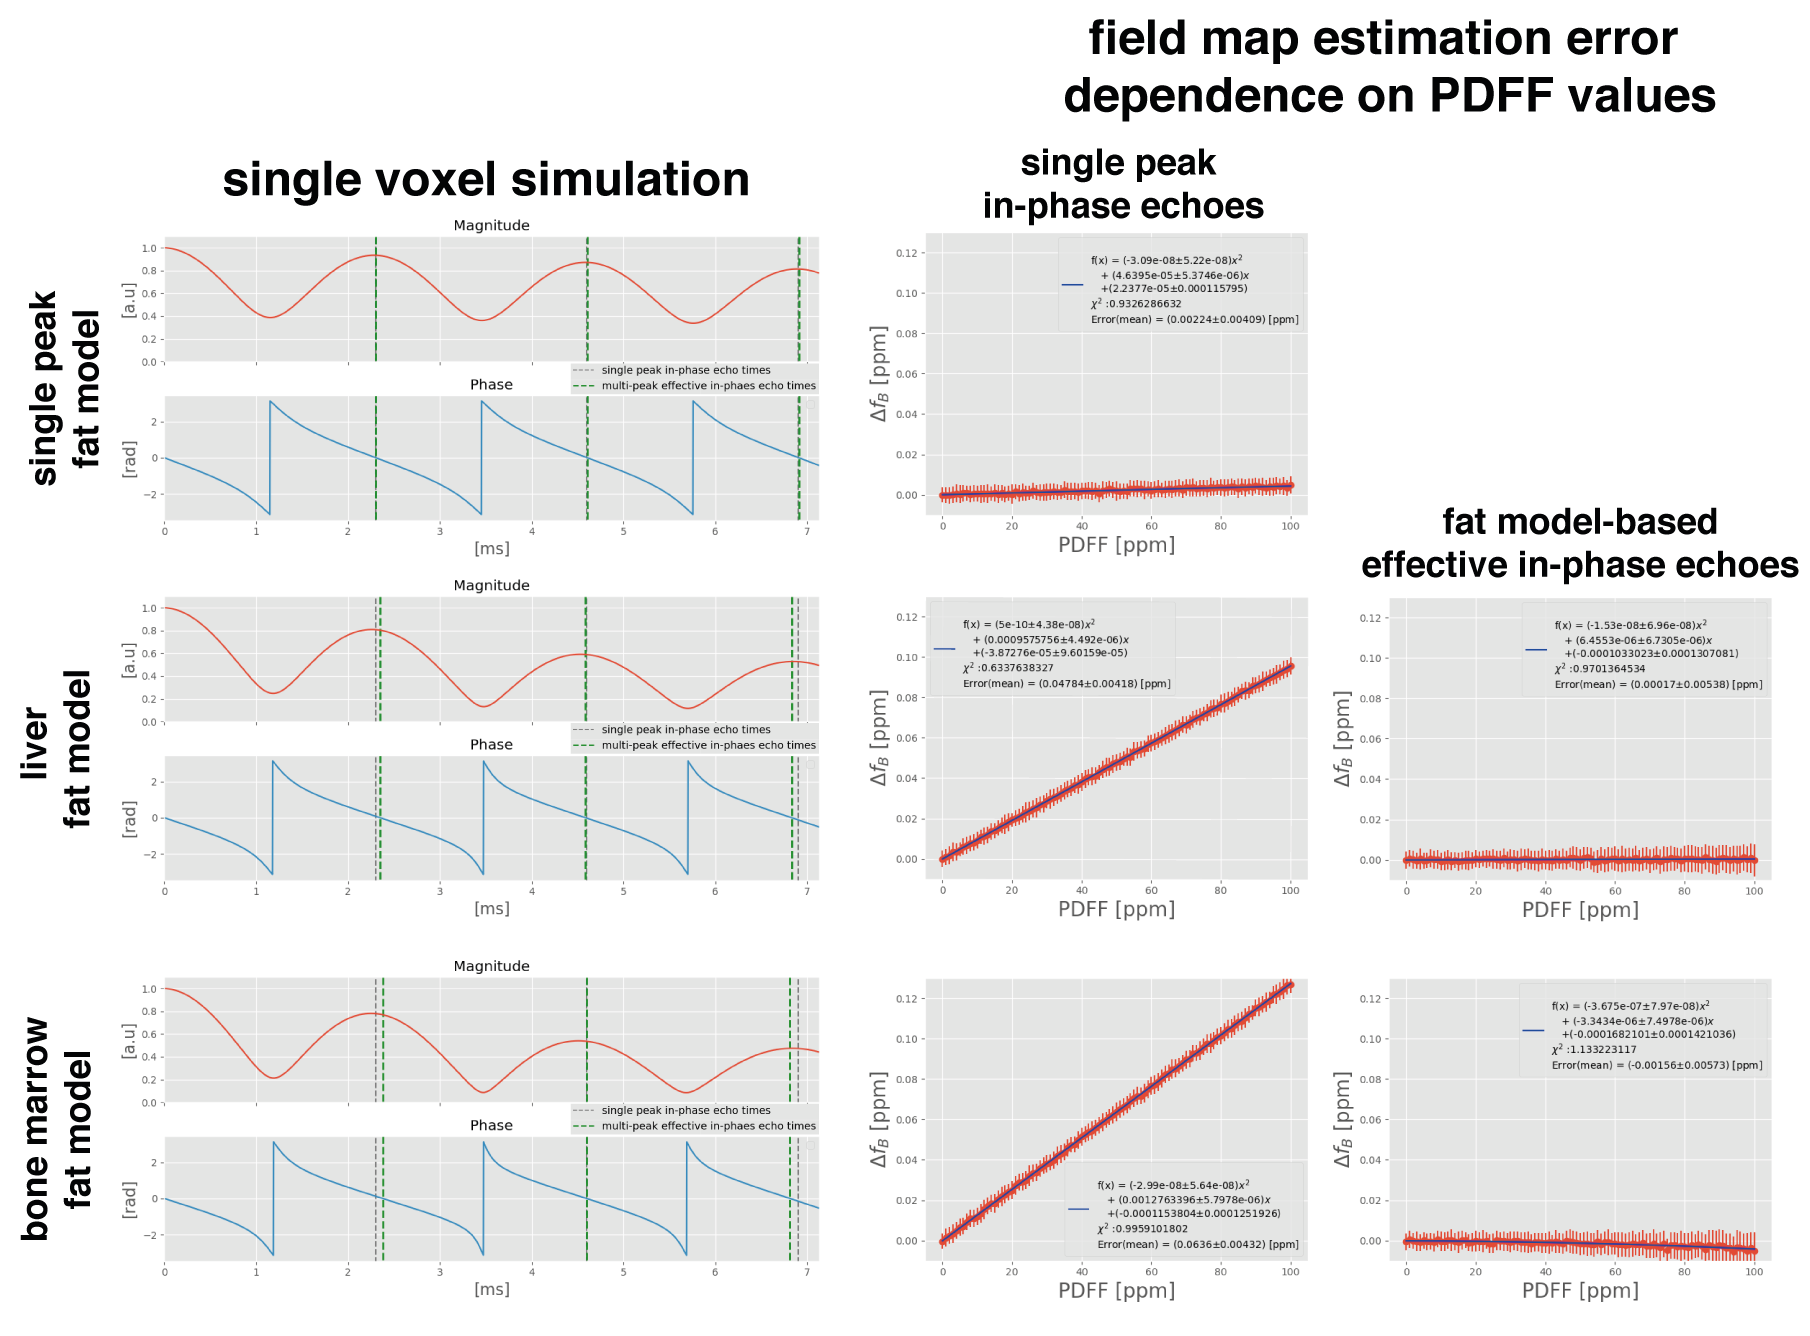
For$$$\;$$$the estimation of$$$\;$$$the difference between conventional single-peak and effective multi-peak fat-model a$$$\;$$$single-voxel simulation was performed using Eq.1 with either$$$\;$$$a single peak fat-model ($$$\Delta{f}=434\;$$$[Hz]), a fat-model specific to bone marrow11, a$$$\;$$$model specific to$$$\;$$$the liver12, a$$$\;$$$fat fraction of 70%,$$$\;R_{2}^{*}=30\;$$$[Hz] and $$$f_{B}$$$=0. For above bone marrow and liver model, the first 3 effective in-phase echo times were found to be equidistant in scanner time precision (0.01ms) and are TE=$$$[2.38,4.60,6.82]\;$$$ms and TE=$$$[2.35, 4.59, 6.83]\;$$$ms, respectively.
Monte Carlo Simulation
For the assessment of$$$\;$$$the field-map estimation error with$$$\;$$$fat fraction using$$$\;$$$both conventional single-peak or effective multi-peak in-phase echotimes a$$$\;$$$Monte Carlo simulation was performed. The$$$\;$$$fat fraction values were varied from 0 to 100%, an SNR of 100, $$$R_{2}^{*}=30\;$$$[Hz] and $$$f_{B}$$$=0 were$$$\;$$$used.
Correlation between field-map estimation error and susceptibility quantification bias
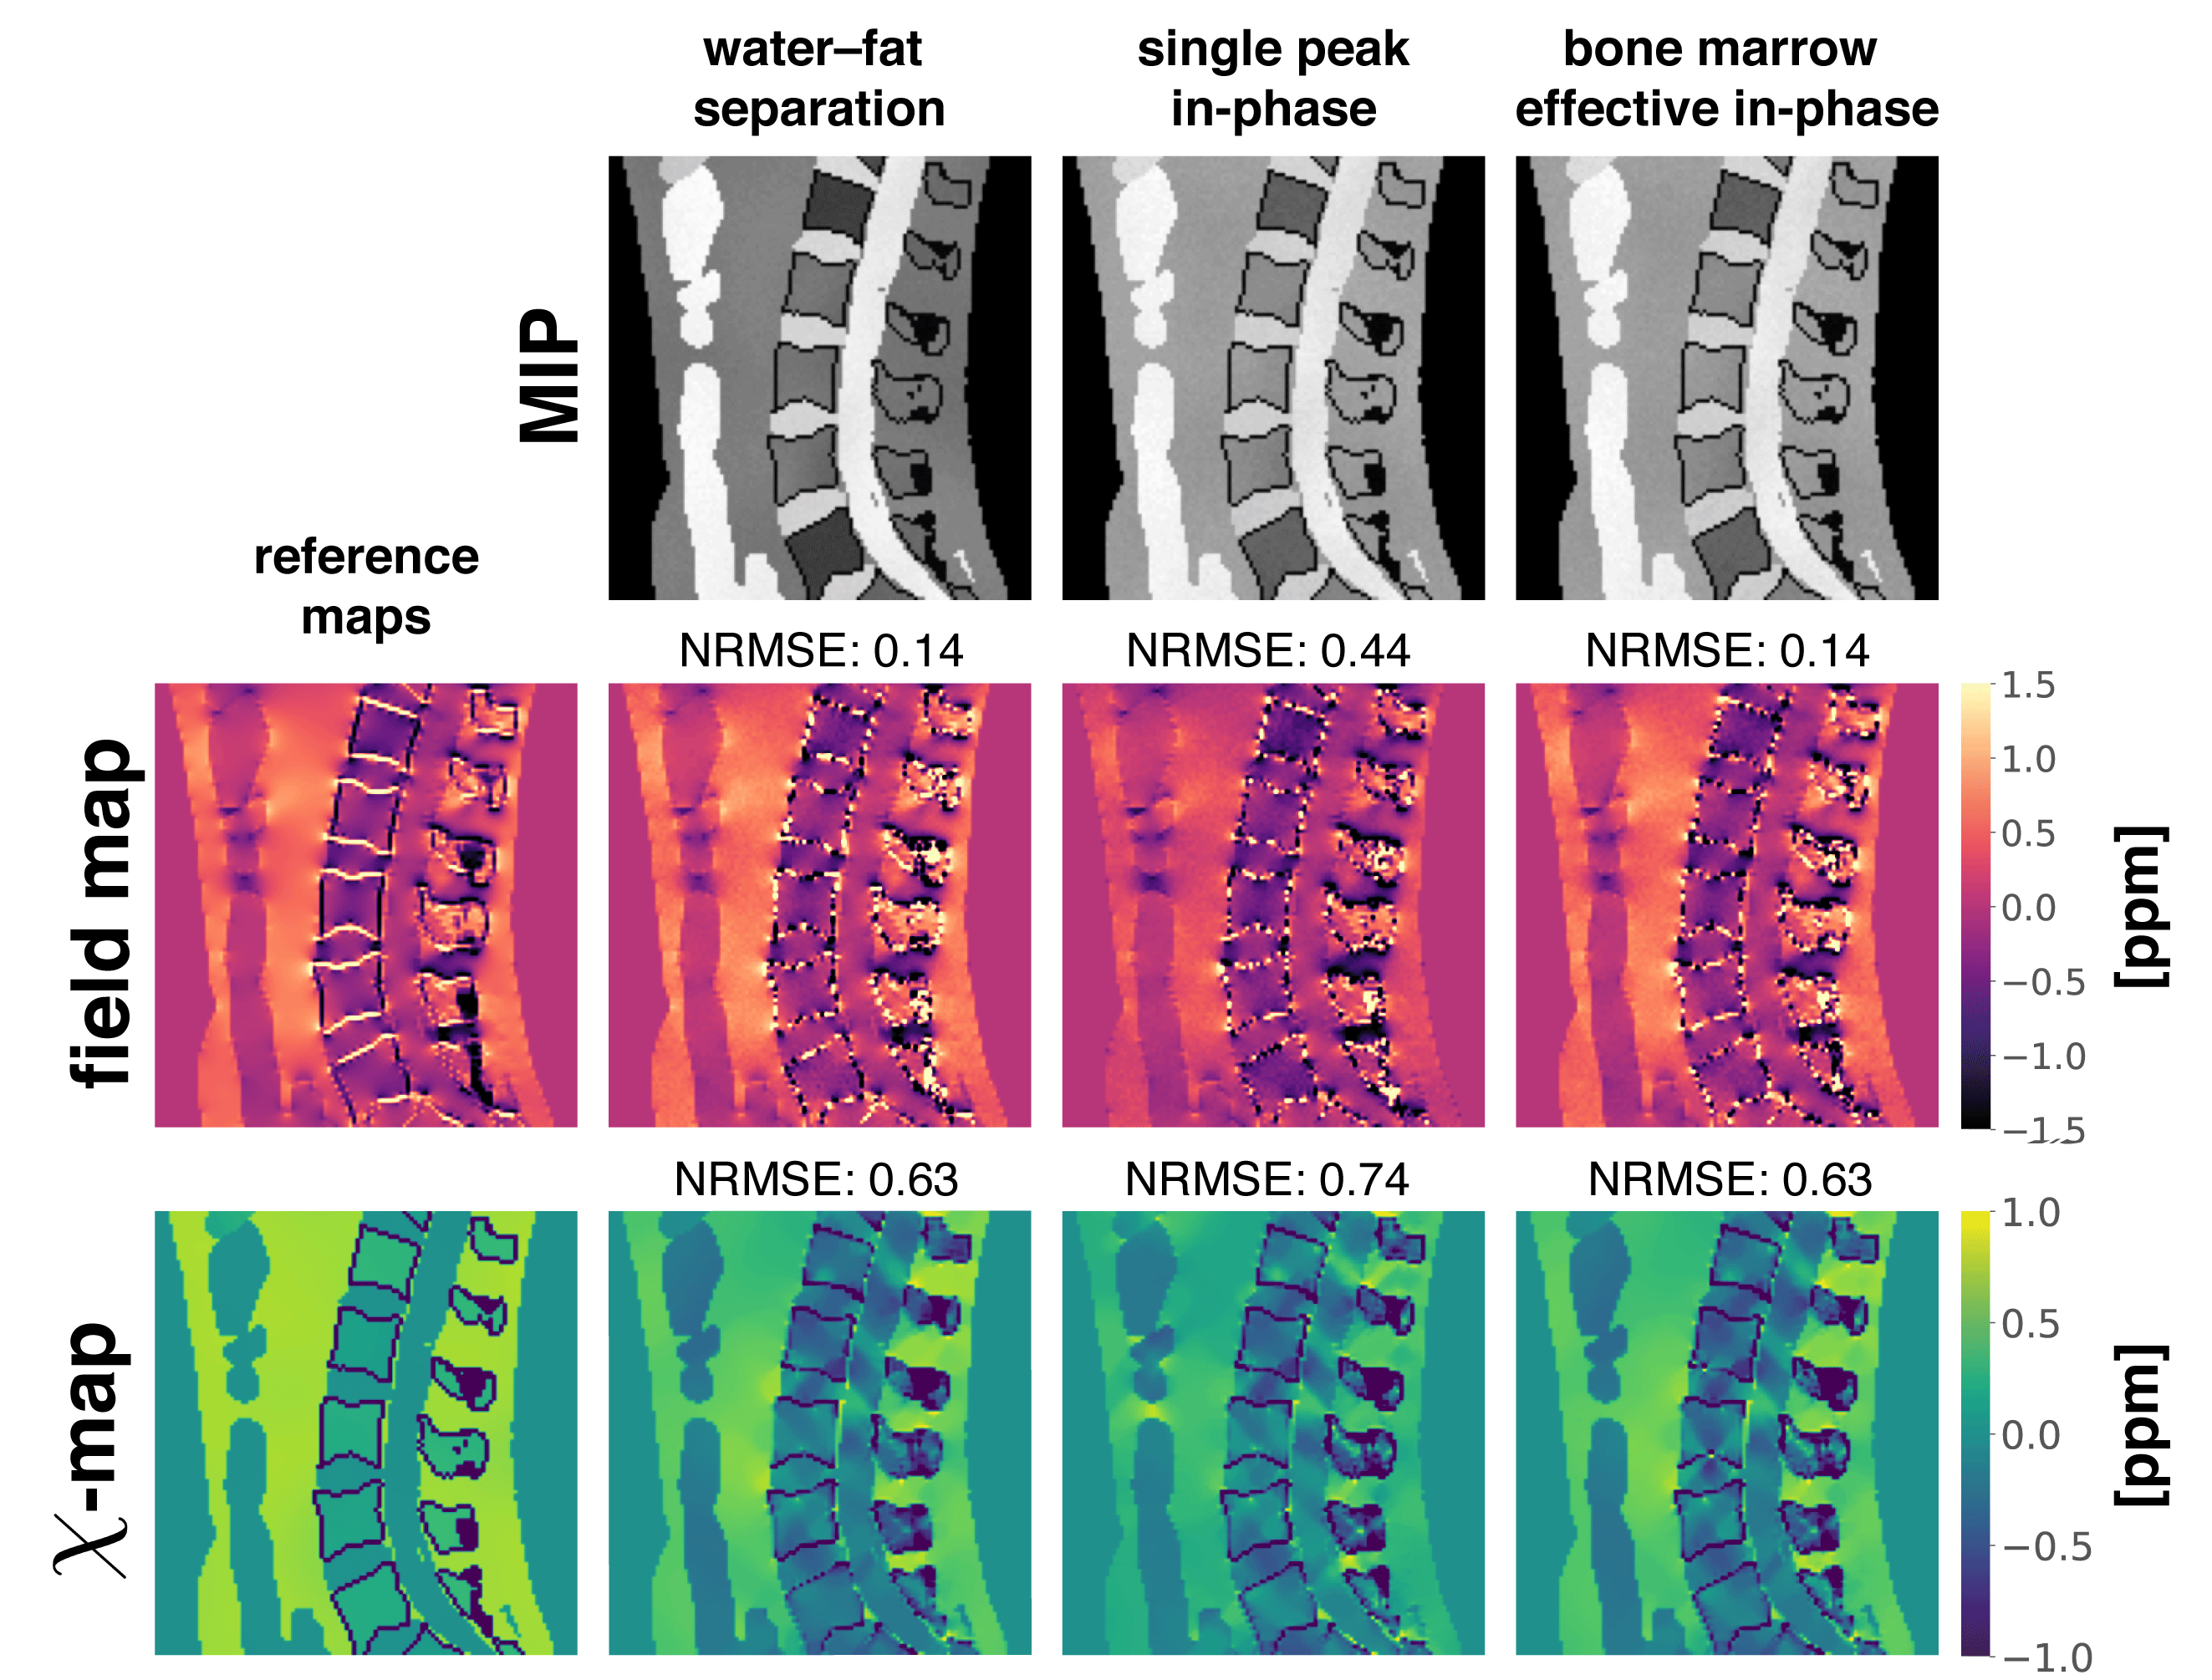
For the assessment of the quantification bias in a realistic anatomy, a$$$\;$$$numerical simulation based on$$$\;$$$the Duke phantom was performed10. Each tissue was assigned with$$$\;$$$either their literature value or$$$\;$$$values extracted from in$$$\;$$$vivo scans and forward simulated using Eq.(1) and either conventional water–fat separation echo times with$$$\;$$$6 echoes,$$$\;\text{TE}_{\text{min}}/\Delta{\text{TE}}=1.0\:$$$ms, conventional single-peak in-phase echo times$$$\;$$$or effective in-phase echo times for$$$\;$$$the two above mentioned fat-models. A$$$\;$$$background field was$$$\;$$$not simulated to allow for$$$\;$$$the estimation of$$$\;$$$the quantification bias$$$\;$$$of the$$$\;$$$local field-map only. Complex Gaussian noise was$$$\;$$$added to the$$$\;$$$data (SNR$$$\;$$$100). The field-map, water(–fat)-images and $$$R_2^*\;$$$-map were estimated using graph-cut algorithm13. The field-maps were inverted to$$$\;$$$a susceptibility-map using the recently proposed wfTFI method2.
In vivo measurements
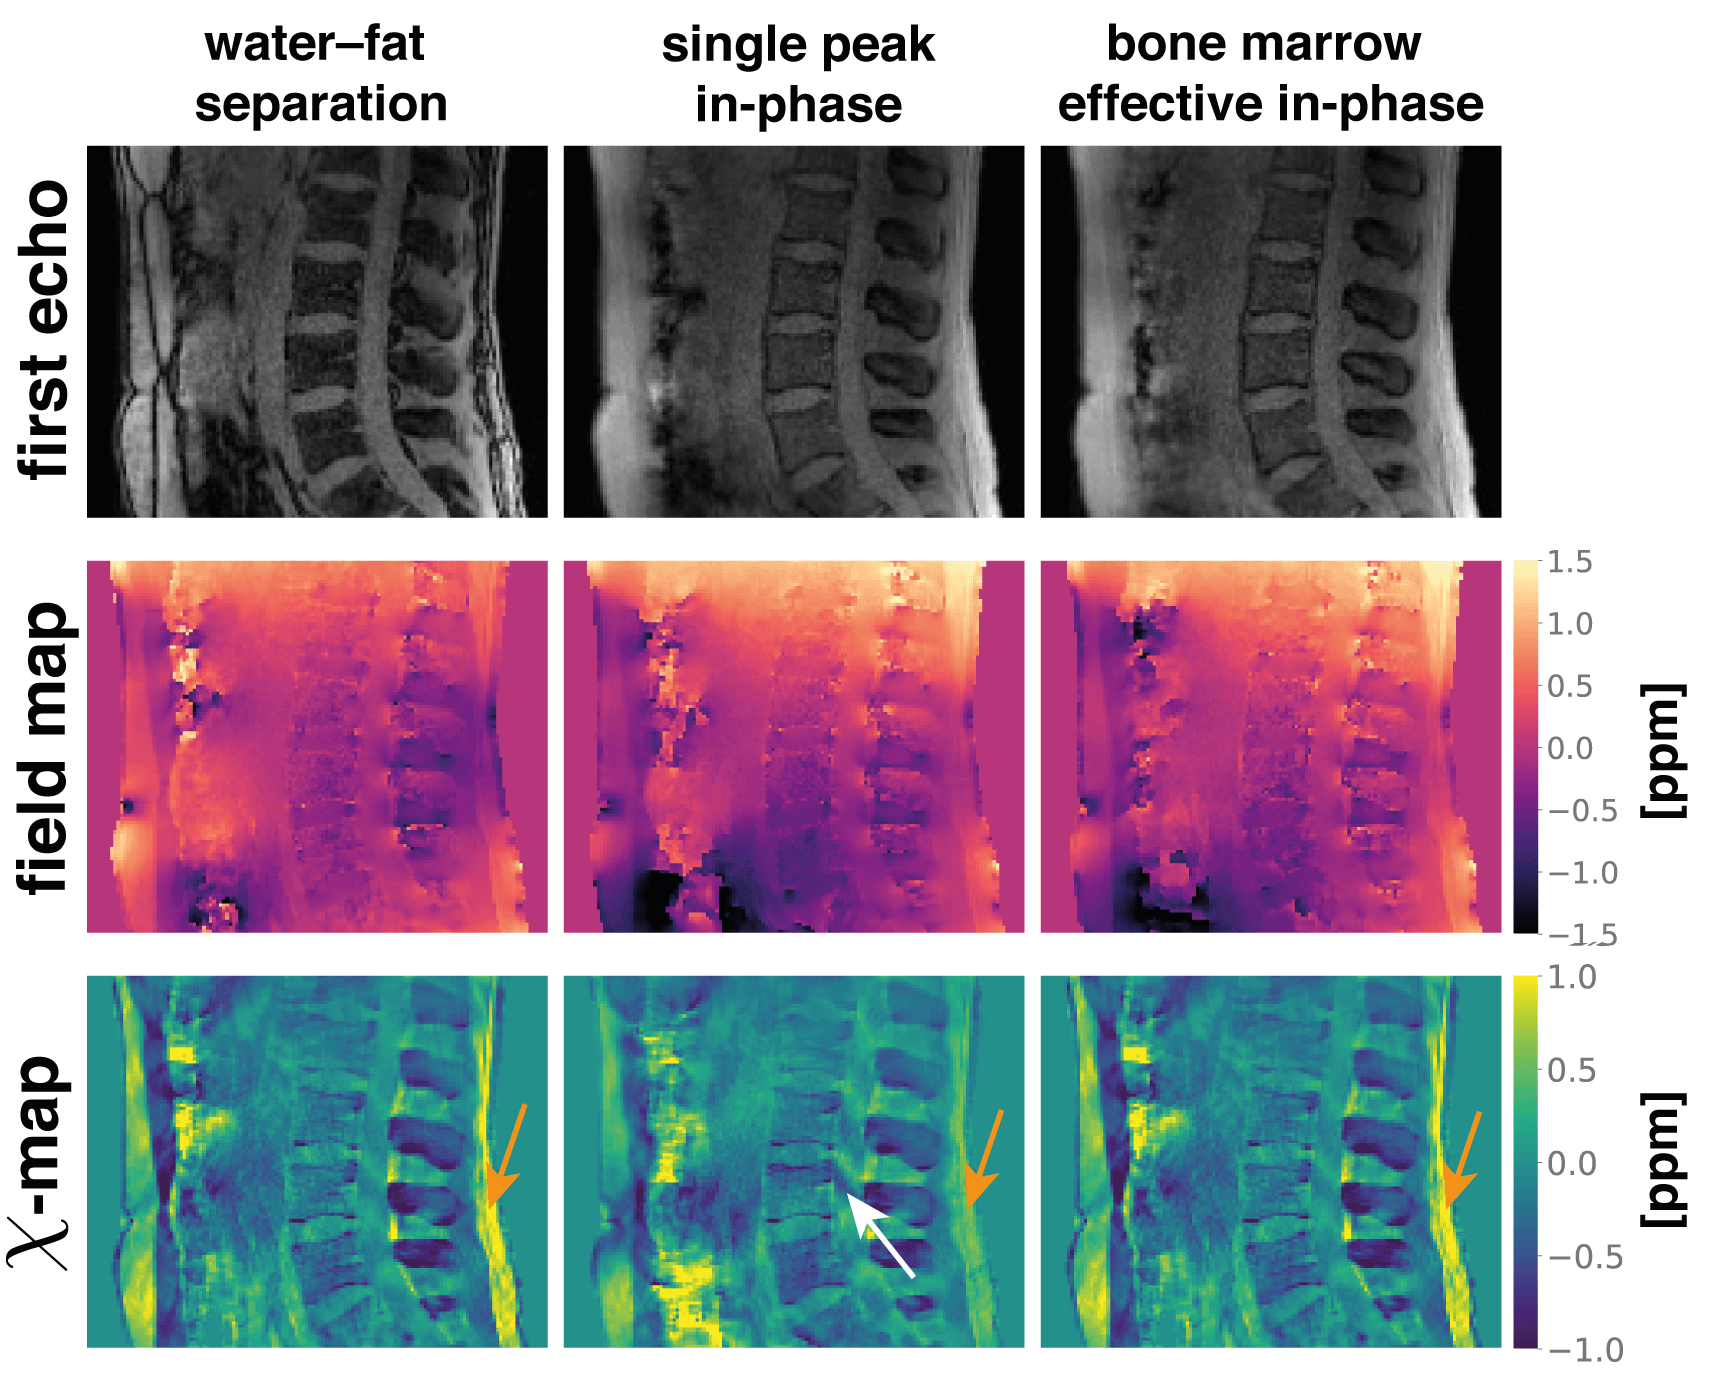
The aformentioned processing of$$$\;$$$graph-cut-based field-mapping followed by wfTFI QSM was applied to$$$\;$$$in vivo spine$$$\;$$$and breast scans$$$\;$$$of$$$\;$$$2 healthy volunteers. Scanning was performed on a 3$$$\:$$$T scanner (Ingenia$$$\;$$$Elition, Philips$$$\;$$$Healthcare, Best, The Netherlands) using a$$$\;$$$monopolar time-interleaved multi-echo gradient-echo sequence14.
Results
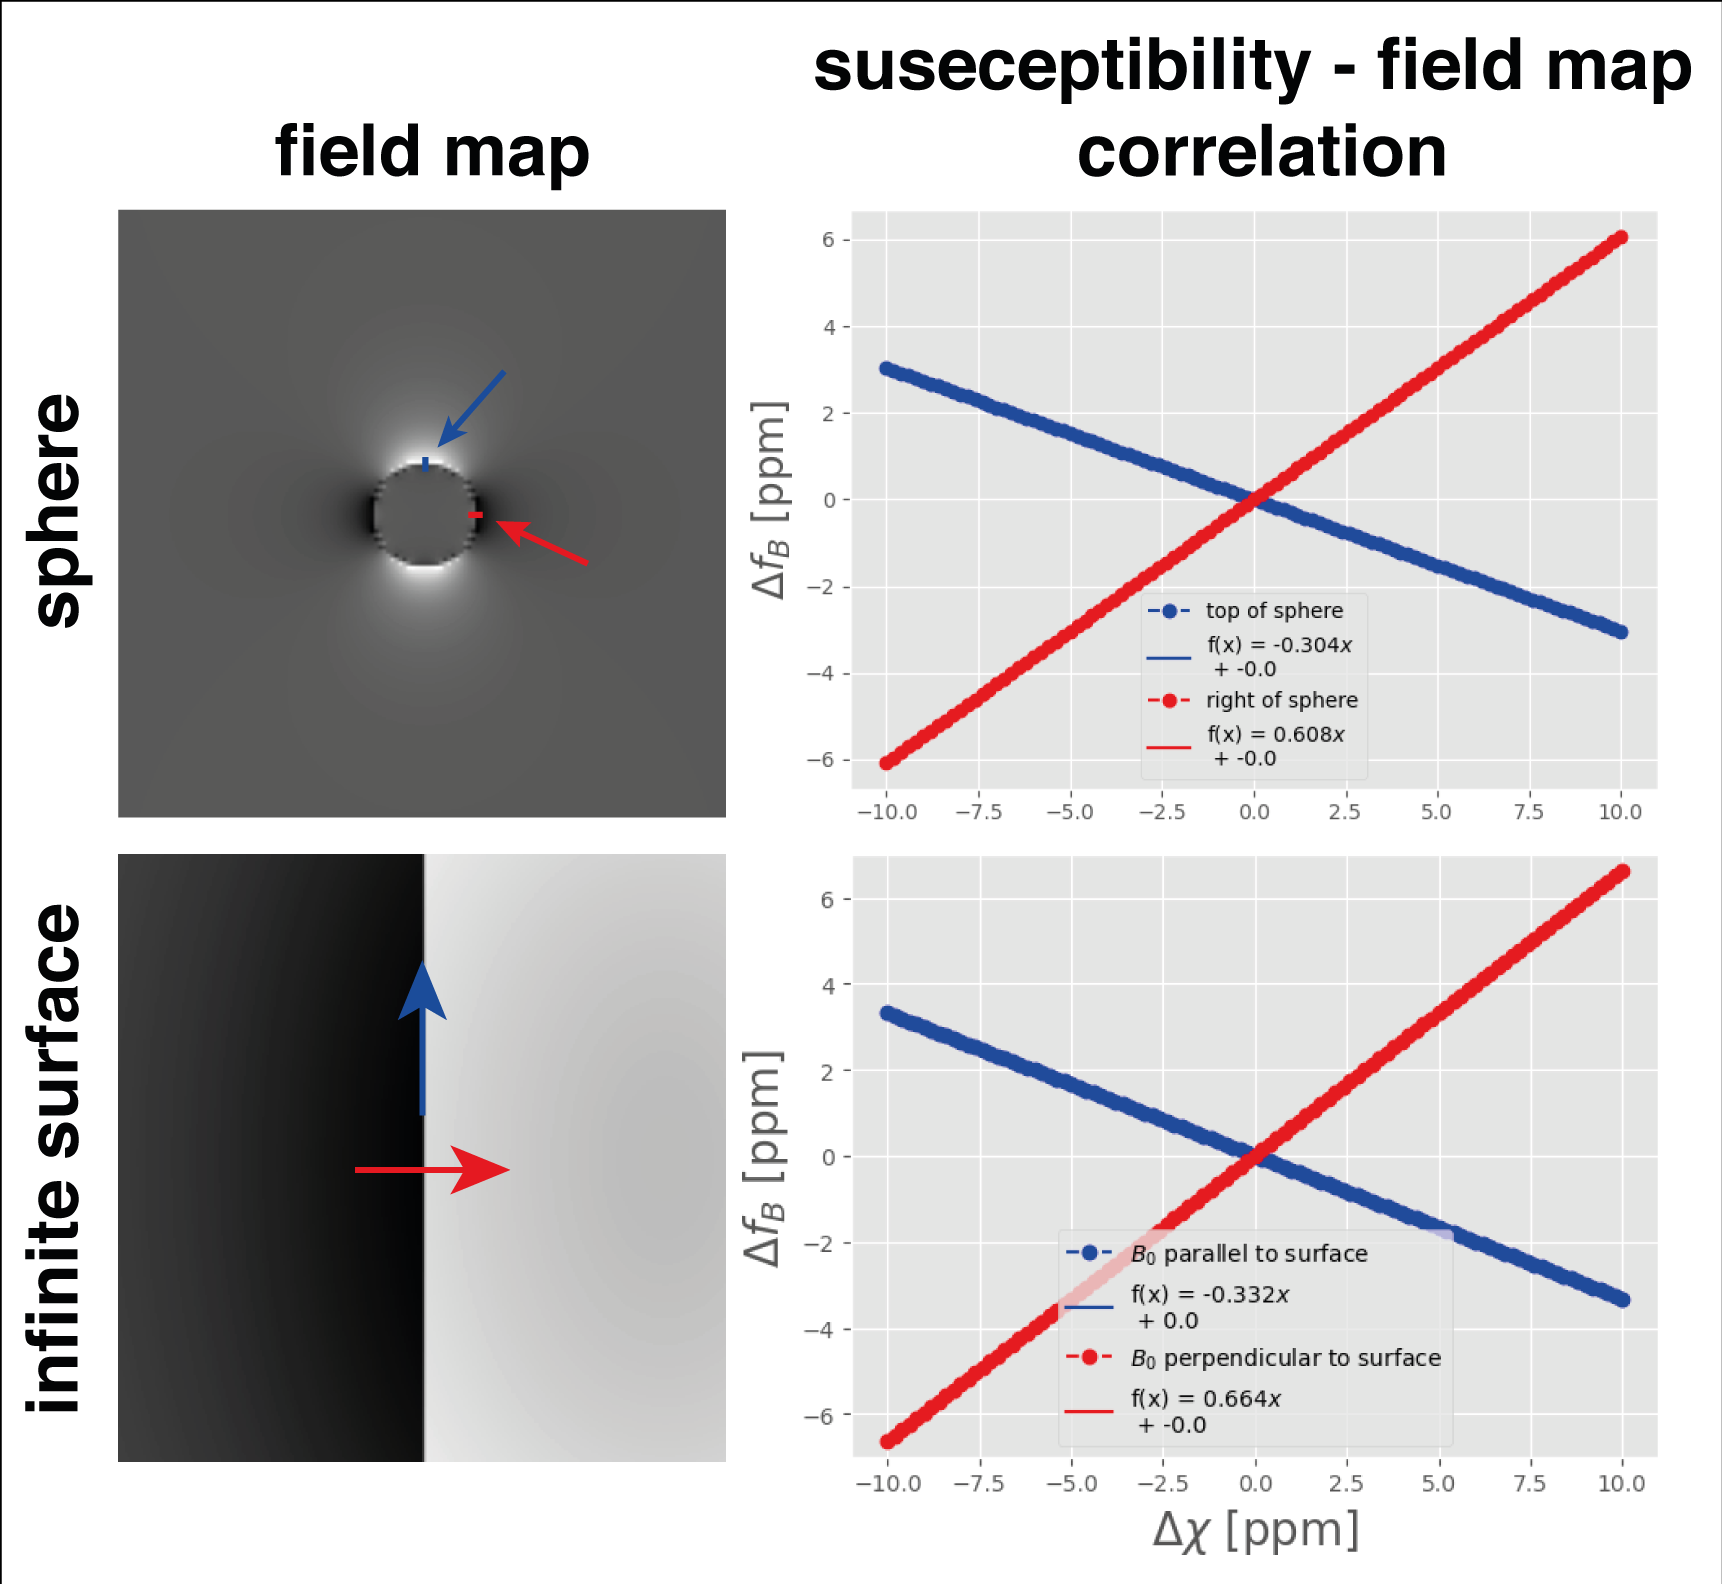
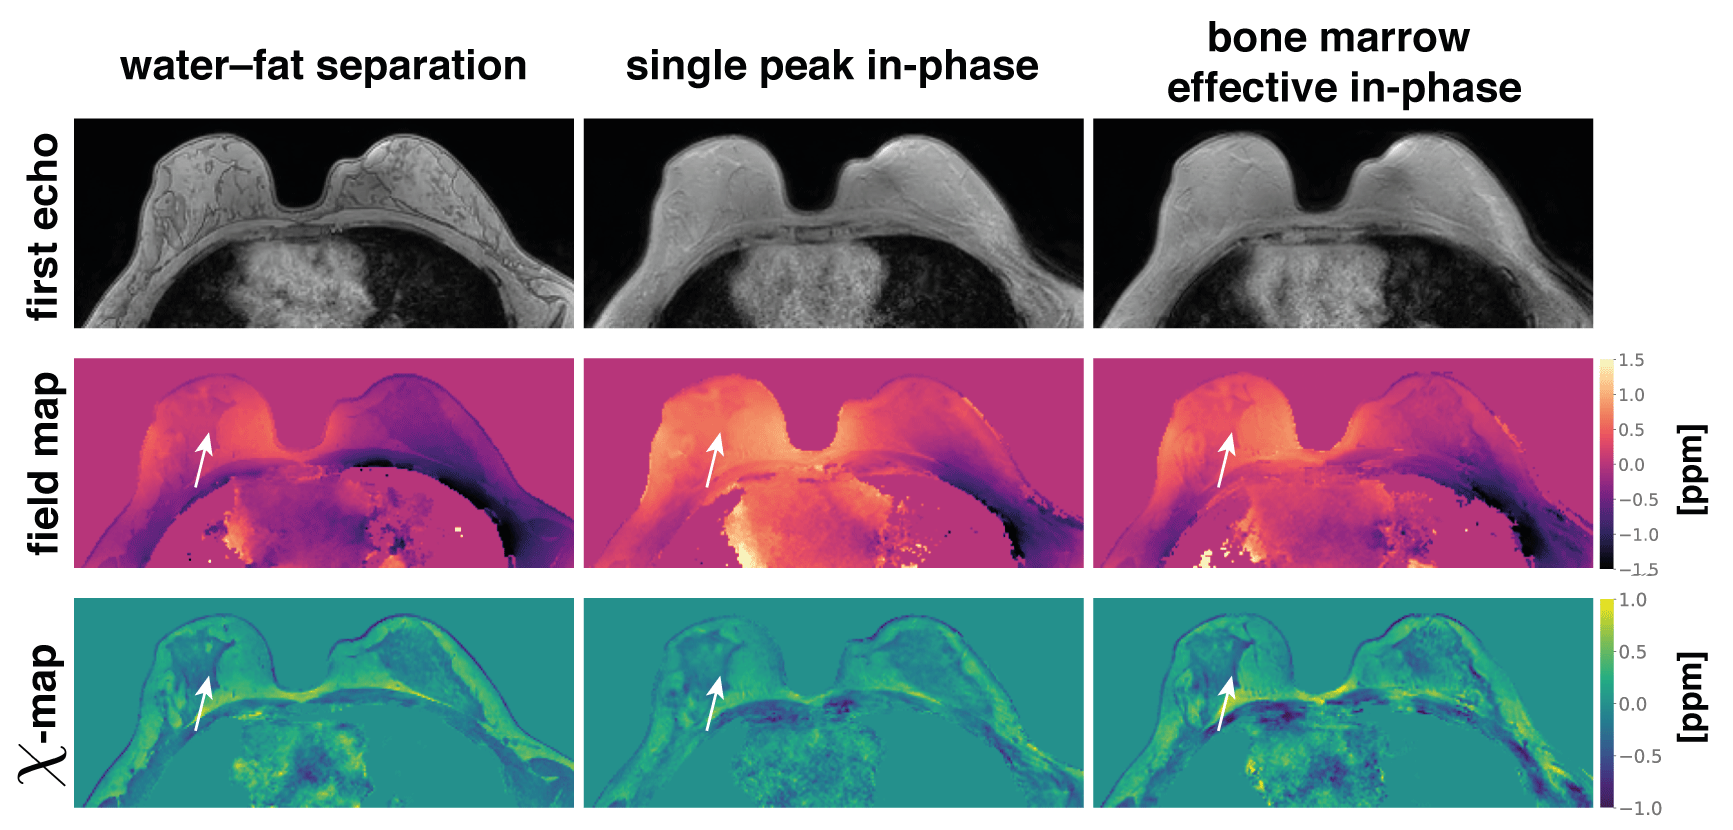
Using conventional single-peak in-phase echo times in$$$\;$$$a more realistic multi-peak environment, the$$$\;$$$fat phasor is$$$\;$$$not zero at$$$\;$$$the measured time points (Fig.1,$$$\;$$$column$$$\;$$$1). This introduces a field-map estimation bias of over 0.12$$$\;$$$ppm for voxels containing only fat (Fig.1, column 2). The$$$\;$$$use of effective multi-peak in-phase echo times can$$$\;$$$reduce error to the noise floor (Fig.1, column 3). The slope of the correlation between susceptibility differences and field-map differences at a spherical or infinite surface yields almost exactly the dominant values of the dipole kernel($$$-\dfrac{1}{3},\dfrac{2}{3}$$$)(Fig.2). The inverse of these values can hence be$$$\;$$$used to$$$\;$$$estimate susceptibility error from field-map estimation error. Meaning that the above 0.12$$$\;$$$ppm field-map estimation error$$$\;$$$can translate to an error of 0.36$$$\;$$$ppm in the susceptibility estimation.In$$$\;$$$the numerical simulation of$$$\;$$$a lumbar spine, effective multi-peak in-phase echo$$$\;$$$times achieve the$$$\;$$$same accuracy in field- and susceptibility-mapping as based on water-fat separation, while the single-peak in-phase estimates show significant quantification bias (Fig.3). In an$$$\;$$$in vivo spine scan, field-map estimation error$$$\;$$$in the single-peak in-phase pipeline propagates non-locally, as$$$\;$$$shown in the cerebrospinal fluid region (Fig.4). Effective multi-peak in-phase echos$$$\;$$$yield similar results to water-fat separation based maps. In an in vivo breast scan (Fig.5), the contrast$$$\;$$$in the right breast between fat$$$\;$$$and fibroglandular tissue$$$\;$$$is lost$$$\;$$$in QSM and the field-map using single-peak in-phase echoes, while effective multi-peak in-phase echos$$$\;$$$again yield similar results$$$\;$$$to water-fat separation based maps and$$$\;$$$a good delineation between tissue types.
Discussion
The$$$\;$$$use of effective multi-peak in-phase echo times$$$\;$$$can eliminate the field-map quantification bias introduced by$$$\;$$$the single-peak in-phase assumption. Although, effective multi-peak in-phase echo times$$$\;$$$are generally not equidistant a set of$$$\;$$$3 equidistant echo$$$\;$$$times can be$$$\;$$$found within scanner timing precision$$$\;$$$(0.01ms) for commonly used liver$$$\;$$$and bone marrow fat-models.The$$$\;$$$use of single-peak in-phase echoes introduces significant bias$$$\;$$$in the field-map, which, importantly, is voxel-wise dependent on$$$\;$$$the fat$$$\;$$$fraction.
Conclusion
Effective multi-peak in-phase echo times can$$$\;$$$be used for the quantification of susceptibility in body regions with$$$\;$$$a bias not$$$\;$$$greater than water–fat separation based estimation and overcome the$$$\;$$$limitations of single-peak in-phase echo times$$$\;$$$for susceptibility mapping in$$$\;$$$regions with fatty$$$\;$$$tissue.Acknowledgements
The present work was supported by the European Research Council (grantagreement No 677661, ProFatMRI). The authors also acknowledge research sup-port from Philips Healthcare.References
[1] Wang Y, Liu T. Quantitative Susceptibility Mapping (QSM): Decoding MRI Data for a Tissue Magnetic Biomarker. Magnetic Resonance in Medicine 2014; 73:82–101. 10.1002/mrm.25358.
[2] Boehm C, Sollmann N, Meineke J, Ruschke S, Dieckmeyer M, Weiss K, Zimmer C, Makowski MR, Baum T, Karampinos DC. Preconditioned water-fattotal field inversion: Application to spine quantitative susceptibility mapping. ; https://doi.org/10.1002/mrm.28903.
[3] Schweser F, Hermann KH, Deistung A, Atterbury M, Baltzer PA, Burmeis-ter HP, Kaiser WA, Reichenbach JR. Quantitative Magnetic Susceptibility Mapping (QSM) in Breast Disease Reveals Additional Information for MR-Based Characterization of Carcinoma Calcification. In: Proceedings 19.Annual Meeting International Society for Magnetic Resonance in Medicine, Montreal, 2011. p. 1014.
[4] Dimov AV, Liu Z, Spincemaille P, Prince MR, Du J, Wang Y. Bone Quantitative Susceptibility Mapping Using a Chemical Species-Specific R2* Signal Model With Ultrashort and Conventional Echo Data. Magnetic Resonance in Medicine 2017; 79:121–128. 10.1002/mrm.26648.
[5] Diefenbach MN, Meineke J, Ruschke S, Baum T, Gersing A, Karampinos DC. On the Sensitivity of Quantitative Susceptibility Mapping for Measuring Trabecular Bone Density. Magnetic Resonance in Medicine 2018; . 10.1002/mrm.27531.
[6] Sharma SD, Hernando D, Horng DE, Reeder SB. Quantitative Susceptibility Mapping in the Abdomen As an Imaging Biomarker of Hepatic Iron Overload. Magnetic Resonance in Medicine 2014; 74:673–683.10.1002/mrm.25448.
[7] Lin H, Wei H, He N, Fu C, Cheng S, Shen J, Wang B, Yan X, Liu C,Yan F. Quantitative Susceptibility Mapping in Combination With Water–Fat Separation for Simultaneous Liver Iron and Fat Fraction Quantification.European Radiology 2018; 28:3494–3504. 10.1007/s00330-017-5263-4.
[8] Jafari R, Sheth S, Spincemaille P, Nguyen TD, Prince MR, Wen Y, Guo Y,Deh K, Liu Z, Margolis D, Brittenham GM, Kierans AS, Wang Y. Rapid Automated Liver Quantitative Susceptibility Mapping. Journal of Magnetic Resonance Imaging 2019; 50:725–732. 10.1002/jmri.26632.
[9] Guo Y, Liu Z, Wen Y, Spincemaille P, Zhang H, Jafari R, Zhang S, Eskreis-Winkler S, Gillen KM, Yi P, Feng Q, Feng Y, Wang Y. Quantitative susceptibility mapping of the spine using in-phase echoes to initialize inhomogeneous field and R2* for the nonconvex optimization problem off at-water separation. NMR in Biomedicine 2019; 32:e4156. e4156 NBM-19-0042.R2, https://doi.org/10.1002/nbm.4156.
[10] Boehm C, Diefenbach MN, Kronthaler S, Meineke J, Weiss K,Makowski MR, Karampinos DC. Quantitative susceptibility mapping in water-fat regions using in-phase echoes introduces significant quantification bias. In: Proceedings 30. Annual Meeting International Society for Magnetic Resonance in Medicine, Online, 2021. p. 3972.
[11] Ren J, Dimitrov I, Sherry AD, Malloy CR. Composition of Adipose Tissue and Marrow Fat in Humans By1h Nmr At 7 Tesla. Journal of Lipid Research 2008; 49:2055–2062. 10.1194/jlr.d800010-jlr200.
[12] Hamilton G, Yokoo T, Bydder M, Cruite I, Schroeder ME, Sirlin CB, Middleton MS. In Vivo Characterization of the Liver Fat 1h Mr Spectrum. NMR in Biomedicine 2010; 24:784–790. 10.1002/nbm.1622.
[13] Boehm C, Diefenbach MN, Makowski MR, Karampinos DC. ImprovedBody Quantitative Susceptibility Mapping By Using a Variable-layerSingle-min-cut Graph-cut for Field-mapping. Magnetic Resonance inMedicine 2020; nil:mrm.28515. 10.1002/mrm.28515.
[14] Ruschke S, Eggers H, Kooijman H, Diefenbach MN, Baum T, Haase A,Rummeny EJ, Hu HH, Karampinos DC. Correction of Phase Errorsin Quantitative Water–Fat Imaging Using a Monopolar Time-InterleavedMulti-Echo Gradient Echo Sequence. Magnetic Resonance in Medicine2016; 78:984–996. 10.1002/mrm.26485.
Figures